HAL Id: hal-01871135
https://hal.uca.fr/hal-01871135
Submitted on 19 Sep 2018
HAL is a multi-disciplinary open access
archive for the deposit and dissemination of
sci-entific research documents, whether they are
pub-lished or not. The documents may come from
teaching and research institutions in France or
abroad, or from public or private research centers.
L’archive ouverte pluridisciplinaire HAL, est
destinée au dépôt et à la diffusion de documents
scientifiques de niveau recherche, publiés ou non,
émanant des établissements d’enseignement et de
recherche français ou étrangers, des laboratoires
publics ou privés.
during deep brain stimulation surgery
Ashesh Shah, Jerome Coste, Jean-Jacques Lemaire, Erik Schkommodau,
Simone Hemm-Ode
To cite this version:
Ashesh Shah, Jerome Coste, Jean-Jacques Lemaire, Erik Schkommodau, Simone Hemm-Ode. A
method to quantitatively evaluate changes in tremor during deep brain stimulation surgery. 2013 6th
International IEEE/EMBS Conference on Neural Engineering (NER), Nov 2013, San Diego, United
States. pp.1202-1205, �10.1109/NER.2013.6696155�. �hal-01871135�
1
Ashesh Shah
1, Jerome Coste
2, Jean-Jacques Lemaire
2, Erik Schkommodau
1and Simone Hemm-Ode
11. Institute of Medical and Analytical Technologies, University of Applied Sciences and Arts Northwestern Switzerland (phone: 0041 (0)61-467-4413; e-mail: [email protected]).
2. Centre Hospitalier Universitaire de Clermont-Ferrand, Image-Guided Clinical Neurosciences and Connectomics (EA 7292, IGCNC), Université d'Auvergne, France (email: [email protected]).
Abstract
Deep Brain Stimulation (DBS) surgery is used increasingly as a symptomatic treatment for patients with movement related neuro-degenerative disorders. However, the method of intraoperative symptom evaluation is subjective. This paper proposes a method to quantitatively evaluate tremor by measuring the acceleration of the patient's wrist during the surgery. The results of applying the method on 2 patients suggest that the acceleration measurements are very sensitive to the change in the tremor and that they can be used to identify clinically effective stimulation amplitudes. By collecting acceleration data from DBS surgeries for many patients, we hope to add more knowledge to the mechanisms of deep brain stimulation.
Funding
Research supported by Swiss National Science Foundation.
I. INTRODUCTION
Essential tremor and particularly Parkinson's disease are among the most prevalent neuro-degenerative movement related disorders [1]. Although, there are drugs which can be used to treat the symptoms, Deep Brain Stimulation (DBS) surgery is used as the alternative symptomatic treatment as well. For 25 years, DBS has become a commonly performed operation for the treatment of such disorders. Nevertheless, the mechanism of action of this therapy is so far only incompletely understood.
DBS is a complex surgical treatment in which electrodes are implanted in the deep brain structures which are stimulated using a neuro-stimulator implanted in the chest. Careful planning is done using software on anatomical images of the patient's brain to map out a path to implant the electrodes. In order to locate the best position of the electrodes to control the symptoms, most centers perform the surgery under local anesthesia. Micro-electrodes are used to record the electrical activity at previously planned locations to identify the location of the deep brain structures (Micro-electrode recording (MER). This is followed by test stimulation at some or all of those locations and changes in the patient's symptoms and occurring side effects are observed visually and by clinical examination. The electrode is finally implanted at the location with the best effect on the symptoms and the least side effects.
One aspect of DBS which needs to be improved is the symptom evaluation during the surgery[2]. The current methods are semi-quantitative and the judgment is largely based on the experience of the neurologist. Various methods to quantitatively evaluate tremor have been proposed using different methods like accelerometer, gyro meters, EMG. [3][4][5][6] [7]. However, very few methods [8] [9] [10] are designed to be used in the operating room (OR), while none of them have become a part of the routine surgical procedure. The method proposed in this paper uses accelerometer to quantify the change in the tremor of the patient. Compared to the existing methods based on accelerometers [11], this method is designed specifically for usage during the DBS surgery.
A method to quantitatively evaluate changes in tremor during Deep Brain
Stimulation surgery
II. METHOD
A. Equipment
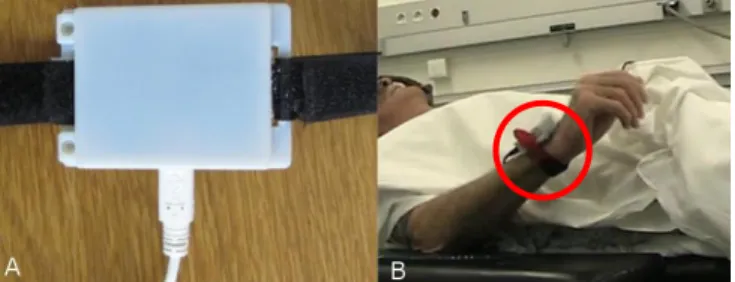
The quantitative evaluation of tremor is achieved using an accelerometer attached to the patient's wrist. A commercial accelerometer system evaluation board (STEVAL-MKI022V1, ST Micro, Geneva, Switzerland) is used for this purpose. The sampling frequency used in this method is 400 Hz. This evaluation board is placed inside an in-house developed plastic case and tied behind the wrist using a Velcro strap (Fig. 1). An USB cable (along with an extension) is used to interface this board with a laptop computer to record data.
Figure 1. A) Accelerometer Case B) Accelerometer mounted to patient during surgery
An in-house application (Lemur DBS) has been developed using Java (Oracle Corporation, California, USA) to record the data during the surgery. The software is initialized by interfacing it with the accelerometer board and defining the recording protocol (see below). The software then opens a recording window tweaked for the defined protocol. The software also allows the user to select the different parameters (like stimulation position or amplitude, for example) during an acceleration recording and stores these parameters for referencing at the time of data analysis. The recorded acceleration data is also displayed in graphical manner in real-time. The software creates a new data file for every acceleration recording to simplify the data analysis.
In order to synchronize the data between acceleration measurements and the intraoperative electrophysiological system (MicroGuide; Alpha Omega Eng., Israel), a USB-TTL cable is used. When an acceleration recording is started, a TTL signal is sent to the electrophysiology system, which stores the data along with other stimulation parameters.
A video recording is also made during the surgery for the interpretation of unexpected signals”
B. Surgical Procedure
The routine surgical procedure at the University Hospital in Clermont-Ferrand is distributed over 2 days, planning and surgical procedure. For the planning, a stereotactic frame (Leksell G frame, Elekta, Sweden) is mounted on the patient under the local anesthesia, and stereotactic images (CT and MRI) are obtained. The frame is then removed during the planning phase and remounted just before the surgery. Using the stereotactic planning software (Iplan 3, Brainlab, Germany) the deep brain structures were carefully identified and manually outlined on the patient's MRI. The labeling of the different structures is performed based on surgical anatomical knowledge and in-house 3D 4.7-Tesla MRI anatomy software [12]. After identifying the target structures, trajectories are planned for the patient in a manner to avoid blood vessels and the caudate nucleus. On these trajectories, test stimulation locations are identified from maximum 10 mm, in steps of 1mm in the region of interest.
The actual DBS surgery is performed on the next day of the planning. Before performing test stimulations, micro-electrode recording (MER) is done at the planned locations to confirm the position of the deep brain structures. MER is followed by test stimulations at all or most of the planned locations. During each test stimulation, the neurosurgeon changes the stimulation current from 0 to 3mA in steps of 0.2mA and identifies the stimulation amplitude at which a considerable change is observed in the patient's tremor (subjective threshold). The decrease in the tremor amplitude is identified in 5 levels (0, 25%, 50%, 75%, and 100%) and is noted along with the amplitude. The neurosurgeon also checks for side-effects of stimulation and the amplitudes at which they are first observed (side effect threshold).
After completion of test stimulation for all the positions, the neurosurgeon, mentally visualizes the subjective and the side-effect thresholds with reference to the anatomy. He then decides a final implant site for the electrode. In the case of bilateral implantation, the above procedure is repeated for the second brain hemisphere.
C. Data Recording Protocol
In order to maximize the acceleration data recording and minimize the obstruction to routine surgery, a recording protocol has been defined. Before the start of the surgery, a baseline recording is performed. The acceleration sensor is then disconnected during the remounting of the frame and or surgical preparations. Acceleration data recording is resumed during MER for every pre-planned position. The acceleration data recording is started after the start of MER recording in the electrophysiological system. After completion of MER for all the positions, test stimulations are performed at those locations to observe the effects
and the side-effects. Contrary to MER, acceleration data recording is started a few seconds before the test stimulation and is continued till the end of test simulation for every position. The data recorded without any stimulation is used as a baseline data during the analysis to identify changes in the patient's tremor.
On completion of the surgery, another acceleration recording is performed to use as a post-operative baseline.
D. Data Analysis
The accelerometer data analysis involves many different steps. The data recorded in the electrophysiology system is analyzed using Neuroexplorer (Nex Technologies, Madison, Alabama, USA).The synchronization time stamps and the stimulation amplitude are transferred to Matlab (Mathwork Inc., Massachusetts, USA) for further analysis. A Matlab function has been developed to analyze the data recorded for one side of the brain.
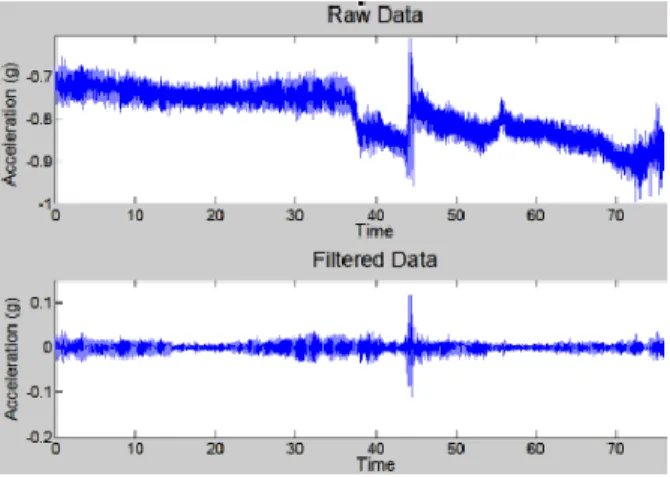
As a first step, the synchronization points and the stimulation amplitude are extracted from the electrophysiology data. This is followed by importing the acceleration recording into Matlab. The accelerometer data is then synchronized to the time stamps from the electrophysiology system and this synchronization is visually verified. The data from the 3 different axes of the accelerometer, stored in separate columns at first, are combined by calculating the RMS value for every sample. A time varying high-pass filter (cut-off 2 Hz) called smoothness priors method [13] was used to remove the low-frequency trends and acceleration due to gravity. Another low pass Butterworth filter (cut-off 10 Hz) is used to filter the noise and then statistical features are extracted in a windowed manner (Fig 2).
Figure 2. A. Raw signal including arm movement in addition to tremor (see arrows). B) The signal after application of smoothness priors and Butterworth filter.
A non-overlapping window of 2 seconds (795 samples on average) is chosen for optimum analysis based on factors like average duration of one stimulation amplitude, sampling rate, etc. From the windowed data, the standard deviation, signal energy, signal entropy, peak frequency and peak frequency amplitude (standard fft function in Matlab) are extracted. Thereafter, the baseline data recorded just before the corresponding test stimulation is imported into Matlab and statistical features are extracted from it in the same way as from the test stimulation acceleration data. These statistical features are then plotted on a graph and the best baseline features are selected for further analysis.
The statistical features extracted from the acceleration data are then normalized to the baseline value. These normalized features are used to extract the stimulation amplitude at which a change in the tremor is observed, referred as acceleration threshold. Three such acceleration thresholds are calculated from the normalized parameters corresponding to their change as compared to the baseline - 25% reduced, 50% reduced, and 75% reduced. Such acceleration thresholds are extracted for every position on each trajectory. These acceleration thresholds are represented graphically along with the side-effect thresholds and the neurologist is asked to decide a final implant site based on it for every brain side.
In addition to the threshold comparison, the extracted features (without normalization) are also evaluated statistically. The features extracted from the window just before the subjective threshold are compared to the one at the subjective threshold using the Wilcoxon two-sided rank test in order to compare the extracted features with the result of the neurologist.
E. Case studies
Under an ongoing clinical study at the University Hospital in Clermont-Ferrand, France, data was recorded following the above described protocol on 2 patients being good candidates for DBS surgery following the international guidelines [14]. No alterations were made to the routine surgical procedure. Both patients showed high amplitudes of tremor.
Patient 1 included in the study underwent a bilateral DBS implantation in the subthalmic nucleus (STN) for the treatment of Parkinson's disease. For the left brain, 11 positions were explored for test stimulation starting from the zona incerta to the
subthamic nucleus on two (6 on central and 5 on 2mm-posterior) parallel trajectories. For the right hemisphere, 18 positions were explored from the thalamus to the subthamic nucleus via the zona incerta on the same two trajectories (9 each). Along with high tremor patient 1 showed rigidity.
Patient 2 underwent bilateral DBS implantation in the ventralis intermedius nucleus (Vim) for the treatment of Essential tremor. Sixteen test stimulation locations were explored for central (8) and posterior (8) trajectories for the left brain, while 14 locations were explored for the same trajectories (7 each) for the right brain. Both trajectories were planned to explore different thalamic regions involved in tremor. Patient 2 presented high amplitudes of tremor and the neurosurgeon had to stimulate till 5.0 mA to observe an effect on the tremor.
III. RESULTS
A total of 59 recordings were made during the test stimulations for the two patients. Out of the different acceleration thresholds identified, 80% of the 75 thresholds are lower than the subjective threshold, 90% of the 50 threshold are lower than the subjective threshold and 99% of the 25 threshold are lower the subjective threshold.
All of the 3 different acceleration thresholds for patient 1 are equal to or lower than the subjective threshold suggesting that the stimulation location was very effective. Fig 3 shows the comparison between different thresholds for right brain, central trajectory. The 75% acceleration threshold corresponded well with the subjective thresholds. The final implant site determined based on acceleration thresholds (orange dashed vertical line in Fig 3) for both the brain sides are same as the one decided based on the surgery (yellow dashed vertical line in Fig 3).
Figure 3. Comparison of different thresholds for left hemisphere, central trajectory of patient 1. The highlighted markers indicate the final implant location chosen based on subjective data (blue with black border) and acceleration data (green with yellow border).
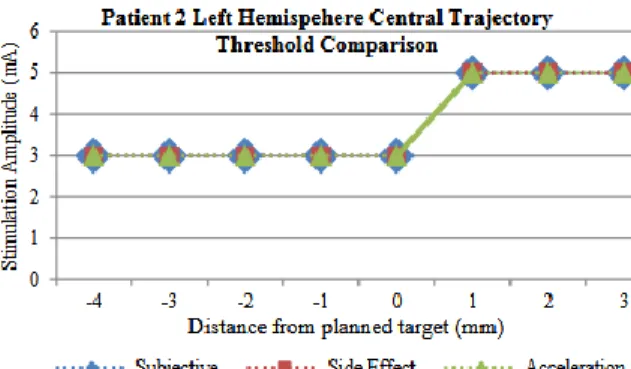
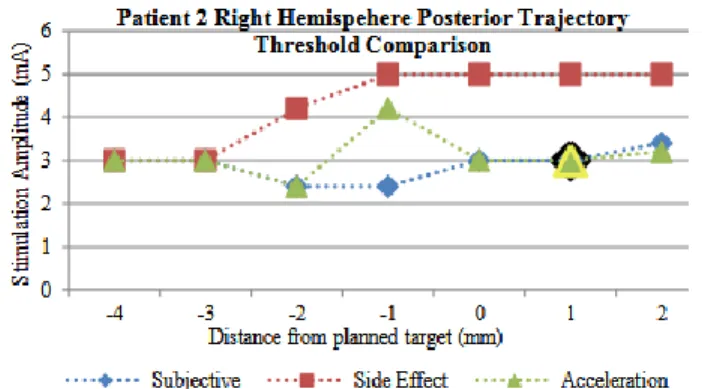
In the case of patient 2, at 14 of the 30 stimulation location the acceleration features changed by less than 50%. This suggests that the stimulation location was not effective. This was also confirmed for the central trajectory of the left brain (Fig 4), where, 75% acceleration thresholds and subjective thresholds were also not found for any position. For the other trajectories as well, the 75% acceleration threshold corresponded well with the subjective threshold. The final implant site determined based on acceleration thresholds (orange dashed vertical line in Fig 5) for both the brain sides are same as the one decided based on the surgery (yellow dashed vertical line in Fig 5)
Figure 4. Comparison of thresholds for central trajectory of left hemisphere of patient 2. Since the stimulation did not cause any effect, no thresholds were found.
Figure 5. Comparison of thresholds for the posterior trajectory of the right hemisphere of patient 2. The highlighted markers indicate the final implant location chosen based on subjective data (blue with black border) and acceleration data (green with the yellow border. yellow border).
The Wilcoxon two-sided signed rank test identified a statistically significant change in signal energy, standard deviation and peak frequency amplitude (p<0.01) suggesting that they are the more sensitive to the changes in tremor then the other parameters.
IV. DISCUSSION
The method described in the paper demonstrates that by using acceleration measurements of the patient's wrist it is possible to quantify the changes in tremor during DBS surgeries without hindering the existing surgical procedure. Simple statistical features like standard deviation can be used to quantify the changes in the tremor of the patient. From the results of the two patients, it is clear that the acceleration measurements are very sensitive to the changes in tremor. The differences between the subjective and the acceleration threshold suggest that by objectively evaluating tremor, target selection in DBS can be improved.
One of the main factors that influence the objective evaluation using acceleration data is the baseline data. It is very important that during the baseline data recording, the patient is in a state of high tremor.
Although this method can objectively evaluate tremor, it has so far only been used for post-operative analysis and not yet in the operating room during the target selection procedure. Thus, our next step is to implement the data analysis in our recording software to extract the statistical features in real-time. We intend to visualize these features and other information about the surgery on the patient's anatomical images so as to support the neurosurgeon during target selection.
In addition to the optimization of the targeting procedure, the collected acceleration data will be correlated with the anatomical structures and electrophysiological signalsto get more knowledge about the mechanism of action of DBS. This is the primary intention why to record acceleration data during MER in the clinical study. By collecting data in many surgeries and correlating them to different information about the deep brain, new information related to the mechanisms of DBS may come to light.
V. CONCLUSION
The current paper presents a methodology allowing intraoperative acceleration measurements for tremor evaluation during DBS electrode implantation. First results are encouraging but have to be confirmed in further patients included in the clinical study. The objectively obtained data in correlation with the patient's anatomy might represent an interesting approach to further elucidate the mechanism of action of DBS.
ACKNOWLEDGMENT
REFERENCES
[1] M. Stacy, “Medical Treatment of Parkinson Disease,” Neurologic Clinics, vol. 27, no. 3, pp. 605–631, 2009.
[2] S. Hemm and K. Wårdell, “Stereotactic implantation of deep brain stimulation electrodes: a review of technical systems, methods and emerging
tools,” Med Biol Eng Comput, vol. 48, no. 7, pp. 611–624, 2010.
[3] G. Rigas, A. Tzallas, D. Tsalikakis, S. Konitsiotis, and D. Fotiadis, “Real-time quantification of resting tremor in the Parkinson's disease,” pp. 1306–
1309.
[4] S. M. Rissanen, M. Kankaanpaä, M. P. Tarvainen, V. Novak, P. Novak, Kun Hu, B. Manor, O. Airaksinen, and P. A. Karjalainen, “Analysis of EMG
and Acceleration Signals for Quantifying the Effects of Deep Brain Stimulation in Parkinson’s Disease,” IEEE Trans. Biomed. Eng, vol. 58, no. 9, pp. 2545–2553, 2011.
[5] L. M. Gil, T. P. Nunes, F. H. S. Silva, A. C. D. Faria, and P. L. Melo, “Analysis of human tremor in patients with Parkinson disease using entropy
measures of signal complexity,” (eng), Conf Proc IEEE Eng Med Biol Soc, vol. 2010, pp. 2786–2789, 2010.
[6] H. Jeon, S. K. Kim, B. Jeon, and K. S. Park, “Distance estimation from acceleration for quantitative evaluation of Parkinson tremor,” (eng), Conf Proc
IEEE Eng Med Biol Soc, vol. 2011, pp. 393–396, 2011.
[7] P. H. G. Mansur, L. K. P. Cury, A. O. Andrade, A. A. Pereira, G. A. A. Miotto, A. B. Soares, and E. L. M. Naves, “A review on techniques for tremor
recording and quantification,” (eng), Crit Rev Biomed Eng, vol. 35, no. 5, pp. 343–362, 2007.
[8] M. M. Koop, A. Andrzejewski, B. C. Hill, G. Heit, and H. M. Bronte-Stewart, “Improvement in a quantitative measure of bradykinesia after
microelectrode recording in patients with Parkinson's disease during deep brain stimulation surgery,” (eng), Mov Disord, vol. 21, no. 5, pp. 673–678, 2006.
[9] M. J. Birdno, A. M. Kuncel, A. D. Dorval, D. A. Turner, and W. M. Grill, “Tremor varies as a function of the temporal regularity of deep brain
stimulation,” (eng), Neuroreport, vol. 19, no. 5, pp. 599–602, 2008.
[10] S. D. Tabbal, F. J. Revilla, J. W. Mink, P. Schneider-Gibson, A. R. Wernle, G. A. de Erausquin, J. S. Perlmutter, K. M. Rich, and J. L. Dowling,
“Safety and efficacy of subthalamic nucleus deep brain stimulation performed with limited intraoperative mapping for treatment of Parkinson's disease,” (eng), Neurosurgery, vol. 61, no. 3 Suppl, pp. 119-27; discussion 127-9, 2007.
[11] H. L. Journee, A. A. Postma, and M. J. Staal, “Intraoperative neurophysiological assessment of disabling symptoms in DBS surgery,” (eng),
Neurophysiol Clin, vol. 37, no. 6, pp. 467–475, 2007.
[12] J. J. Lemaire, F. Caire, J. M. Bonny, J. Kemeny, A. Villeger, and J. Chazal, “Contribution of 4.7-Tesla MRI in the analysis of the MRI anatomy of the
human subthalamic area,” Acta Neurochir (Wien), vol. 146, pp. 906–907, 2004.
[13] M. Tarvainen, P. Ranta-aho, and P. Karjalainen, “An advanced detrending method with application to HRV analysis,” IEEE Trans. Biomed. Eng, vol.
49, no. 2, pp. 172–175, 2002.
[14] A. E. Lang and H. Widner, “Deep brain stimulation for Parkinson's disease: Patient selection and evaluation,” Mov Disord, vol. 17, no. S3, pp. S94,