Publisher’s version / Version de l'éditeur:
Vous avez des questions? Nous pouvons vous aider. Pour communiquer directement avec un auteur, consultez la
première page de la revue dans laquelle son article a été publié afin de trouver ses coordonnées. Si vous n’arrivez pas à les repérer, communiquez avec nous à PublicationsArchive-ArchivesPublications@nrc-cnrc.gc.ca.
Questions? Contact the NRC Publications Archive team at
PublicationsArchive-ArchivesPublications@nrc-cnrc.gc.ca. If you wish to email the authors directly, please see the first page of the publication for their contact information.
https://publications-cnrc.canada.ca/fra/droits
L’accès à ce site Web et l’utilisation de son contenu sont assujettis aux conditions présentées dans le site LISEZ CES CONDITIONS ATTENTIVEMENT AVANT D’UTILISER CE SITE WEB.
Internal Report (National Research Council of Canada. Division of Building
Research), 1966-08-01
READ THESE TERMS AND CONDITIONS CAREFULLY BEFORE USING THIS WEBSITE.
https://nrc-publications.canada.ca/eng/copyright
NRC Publications Archive Record / Notice des Archives des publications du CNRC :
https://nrc-publications.canada.ca/eng/view/object/?id=7a7c3635-ff28-44ac-a2f6-c7fa1e5638de
https://publications-cnrc.canada.ca/fra/voir/objet/?id=7a7c3635-ff28-44ac-a2f6-c7fa1e5638de
NRC Publications Archive
Archives des publications du CNRC
For the publisher’s version, please access the DOI link below./ Pour consulter la version de l’éditeur, utilisez le lien DOI ci-dessous.
https://doi.org/10.4224/20386784
Access and use of this website and the material on it are subject to the Terms and Conditions set forth at
Temperature and humidity in houses, Ottawa, 1957-59
NATIONAL RESEARCH COUNCIL
CANADA
DIVISION OF BUILDING RESEARCH
TEMPERATURE AND HUMIDITY IN HOUSES, OTTAWA, 1957-59
by
A.D. Kent
/;,N /).. LYZEO
Internal Report No
329
of the
Division of Building Re search
OTTAWA
PREFACE
The indoor climate in buildings is a subject of some
considerable importance and of great interest to the Division.
The conditions maintained in Canadian single -family dwellings
are of particular interest. While these are strongly related to
the outdoor conditions, winter and summer, they reflect also
the performance of the house as an enclosure separating indoor
and outdoor conditions, the heating equipment performance and
the living habits of the occupants. It was considered
worth-while to accumulate records of indoor climate in single -family
house s in various locations as the occasion arose. The records
obtained for 13 houses in Ottawa from 1957 to 1959 are now
reported.
The author, a mechanical engineer and a research
officer with the Building Services Section, has a special interest
in heating equipment and its performance.
Ottawa
N. B. Hutcheon
TEMPERATURE AND HUMIDITY IN HOUSES, OTTAWA, 1957-59
by
A.D. Kent
The temperature and humidity in houses affect the comfort
of the occupants and the performance of the building and furnishings.
Very low humidity may have adverse physiological effects and may
cause damage due to shrinkage of moisture - sensitive materials.
Excessive humidity may result in objectionable condensation on
windows and within the structure in winter, and deterioration of
materials due to high moisture content.
Published information on the actual temperatures and
humiditie s in re sidence s in Canada is very limited. Surveys of
some American homes have been made by the National Bureau of
Standards (l) and more recently the Housing and Home Finance
Agency (2), using reliable instruments, but these results are not
directly applicable to Canadian conditions.
The moisture content of the air inside a house depends
upon the net effect of the various sources of moisture gain and loss.
Air exfiltration or ventilation is usually the major source of moisture
loss during the heating season. Thus, the inside relative humidity
depends upon a number of factors; e. g., the tightness of doors and
windows, outside weather conditions, and the use of exhaust fans or
humidifying equipment. The living habits of the occupants may
therefore have much effect on the humidity.
To obtain information on the actual indoor climate in occupied
Canadian homes a program was begun in 1957, involving a number of
Ottawa houses and later additional houses in Saskatoon, Sask., Camp
Gagetown, N.B., Halifax, N.S. and Vancouver, B. C. Temperatures
and relative humiditie s were recorded continuously over a period of
a year or more. In some house s consumption of fuel and electricity
and the operating time of oil burners and circulating fans were also
recorded. These records are contained in a separate series of reports.
This report contains the results of a survey of the indoor
temperatures and relative humidities for thirteen Ottawa dwellings
and the corresponding outdoor temperature s and relative humidities
for a period of two full years, from the beginning of October 1957 to
the end of September 1959. A similar report covering houses in the
2
-Halifax area is contained in DBR Internal Report No. 261 (3).
Other reports are planned for the surveys in Saskatoon, Camp
Gagetown and Vancouver.
DESCRIPTION OF HOUSES
The houses selected for observation belonged to staff
members of the Division who showed sufficient interest in the
project and in the psychrometric conditions prevalent in their
own homes to allow instruments to be installed. Previous
experience had shown that an interest in the project by members
of the family was essential. The types and sizes of houses in
the group were quite varied, and the locations were scattered
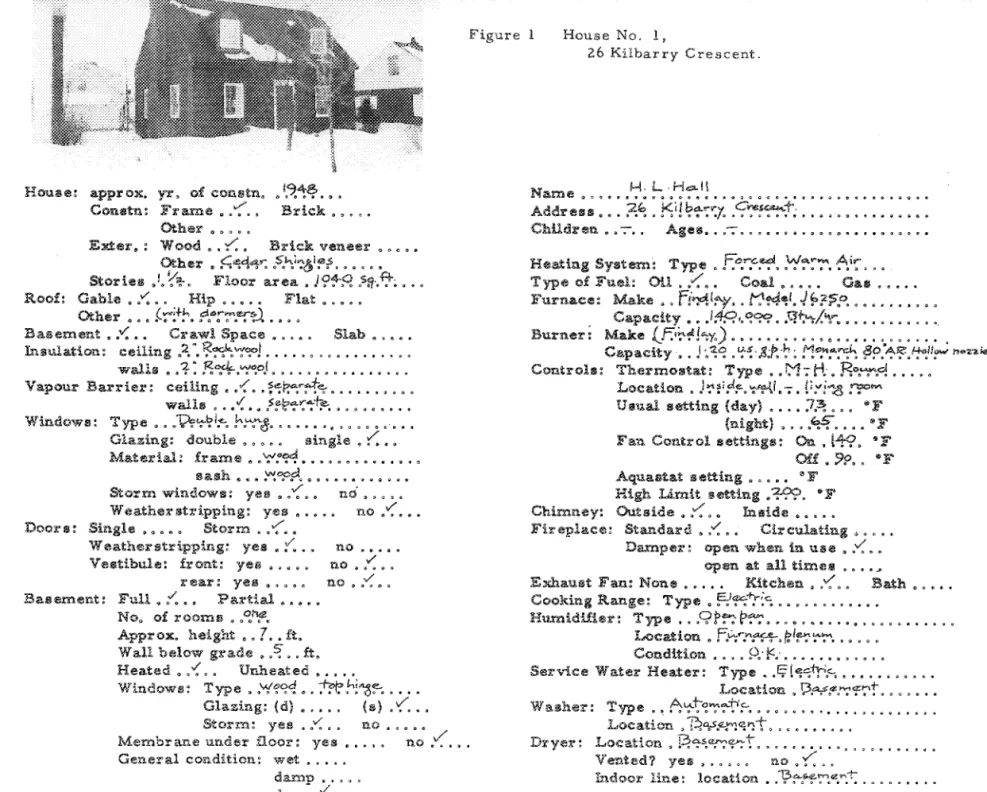
over the city. A listing of the house s and their general de scription
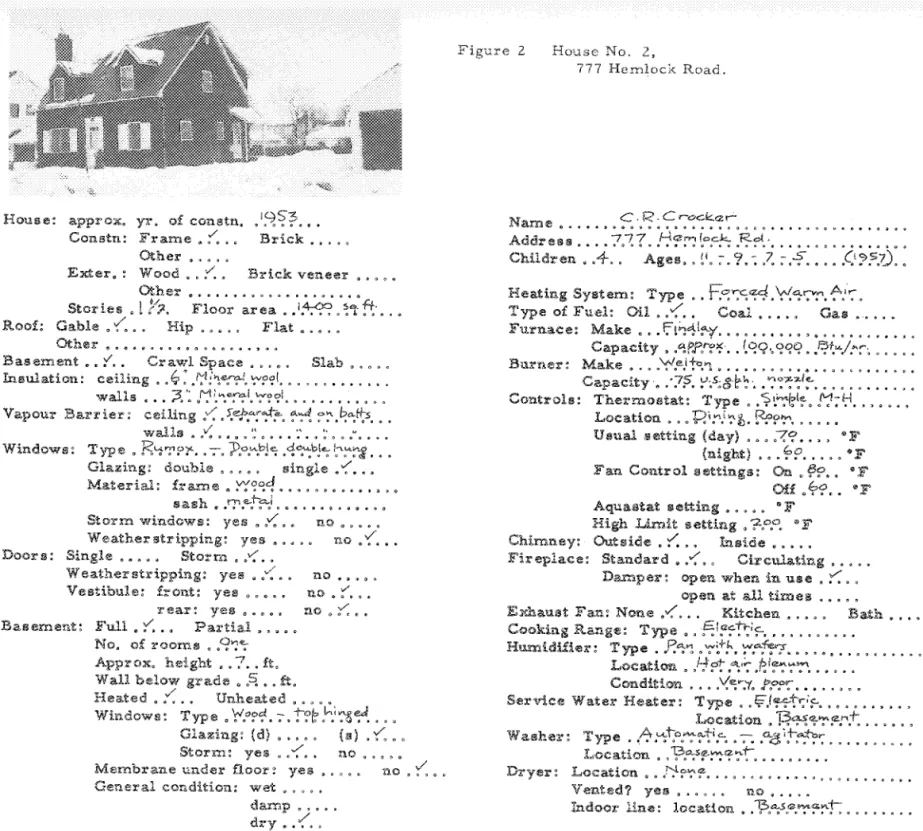
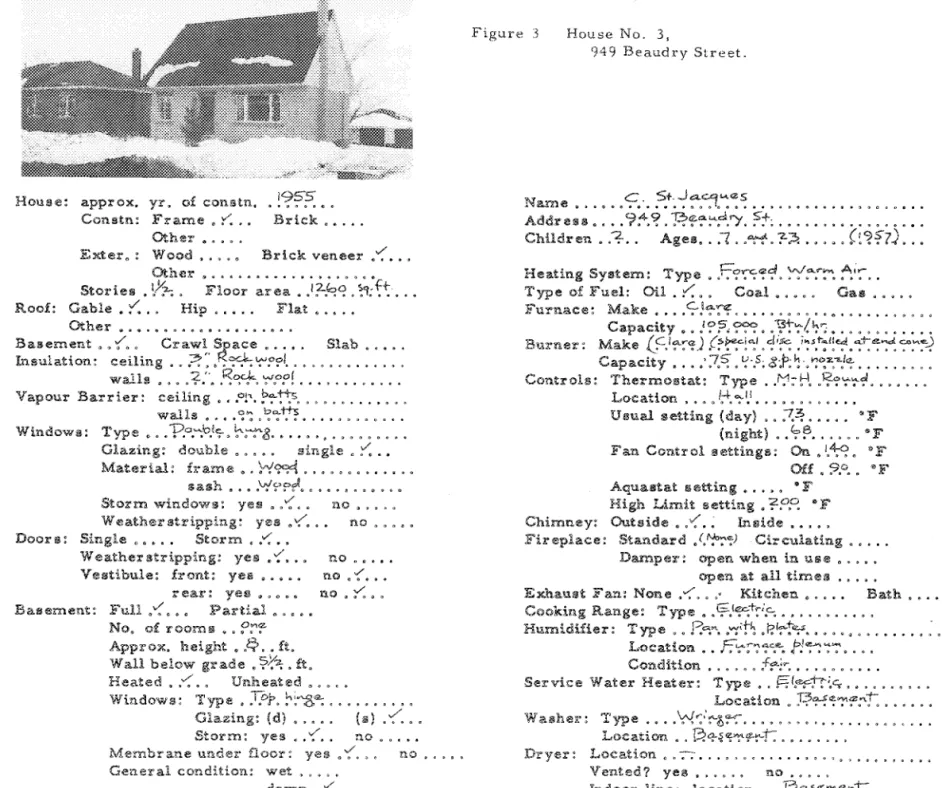
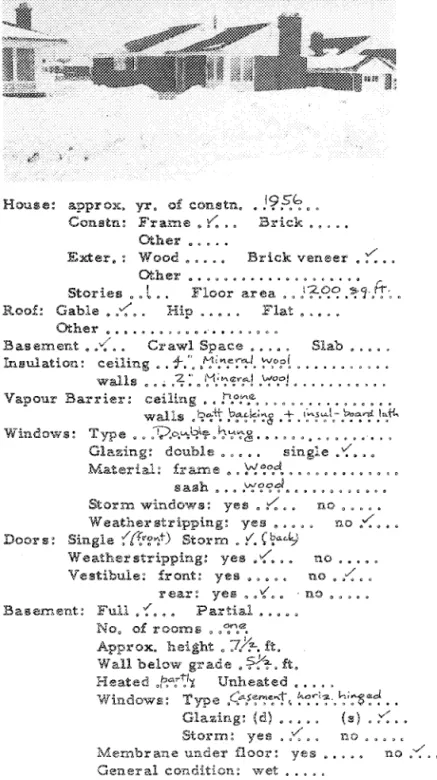
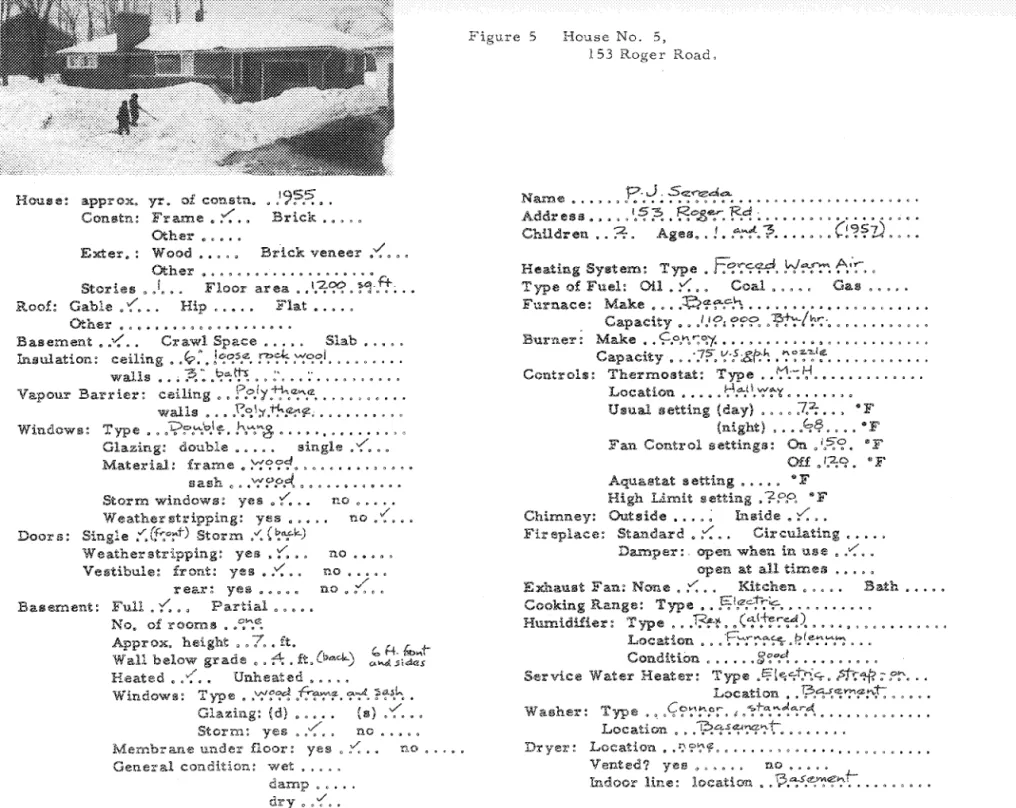
is given in Table 1. Photographs and details of the construction,
heating system and other factors that affect temperature or relative
humidity are contained in Figures 1 to 13. Ten of the houses were
equipped with warm-air heating systems, nine of which were forced
warm air; most had pan-type humidifiers in the furnace plenum,
some of which were in poor condition. Of the three houses with
hot-water heating systems, two had radiant panel systems and no
humidifier; the third had a gravity hot-water system using radiators
and a cabinet -type humidifier in the upstair shall.
INSTRUMENT ATION AND RECORDS
Continuous records of inside dry-bulb temperature and
relative humidity were obtained for the living -dining area of each
house. An effort was made to standardize on the location of the
instruments away from cold walls, windows, warm-air registers,
radios, and television sets, and to fix the height of the measuring
station above the floor for better comparison of conditions in various
house s . This was accomplished to a large degree although the height
of instrument varied between 4 and 5 ft above floor level. The
instrument used in each house was a
hyg
r-othe r mog r aph (Figure 14),
using strands of hair for the humidity-sensing element and a
bi-metallic coil for temperature. The clock-wound cylinder used a
7 -day chart with 0 to 100 per cent relative humidity scale and _40
0to 110
0F temperature scale. The week was considered to begin
and end at 12:00 noon on Tuesday, all charts being renewed within
3 hr of this time each week. Calibration of the hygrothermographs
was carried out every two weeks using a battery-operated motorized
psychrometer.
MセMMMセMMMMM
3
-Readings of outside temperature, relative humidity and
degree days were obtained from records for Ottawa, of the
Meteorological Division, Department of Transport. The thirteen
houses under observation were within seven miles of the
meteoro-logical station and generally in the eastern part of the city.
The humidity ratio, or absolute humidity, was calculated
from the dry-bulb temperature and relative humidity values both
for inside and outside air, so that the absolute moisture content of
the inside atmospheres could be compared directly with one another
and with the moisture content of the outside air. Daily average
humidity ratios were obtained from the daily average dry-bulb
temperatures and relative humidites by means of a psychrometric
chart. Weekly and monthly averages were computed from the daily
averages.
RESULTS
The weather records for the survey period of October 1957
to September 1959, inclusive, and also for an additional period
through to June 1960 for comparison of seasonal climate are shown
in Figure 15. This contains the average weekly value s of degree
days, outside air temperature and relative humidity, and the
corre-sponding average weekly outside humidity ratios in grains of moisture
per pound of dry air, based on daily averages.
Figures 16 to 28 give for houses 1 to 13, respectively, the
average weekly readings of inside air temperature, relative humidity
and humidity ratio, with an added plot of average weekly
inside-outside air temperature difference. The dotted curve s on each of
these figures are plots of the weekly average inside air temperature
and humidity ratio for all 13 houses. Figure 29 shows these same
plots of average inside conditions along with the corre sponding
out-door weekly averages of air temperature and humidity ratio.
In Figure 30 are the same data as in Figure 29(a), (b) and
(c), but plotted on a monthly basis rather than weekly, with the
addition of shaded areas above and below the average monthly values
to show the upper and lower limits for single -house value s .
In Figures 31 to 43 are plotted the inside vs. the outside
monthly average humidity ratios, the upper plot depicting October
1957 to September 1958, inclusive, and the lower plot October 1958
to September 1959. These show the relationship, month by month,
between the moisture contents of the inside and outside atmosphere s
4
-of each house. The dotted line on each plot is the line -of equal
value s for inside and outside and is drawn in for reference.
Tables
II,
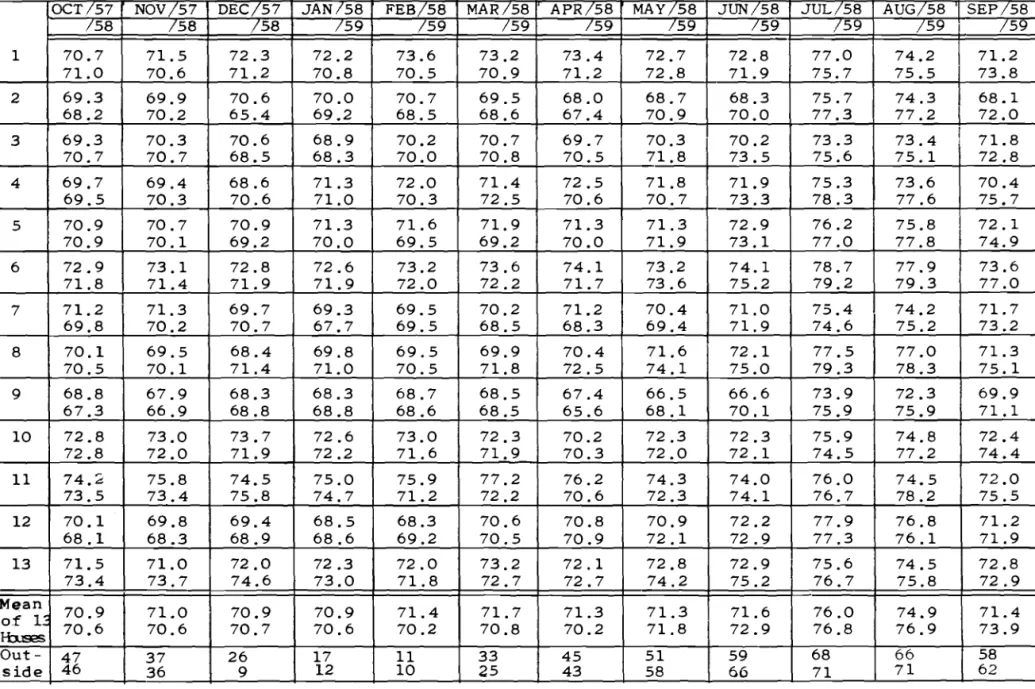
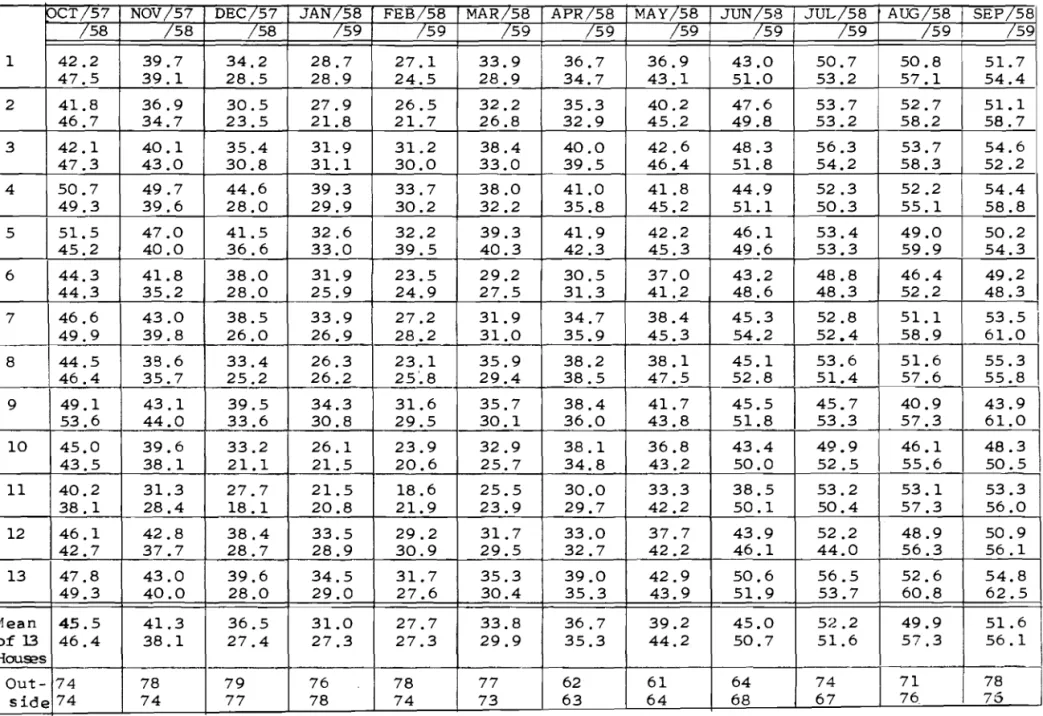
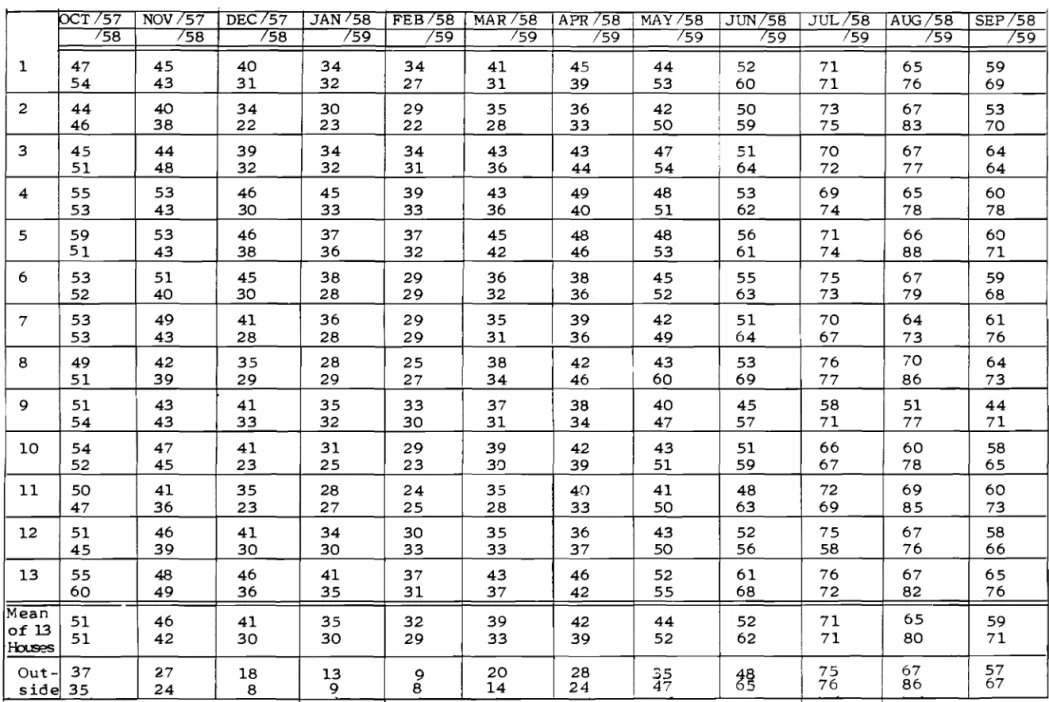
III and IV give the :monthly average values
of inside te:mperature, relative hu:midity and hu:midity ratio,
re spectively, for each of the houses for both twelve -:month periods,
1957 - 58 and 1958 - 59. As well a s the individual house value s , the
tables include average values for all 13 houses and the corresponding
average :monthly outside values based on daily weather readings. The
figures in the tables were used to prepare Figures 30 to 43.
DISCUSSION OF RESULTS
(a)
Outdoor C1i:mate
The outdoor te:mperature records, week by week for the
three winters as shown by Figure 15 (a), (b) and (c) and again in
Figure 29 (a),?(b) and (c), reveal :marked differences in the
te:mper-ature pattern for the three consecutive winters. Whereas the winter
1957 - 58 showed two thaw periods in late Dece:mber and late January
with a relatively :mild March, 1958 - 59 was considerably colder with
no winter thaw periods and a relatively cold March, while 1959 -60
was reasonably :mild all winter except for a cold spell in the second
week of January.
It is intere sting that even though the three winter
patterns are quite different, each shows a week in which the average
te:mperature dipped to about 2
0F, although the se dips occurred each
year in a different :month.
The corresponding hu:midity ratios at the
ti:me of the se dips showed, in each case, an average of five or six
grains per pound of dry air for the cold week.
The two su:m:mer periods shown in these outdoor te:mperature
and hu:midity ratio curves are also very interesting. The first was a
relatively cool dry su:m:mer with :maxi:mu:m weekly average te mpe r atu r e
of 71 ° F and a hu:midity ratio of only 86 grains, whereas the second
showed :most of July and August with a weekly average te:mperature
between 70° and 74° F and weekly average hu:midity ratios as high as
101 grains. The 1958 record shows a gradual drop in both
te:mpera-ture and hu:midity ratio following the July peak, while the hot :moist
weather of the su:m:mer of 1959 continued well on into August and even
Septe:mber, followed by a pheno:menal plunge in :mid-Septe:mber.
(b)
Indoor Cli:mate
5
-into weekly average s for individual house s (Figure s 16 to 28) and
for all 13 house s (Figure 29) and again into monthly average s for
all 13 houses (Figure 30). From these records, it is evident that
there was considerable variation in the indoor atmosphere sand
that although the records of some houses were similar to others in
some respects, each appeared to have differences over the
two-year period.
House No.1 (Figure 16) showed temperatures and humidity
ratios that followed the 13 house averages very closely, both winter
and summer, except that the inside temperature was consistently 1
or 2 deg higher during the winter of 1957-58 and the spring of 1958.
Of interest is the lowest weekly average humidity ratio of 23 grains,
which occurred not during the coldest week of the winter in December
but during the third week in February, which was the end of the severe
part of the winter.
House No.2 (Figure 17) showed temperatures and humidities
to be lower than the 13-house average during heating seasons. During
December 1958 the occupants went on a three -week winter vacation,
and the thermostat setting was reduced approximately ten deg. This
period when no moisture from occupancy was being supplied to the
atmosphere had an obvious effect upon the humidity ratio of the air
during the vacation period and the subsequent winter weeks.
House No.3 (Figure 18) was close to the 13-house average
in its weekly average readings of temperature and humidity, except
that during the colde st winter periods the temperature appeared to
drop 2 or 3 deg below the general average. Summertime temperatures
were also lower in this house than the average of all 13 houses.
House No. 4 (Figure 19) appeared to give erratic temperature
readings during the first winter of the survey, and the humidity ratio
during this period was considerably above average. The second winter
saw a more even average temperature with both temperature and
humidity ratio being very close to the 13-house average. Summer
records were, in the main, close to the average for all houses.
House No. 5 (Figure 20) gave substantially higher humidity
ratios in the winter months than most of the other houses, whereas
the temperatures were very steady week by week and about average.
The higher humidity ratio was attributed to a special nozzle -type spray
humidifier operated by a solenoid valve in parallel with the warm-air
furnace blowe r ,
6
-House No.6 (Figure 21) showed te mpe r atu r e s f r orn 1 to
3 deg above the l3-house average during the winter and 2 to 4 deg
above average during the sumrne r .
Hurrrid
ity ratios were within a
few grains of the average for all 13 house s throughout both winter
and SUInIne
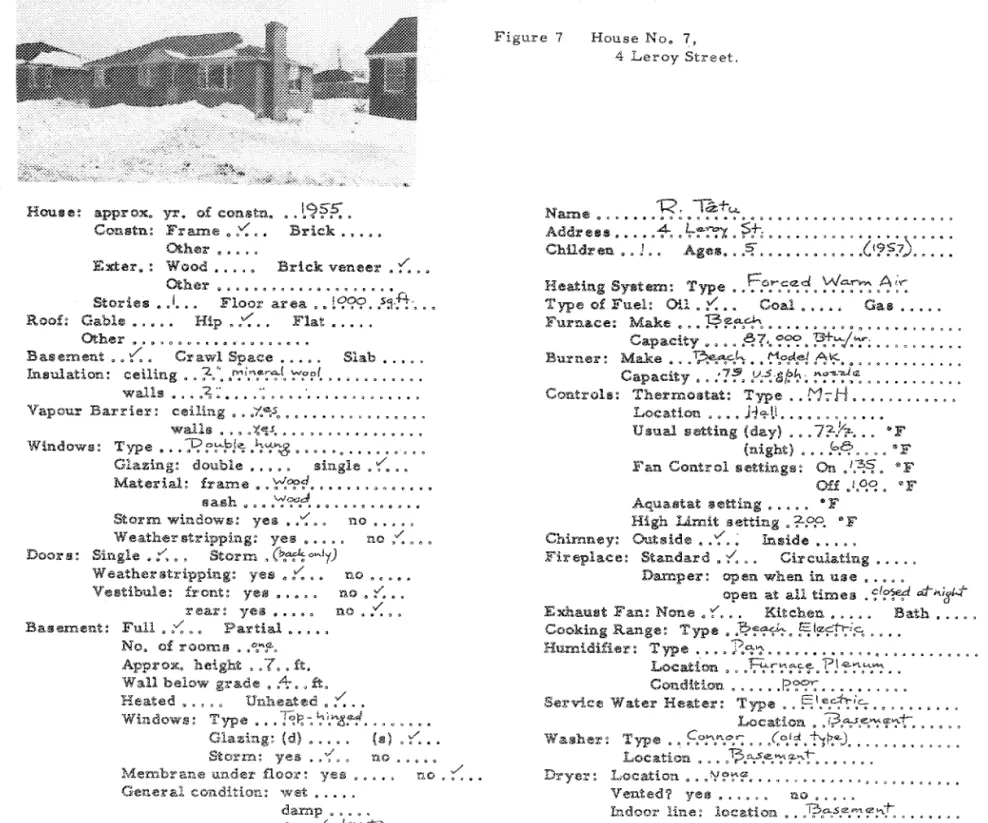
l' •House No. 7 (Figure 22) was about average in te rnpe r atu r e
and hu rriid
ity , except for s orne what lower te rnpe r atu r e s than the
average in the January to May periods. In both winters the occupants
took a weeki s vacation during the Chr i s trna s -New Ye a r ' s period, and
the
the r rno s tat was set down about 5 deg on the se occasions.
House No.8 (Figure 23) weekly average
te rnpe r atu r e s were
slightly below the l3-house average during the winter 1957 - 58, about
the s arrie as this average during the winter of 1958-59, and consistently
2 or 3 deg above the average during the hottest parts of both surnrne r s
of 1958 and 1959. The weekly average hurni d
it y ratios followed the
s a rne pattern relative to the 13 -house average. A two weeks vacation
in No ve rnbe r - De ce mbe r 1957 with a
the r rno st.at set-back of about six
deg accounted for the drop in both
te mpe r atu r e and hurnidi ty ratio
during this period.
House No. 9 (Figure 24) was rna'int a irie d at a lower average
t
e rnpe r atu r e than rrio s
tof the houses in the survey because of a
preference for lower rOOIn air te rnpe r atu r e s for c o rnf o r
tin the winter.
Hurrrid'ity ratios were close to the l3-house average except for the
sumrne r of 1958, when hurrridi.ty ratios apparently fell well below
average. During this period there was SOIne trouble with the hurnid
ity
i.n
s
tr urrie nt going off calibration, and SOIne of the apparent drop in
hurnid
ity ratio is thought to be attributable to in st ru rnent error. There
were periods, however, during which the house was unoccupied for a
week or so at a
tirne , which would also account for the below-average
values.
'I'e rnpe r a.tu r e s in house No. 10 (Figure 25) were generally
steady week by week and were slightly above the l3-house average.
Hurrrid it
y ratios followed the average except during the colde st weather
when the weekly hurni.dity ratio fell below the average.
House No. 11 (Figure 26) showed wirrte r
ti
me air
te mpe r atu r e s
for the rrio s
tpart rnu c h higher than the l3-house average, although
su rnrne r
ti
rne te mpe r a tu r e s were about average. The rnoi stu r e content
7
-than most houses during the winter mainly because of the rather
high infiltration rate through the large loose -fitting windows.
Thus, the combination of high temperatures and low moisture
content resulted in very low relative humidity readings in this
house for the coldest parts of the winter.
Temperature s in house No. 12 (Figure 27) were from 1 to
4 deg below the l3-house average for the winter months of both
1957-58 and 1958-59, and the wintertime humidity ratios were about
average. In the summer of 1958 both temperature and humidity were
somewhat above the average but, in the following summer, the se
were for the most part below average.
House No. 13 (Figure 28) had consistently higher than
average temperatures and humidity ratios during the winter, with
the summer readings about average in both cases.
General observations throughout the winter showed that
most occupants were satisfied with the humidity conditions that
existed in their own home s with the exception of House No. 11, where
noticeable dryness prevailed in the severe winter weather. No
occupants complained of condensation problems even though some
houses registered a weekly average relative humidity as high as 30
per cent in the severe weather.
(c)
Indoor vs. Outdoor Climate
In Figures 29 (a), (b) and (c) are shown the average weekly
inside and outside air temperature s and humidity ratios, the inside
values being the mean of all thirteen houses. The same information
is plotted in Figure 30 on a monthly basis, the shaded areas above
and below the inside air curve s indicating the spread of individual
house values from the mean value of all the houses.
It is apparent that, in the summer months of July and August,
the average weekly inside air temperature was from 5 to 8 deg higher
than the average weekly outside air temperature. At the same time,
however, the corresponding inside humidity ratio based on all 13
houses was lower than outside for this summer period in both years
and was slightly lower as early as the month of June in 1959. As
none of the house s had air conditioning installations, the reduction in
average inside humidity ratio below that of the outside can only be
8
-explained by the absorption of rnoi stu r e by the wood, paper, fabrics
and other hygroscopic materials in the house.
A closer study of the relationship between inside humidity
ratio and outside humidity ratio in the individual houses can be
obtained from Figures 31 to 43, where the monthly averages are
plotted and the points joined in chronological order for the periods
October 1957 to September 1958 (upper diagram) and October 1958
to September 1959 (lower diagram). There is some similarity
between the patterns for different house s in that the general shape
of the double line forming the yearly loop is inclined to the dotted
line of equal humidity ratio at a sharp angle and, in most cases, the
points for July and August fall beyond the dotted line.
For any individual house, the angle that the loop makes with
the dotted line is more or less the same for both years, although the
position of the loop on the grid and the location of specific monthly
averages are quite different from year to year due to differences in
weather. The year 1958-59 had a considerably more severe winter
than the previous year so humidity ratios at the lower left of the
loop are lower on the lower diagram. Similarly, the summer of 1959
was considerably hotter and more humid than that of 1958 so the
upper-right extremity of the loop is further toward the upper -upper-right portion of
the grid. The interchange of the position of July and August for the two
years is interesting, as are the radically different positions of December,
May and June.
In comparing the humidity ratio curve s of one house with another,
one would expect those houses with efficient humidifiers and those occupied
by larger families to show higher humidities throughout the year. In
general, this trend is apparent but not always true. It is thought that the
ventilation rate, which is well known to be dependent upon people's living
habits as well as the looseness of fit of windows and doors, has a major
effect upon humiditie s during the winter months. The effect, however,
on summer humidity ratios of such operations as closing the house from
early morning to early evening on hot humid days is less well known.
The hourly weather records show that on such days the outside humidity
ratio is generally between 100 and 120 grains per pound of dry air in the
Ottawa area, with the peak occurring usually between 8:00 a. m. and
12: 00 noon. Air temperature s usually lie between the high 60' s and low
70' s about 6: 00 a. m. and between the high 80' s and low 90' s at about
9
-little heat and moisture as pos sible by cooking and other household
operations, it should be pos s ib l e to lower the daily average humidity
ratio and temperature below what they would normally be with
day-long ventilation with outside air. If the house is not shaded from
solar radiation, however, the heat intensity will be such as to require
relief by ventilation throughout at least the afternoon, if not the whole
day, especially if the house construction has little thermal storage in
the attic or roof space.
From the weather records plotted in Figure 15 (a), (b) and
(c), it is apparent that the weekly average outside relative humidity
generally remained within a fairly narrow band from about 60 to 85
per cent R. H. all year round, except for occasional periods such as
the spring of 1959.
Thus, the humidity ratio plot has a form similar
to that of the temperature plot. It follows therefore that there will be
a relationship between inside humidity ratio and outside air
temper-ature which will take somewhat the form of the plots of Figures 31 to
43. This is shown in Figure 44, where average weekly values of
inside humidity ratio for all 13 house s have been plotted against the
average weekly outside air temperature. For both 1957 - 58 and
1958-59, it is evident that there is a definite trend towards a hysteresis
loop, the upper part of the curve in each case representing the
summer to winter value s as the moisture -laden materials in the
houses were gradually drying, and the lower part representing the
winter to summer value s as the dried materials were gradually
absorbing moisture.
A composite curve is depicted in Figure 45 as a shaded
band based on the two years for which figures are available. Additional
years might require that the band be enlarged somewhat, particularly
at the "summer" end of the diagram. In Figure 45 are shown also the
curves established by Phillips (1) in a survey by the National Bureau
of Standards for a group of 142 humidified houses (heavy line), and
73 unhumidified house s (dotted line). Also included in the figure are
the results of the Housing and Home Finance Agency survey (2)
conducted for nine house s in Minneapolis, Minn. In replotting the se
curves for direct comparison with the average values for the Ottawa
houses, the units of the authors, relative humidity at 70° F, have
been converted to humidity ratio. The curves of Phillips were derived
from spot readings of wet- and dry-bulb temperatures, both inside
and outdoors, taken with a sling psychrometer twice daily in the
morning and afternoon, and therefore cannot be construed to repre sent
the average values over a 24-hr period. On the whole, however, they
may not differ widely from the true daily averages as both the inside
10
-and outside temperatures could be expected to be lower using 24hr
average values rather than the spot readings of morning and afternoon.
Unfortunately, the Housing and Home Finance Agency does not give a
complete record of the relative humidity at 70° F versus outside
temperature for the nine houses in State College, Pa. which were
also studied. From the single value given in Table IV of the paper (2),
it would appear that the State College values of relative humidity
might be somewhat lower than those of the Minneapolis houses for
the same outside air temperature, which would bring them closely
into line with the results of the Ottawa house survey.
CONCLUSIONS
(a)
Based on the three consecutive winters of weather observations,
Ottawa winter temperature can be expected to fall to a weekly
average of about 2 ° F for at least one week of the winter, with
a corre sponding outside air humidity ratio of about 5 grains of
moisture per pound of dry air.
(b)
Based on the records of two consecutive summers, Ottawa
summer temperature and humidity ratio maxima can vary
considerably from year to year, the maximum average weekly
outside temperature probably lying between 72° and 77° F for
most summer s, with a corre sponding maximum average
weekly outside humidity ratio of between 85 and 105 grains of
moisture per pound of dry air.
(c)
The outside air weekly average temperature and humidity
ratio for any particular week of one year may be markedly
different from the values for the corresponding week of another
year, e. g., the week of 1724 December 1957 showed an
average of 34° F while that of 1623 December 1958 was 3° F.
Even on a monthly basis these figures vary widely from one
year to the next.
(d)
With inside air temperature maintained in the low 70' s in an
Ottawa house equipped with a warmair heating system, the
weekly average relative humidity is likely to fall to about 20
to 25 per cent in the most severe winter weather, with a
corre sponding humidity ratio of about 22 to 30 grains of
moisture per pound of dry air. The use of a pantype
humidi-fier in the furnace plenum did little to raise the humidity
ratio in the house s under observation.
11
--
(e)
Summer air temperatures inside the houses will be as a
rule 5 to 8 F deg higher than outside, based on weekly
values at the peak of the summer heat. Summer relative
humidities inside will likely be from 50 to 70 per cent
during this peak period, corre sponding to a humidity ratio
of about 75 to 95 grains of moisture per pound of dry air,
or slightly lower than the peak outside air values.
(f)
The weekly average inside air humidity ratio varies directly
with the corresponding outside air temperature, but the values
for the period from midsummer to midwinter are higher than
those for the period from midwinter to midsummer at the
same average outside temperature. This hystere sis effect
is probably due to the storage and subsequent re evaporation
of moisture by the hygroscopic materials of the house
construction and furnishings.
ACKNOWLEDGEMENTS
The author is indebted to Mr. A. G. Wilson, Head of the
Building Service s Section, for advice and as sistance in the planning
of this part of the project, and to Mr. L. P. Chabot for the work
involved in the weekly servicing of instruments and the processing
of records, in which he was assisted by Mr. G. Monast.
REFERENCES
1.
Phillips, Thomas D. A Survey of Humidities in Residences.
Building Materials and Structures Report BMS 56, National
Bureau of Standards, Washington, October 1940.
2.
Humidity Conditions in Modern Houses. Housing Research
No.6, published by the Housing and Horne Finance Agency,
Washington, October 1953.
3.
Robson, D. R. Temperature and Humidity in Houses, Halifax
196061. National Research Council, Division of Building
Research, DBR Internal Report No. 261, March 1963.
TABLE
IOTTAWA HOUSES UNDER
observaセHouse Occupant
Approx.
Storeys
Under Floor
Construction
Heating System Approximate Floor
No.
Year Of
Const'n
(basement or
slab)
Area (not including
basement)
1
H .L.Hall
1948
1 1/2
basement
wood shingles
forced warm air
1040 sq ft
on wood frame
2
C.R.Crocker 1953
1 1/2
basement
"
forced warm air
1400 sq
ft
3
C.StJacques
19551 1/2
ba s ezrientbrick veneer
forced warm air
1260 sq ft
on wood frame
4
A.G.Wilson
1956
1
basement
"
forced warm air
1200 sq ft
5
P.J.Sereda
1955
1
basement
"
forced warm air
1200 sq
ft
6
W.H.Ball
1953
1
basement
wood shingles
forced warm air
1200 sq
fton wood frame
7
R.Tetu
1955
1
basement
brick veneer
for ced warm air
1000 sq
ft
on wood frame
8
D.G.Stephenson
1
basement
I 'forced warm air
1000 sq
ft
1955
9
R.F.Legget
1947
2
basement
"
forced warm air
1790 sq
ft
10
E.V.Gibbons 1925
2 1/2
basement
brick veneer
gravity warm
1820 sq
ft
**
stucco on wood
air *
frame
11
J.E.Hanna
1903
2 1/2
basement
solid brick
hot water
2860 sq
ft
(radiator
51
12
W. R. Schriever
19521
slab on
wood siding on
hot water
1370 sq
ft
**
ground
wood frame
(panel)
13
A.D.Kent
1951
1
"
"
"
1870 sq
ft
* Forced Warm Air after Sept. 1959
TABLE II
OTTAWA HOUSES
MEAN MONTHLY TEMPERATURE (Living Room)
In
ofOCT/57
/58
NOV/57
/58
DEC/57
/58
JAN/58
/59
FEB/58
/59
MAR/58
/59
APR/58
/59
MAY/58
/59
JUN/58
/59
JUL/58
/59
AUG/58
/59
SEP/58
/59
1
70.7
71.0
71.5
70.6
72.3
71.2
72.2
70.8
73.6
70.5
73.2
70.9
73.4
71.2
72.7
72.8
72.8
71.9
77.0
75.7
74.2
75.5
71.2
73.8
2
69.3
68.2
69.9
70.2
70.6
65.4
70.0
69.2
70.7
68.5
69.5
68.6
68.0
67.4
68.7
70.9
68.3
70.0
75.7
77.3
74.3
77.2
68.1
72.0
3
69.3
70.7
70.3
70.7
70.6
68.5
68.9
68.3
70.2
70.0
70.7
70.8
69.7
70.5
70.3
71.8
70.2
73.5
73.3
75.6
73.4
75.1
71.8
72.8
4
69.7
69.5
69.4
70.3
68.6
70.6
71.3
71.0
72.0
70.3
71.4
72.5
72.5
70.6
71.8
70.7
71.9
73.3
75.3
78.3
73.6
77.6
70.4
75.7
5
70.9
70.9
70.7
70.1
70.9
69.2
71.3
70.0
71.6
69.5
71.9
69.2
71.3
70.0
71.3
71.9
72.9
73.1
76.2
77.0
75.8
77.8
I
72.1
74.9
6
72.9
71.8
73.1
71.4
72.8
71.9
72.6
71.9
73.2
72.0
73.6
72.2
74.1
71.7
73.2
73.6
74.1
75.2
78.7
79.2
77.9
79.3
73.6
77.0
7
71.2
69.8
71.3
70.2
69.7
70.7
69.3
67.7
69.5
69.5
70.2
68.5
71.2
68.3
70.4
69.4
71.0
71.9
75.4
74.6
74.2
75.2
71.7
73.2
8
70.1
70.5
69.5
70.1
68.4
71.4
69.8
71.0
69.5
70.5
69.9
71.8
70.4
72.5
71.6
74.1
72 .1
75.0
77.5
79.3
77.0
78.3
71.3
75.1
9
68.8
67.3
67.9
66.9
68.3
68.8
68.3
68.8
68.7
68.6
68.5
68.5
67.4
65.6
66.5
68.1
66.6
70.1
73.9
75.9
72 .3
75.9
69.9
71.1
10
72.8
72.8
73.0
72.0
73.7
71.9
72.6
72.2
73.0
71.6
72.3
71.9
70.2
70.3
72.3
72.0
72.3
72.1
75.9
74.5
74.8
77.2
72 .4
74.4
1174.::::
73.5
75.8
73.4
74.5
75.8
75.0
74.7
75.9
71.2
77.2
72.2
76.2
70.6
74.3
72.3
74.0
74.1
76.0
76.7
74.5
78.2
72.0
75.5
12
70.1
68.1
69.8
68.3
69.4
68.9
68.5
68.6
68.3
69.2
70.6
70.5
70.8
70.9
70.9
72.1
72.2
72 .9
77.9
77.3
76.8
76.1
71.2
71.9
13
71.5
73.4
71.0
73.7
72 .0
74.6
72 .3
73.0
72.0
71.8
73.2
72.7
72.1
72.7
72.8
74.2
72.9
75.2
I
75.6
76.7
74.5
75.8
72.8
72.9
Mean
of 1
I-b..:sesOut-side
70.9
70.6
47
46
71.0
70.6
37
36
70.9
70.7
26
9
70.9
70.6
17
12
71.4
70.2
1110
71.7
70.8
33
25
71.3
70.2
45
43
71.3
71.8
51
58
71.6
72.9
59
66
76.0
76.8
68
71
74.9
76.9
66
71
71.4
73.9
58
62
TABLE III
MEAN MONTHLY RELATIVE HUMIDITY (Living Room)
OTTAWA HOUSES
In Per Cent
9CT/57 NOV/57
DEC/57
JAN/58
FEB/58 MAR/58
APR/58
MAY/58
JUN/58
JUL/58
AUG/58
SEP/58
1
/58
/58
/58
/59
/59
/59
/59
/59
/59
/59
/59
/59
42.2
39.7
34.2
28.7
27.1
33.9
36.7
36.9
43.0
50.7
50.8
51.7
47.5
39.1
28.5
28.9
24.5
28.9
34.7
43.1
51.0
53.2
57.1
54.4
2
41.8
36.9
30.5
27.9
26.5
32.2
35.3
40.2
47.6
53.7
52.7
51.1
46.7
34.7
23.5
21.8
21.7
26.8
32.9
45.2
49.8
53.2
58.2
58.7
3
42.1
40.1
35.4
31.9
31.2
38.4
40.0
42.6
48.3
56.3
53.7
54.6
47.3
43.0
30.8
31.1
30.0
33.0
39.5
46.4
51.8
54.2
58.3
52.2
4
50.7
49.7
44.6
39.3
33.7
38.0
41.0
41.8
44.9
52.3
52.2
54.4
49.3
39.6
28.0
29.9
30.2
32.2
35.8
45.2
51.1
50.3
55.1
58.8
5
51.5
47.0
41.5
32.6
32.2
39.3
41.9
42.2
46.1
53.4
49.0
50.2
45.2
40.0
36.6
33.0
39.5
40.3
42.3
45.3
49.6
53.3
59.9
54.3
6
44.3
41.8
38.0
31.9
23.5
29.2
30.5
37.0
43.2
48.8
46.4
49.2
44.3
35.2
28.0
25.9
24.9
27.5
31.3
41.2
48.6
48.3
52.2
48.3
7
46.6
43.0
38.5
33.9
27.2
31.9
34.7
38.4
45.3
52.8
51.1
53.5
I
49.9
39.8
26.0
26.9
28.2
31.0
35.9
45.3
54.2
52.4
58.9
61.0
8
44.5
39.6
33.4
26.3
23.1
35.9
38.2
38.1
45.1
53.6
51.6
55.3
46.4
35.7
25.2
26.2
25'.8
29.4
38.5
47.5
52.8
51.4
57.6
55.8
9
49.1
43.1
39.5
34.3
31.6
35.7
38.4
41. 7
45.5
45.7
40.9
43.9
53.6
44.0
33.6
30.8
29.5
30.1
36.0
43.8
51.8
53.3
57.3
61.0
10
45.0
39.6
33.2
26.1
23.9
32.9
38.1
36.8
43.4
49.9
46.1
48.3
43.5
38.1
21.1
21.5
20.6
25.7
34.8
43.2
50.0
52.5
55.6
50.5
11
40.2
31.3
27.7
21.5
18.6
25.5
30.0
33.3
38.5
53.2
53.1
53.3
38.1
28.4
18.1
20.8
21.9
23.9
29.7
42.2
50.1
50.4
57.3
56.0
12
46.1
42.8
38.4
33.5
29.2
31.7
33.0
37.7
43.9
52.2
48.9
50.9
42.7
37.7
28.7
28.9
30.9
29.5
32.7
42.2
46.1
44.0
56.3
56.1
13
47.8
43.0
39.6
34.5
31.7
35.3
39.0
42.9
50.6
56.5
52.6
54.8
49.3
40.0
28.0
29.0
27.6
30.4
35.3
43.9
51.9
53.7
60.8
62.5
"lean
45.5
41.3
36.5
31.0
27.7
33.8
36.7
39.2
45.0
52.2
49.9
51.6
of 1346.4
38.1
27.4
27.3
27.3
29.9
35.3
44.2
50.7
51.6
57.3
56.1
MousesOut- 74
78
79
76
78
77
62
61
64
74
71
78
side 74
74
77
78
74
73
63
64
68
67
76
76
TABLE IV
MEAN MONTHLY HUMIDITY RATIO (Living Room)
OTTA WA HOUSES
In Grains Per lb
of Dry Air
1
OCT/57
NOV /57
DEC/57
JAN /58
FEB/58 MAR/58
APR/58
MAY/58
JUN/58
JUL/58 AUG/58
SEP/58
/58
/58
/58
/59
/59
/59
/59
/59
/59
/59
/59
/59
47
45
40
34
34
41
45
44
52
71
65
59
54
43
31
32
27
31
39
53
60
71
76
69
2
44
4034
30
29
35
36
42
50
73
67
53
46
38
22
23
22
28
33
50
59
75
83
70
3
45
44
39
34
34
43
43
47
51
70
67
64
51
48
32
32
31
36
44
54
64
72
77
64
4
55
53
46
45
39
43
49
48
53
69
65
60
53
43
30
33
33
36
40
51
62
74
78
78
5
59
53
46
37
37
45
4848
56
71
66
60
51
43
38
36
32
42
46
53
61
74
88
71
6
53
51
45
38
29
36
38
45
55
75
67
59
52
40
30
28
29
32
36
52
63
73
79
68
7
53
49
41
36
29
35
39
42
51
70
64
61
53
43
28
28
29
31
36
49
64
67
73
76
8
49
42
35
28
25
38
42
43
53
76
70
64
51
39
29
29
27
34
46
60
69
77
86
73
9
51
43
41
35
33
37
38
40
45
58
51
44
54
43
33
32
30
31
34
47
57
71
77
71
10
54
47
41
31
29
39
42
43
51
66
60
58
52
45
23
25
23
30
39
51
59
67
78
65
11
50
41
35
28
24
35
40
41
48
7269
60
47
36
23
27
25
28
33
50
63
69
85
73
12
51
46
41
34
30
35
36
43
52
75
67
58
45
39
30
30
33
33
37
50
56
58
76
66
13
55
4846
41
37
43
46
52
61
76
67
65
60
49
36
35
31
37
42
55
68
72
82
76
Mean
of 13
Ibt.1'es51
51
46
42
41
30
35
30
32
29
39
33
42
39
44
52
52
62
71
71
65
80
59
71
Out-side
37
35
27
24
18
8
13
9
8
9
20
14
24
28
35
47
セセ
76
75
67
86
57
67
• • • • • • •
•
ANセT[ゥ_,.
Brick •• , 0 ' hッオセセZ appr ox, yr. of conatn,
Conet'll: Fl'<lXlH'I:. ::. ,
Other •o , , ,
Extel'.: Wood.,
'f': .
B:&'ick veneerOther • セLL[アTGZ LDィ[セiセセL •••••
StorielJ NャIZGセL Floor area.
P?'!r9.
,sfl·,47; ••
oRoof: Gable ••
V:..
Hip •.• , , Flat. , e e eOther 0 C e セセゥヲセセ セqqセセ ..セセNQ
. ""
cBal>ement •
:< ..
C:rawl sー。」セ • , . • . Slab. , .. ,lruilUlation:ceiling .2.". セセB[G\[・^Q ••••• , • 0 , • • • • • • • •
walls •
3:
rセセNBGZGセッjN.. , . ,
e , , • • • • • , ,Vapour Barrie:r: ceiling,
.<..
セB[pGBL[ e:-{<;-." ...•. "
walllil , , •-: •• LsセA_MZGZBBB[ゥZ・N •••o • , , , • •
Windows: Type" NセL[ZMAZ_i[・ML ZMGLGBG[セッ , •• , . ' . ' , , e e " ••
Glazing: double",.. single. セ ••
m。エセャGゥ。ャZ
frcune.
:,=,,:e:'4 • •••
e• ,sash セ (l .. 1& wood セ " セ ... Q ") !l . . . . 0 " . . . " l>
Storm windowj;j: yelJ. ::, • no. , , , ,
Weathe:ntrippl.ng; yes •.. ,. no
.v:...
Doors: Single... Storm .•:.•
Weathe:rstripping: yes. (. . , no, •.• ,
Vestibule: front: yu... no •.
V: •,
rear: yes... no • •
v:.,
Basement: Full.!... Partial •••••
No. of r oorn s o
,o.":!.
Appr ox, h.eight e •
7.•
ft.Wall below grade •.
5f •.
ft,Heated •
,v: ,,
Unheated •.•..Windows: Type, NBGA・Zセ・エ
•. ff'1?
LィZセセL,.. ,
Gladng: (0) •. , . , (6).0(. , •
Storm: yes .•
V::..
no .. , ••Membrane und ez floor ; yes •.. " no
Nセ
.•.General condition: wet •... , damp . , , , .
dry •.
v:, .
Figure 1 House No.1,
26 Kilbarry Crescent.
Name H. L ·H"""I\
a、、イ・セセZZ
:
セセZ
kGAセ[セセWZ
ZセセBGセセヲZ
:: ::: :: :: :::: :
Children •• 7. , AgelJ, ..::, . , •. , •. , •••. , . , • , ••••Heating Syshm: Type. fZPNGZgセL LGカヲセセGWGN セ[BZN 0 ,
Type of Fuel: 01.1 . .
>(. .
Coal. e • • • Gas ..•..Furnace: Make., ヲゥセャZLLᆬ .. ヲGZiGエTセャNセセセL_Nッ ..•.... , .•.
_ Capacity •• LQZTrLLセセ
.•
qセゥャケBNLN , ... , , , e•Burner: Make HfZGセQMABGZケNIN
, .. , ... , , ", '., ..
0 , • , • •Capacity •.
L
セセ,
セNZM NX[ーGNセ[ ["1/':"!;
サSpZセセNGWBNiiZ^NN[ r...z-..le.Controls: Thermostat: Type, LセWAT RD,"';"'.
.::! •• ,.,
Location . jLZLZゥセZBNLZLLセiNBB[L
!'...
ゥセ.':"'...
USu.al setting (day) ••.• セLセ , •• 'OF
(night) •.. .
"".!t. . . . .,
FFan Control settings: On.
!4'?
OF00 NセYB OF
Aqu!il.stat !!letting • , e • • 0 F
High Limit setting NセN OF
Chimney: Outside •.
V:..
InlBide ••.• ,Fireplace: Standa.rd •.セLN Circub,ting. , , , .
Damper: open when in use. , ,
open at all times. , ....
ExhaUilt Fan: None •.. ,. Kitchen,::, . Bath •.•..
Cooking Range: Type. セiGABBエ .... セBL[ .••. , , , .•••.
Humidifier: Type cZ_ーセNーセ , .••.••. , , ..
Location e fNv[BBNBセLーGゥセL[BLZBN , ••••
Conditi.on .. , .
9..1'
, , , .•..
Service Water HeateJ'.':Type • ァャセ\[エイ[N」NN
...• , . ,
.
Location , t[SnZBLBZGGヲセエL , .
Wuh.e:r: Type., aセエ\[BZLL[LLケ[ZML
.. , .. , , ' ... , , ... , , . , .
Location ,l=2o,s,«';V:"l"t, , •••••••.
Dryer: Location NセセsZiz[B[GGvZGエN , ••• :;.-' " , .• , •••. '"
Vented? yelil"" 0 , no, , . , .
• • • • • • •
• •
House: appr cx, yr. of con stn. •QUZセ_
..
Constnr Frame. (. . . Brick. , . , .
Other., ...
Exter.: Wood,.;/.. Brick veneer
Othe1' • • • • • • • • • • • • • • • • • • ••
Stories.
l
セ\G[ャL
Floor area ••1.4;0? •ZGQGセG
..•
Roof: Gable. {. .. Hip. . • . . Flat •.•..
Other •.•.•....••.•. , .. , , .
Basement •.
I. .
Crawl Space. . . e • Slab •... ,Insulation: ceiling ..セZ .1';'1;'>;e;-';'--I,':'":'<;I•••••••••••••
walls • . . ;3,':
t:
セ セ ,,:;1. ,,;?.:;I. • • • • • • • • • • • Vapour Barrier: ceiling.< LsZ・A^NBLM[セᆱMN セセ [LZLNセLL[h[Mウ. • .
walls ..V;: •••• ': •••• :' •• セ.•• ,"•• , • Windows: Type. K'1,:,pt<•• ;. M[pNッ[LBLMN「ィMaセ「ス\[MiZLMZMMセ •• ,
Glazing: double... !lingle.
V:• . •
Material: frame. yG[\[セT
•.•.
0 0 • • • • •, , •sash '!I .. イ[イエセ・NL[ZMZ。NNNNゥ <>" S., " .. 0 Q Q I:J.. ,. G
Storm windows: yes 0
.<
e • no •....Weatherstripping: yes, ... , no.
V:, •.
Door s : Singl e •• . • . StOlt m e
.v: ..
Weathel'stripping: yes,.V::,. no ••.•.
Vestibule: f:::ont: yes.,... no. : ...
:rear: yes,., •. no.::":,.
Basement: Full. (. . • Pal'Hal. , , •.
No, of rooms e Oセv[BM[
Appz ox, hsight ,
.7. ,
ft,Wall below gr ade Q Nセ • • ft.
Heated • •
V: , ,
Unheated. , 0 , •Windows: Type Q
't!.,";>e:-, ;.
エ_セ,h.'
':'S<;J. , ••
Glazing: (d} Q . , . , (<I),
Y:
0 0Storm: yea, .:.. no .. 0 "
Membrane under floor: yes,. 0 no,!, • ,
General condition: wet •.... damp . . .
dry •.
< .
Figure 2 House No.2,
777 He rrrl o c k Road.
Name C.R.Crocl:::..z...'
a、、イ・セセBB
;'77'
GイMTセZGZGゥL[」ォZN°R:i.'···,···· ., ...
Children':
.4:,' .
GaセセセZ
:
セ\ セZ
9: -:
Zセ セ ZセZ
:::
ZHGセZsZWjZ
:
Heating System: Type .. e」ZMイ[c[セNyMHセLZBBZGLセNGGGZN
Type of Fuel: Oil, e ...:. • Coal •. , . , Gas, . . . .
Furnace: Make ••.
ft"4
1:,y,
e • • , • , • • • ' • • • • • • • • • • , •Capacity , LアーGーAGセセ .. tc;9·,QQ9 • •fZ_セBMOZL[[
., ...
Burner: Make \r.!e.!+':'"
Capacit'y" .
'75'
セセUZ セォィG.
ZG[[[iセG.. ,
.
e 8 .. ., .. セ .. ",0· b D '" c セ セ " ..
Contr ol e : Thermostat: Type. ZZ_セBGZGA_ャセN エZ[セ
. . ,
.
Location, 0 e ZrゥZLLゥLZLセN f:?f'?',"\ , ••••
Usual setting (day) , •••
"?'? .. ,
QF(night) e • • セセ • • , • • 0 F
Fan Control settings: On,
?9..
OFOff Nセセ .. OF
Aquaatat setting •. , o . • F
High Limit setting.
?-p,o.
@FChimney: Outside, セ . , L"l.I'.li.de. , • , .
Fireplace: Standard, ,..;" Cil'culating . . . . ,
Damper: open when in use. :": 0 •
open at all timelll •••••
EJihauat Fan: None
.v:. ..
Kitchen, . . . . Bath •.. , .Cooking Range: Type. LセiセMZMセLZ[[ZM .•.... 0 • • • •
Humidifier: Type,
R,,:,;
LLZLLLセKAGN LZLN。セ .. • . e • • • ,Location 0
,I-;l'f't
NBL[Lセ NセゥZZLLZLL[LMGWGN •• , , ,Condition ... X€;--,'1,
rrr: . . . . ,
0 • 0Service Water Heater: Type ..セLQGZGWMエイL[ZZMM •••.••.• , • ,
Location • イNZ_セLKLLZLZLNョZエZ
...•.
0Wal1lhel': Type ..jZエNu[エZッNBLL[LMセエゥN」N
•. ::
NセiZNB[エ[^L[L.... ,., ...
Location 0 , QS[BセUZBBセセLZLLエL .• 0• • • , •
Dr yez : Location •. oT'f?":''f•••• , '.' ••••• " . , ••••••••
Vented? yell •• 0 , • • no., , , .
Indoor Hne: location •.MMイ[ZNN\^[UNQzNBGZBMセZBMエGZ