HAL Id: hal-00637547
https://hal.archives-ouvertes.fr/hal-00637547
Submitted on 15 Feb 2012
HAL is a multi-disciplinary open access archive for the deposit and dissemination of sci-entific research documents, whether they are pub-lished or not. The documents may come from teaching and research institutions in France or abroad, or from public or private research centers.
L’archive ouverte pluridisciplinaire HAL, est destinée au dépôt et à la diffusion de documents scientifiques de niveau recherche, publiés ou non, émanant des établissements d’enseignement et de recherche français ou étrangers, des laboratoires publics ou privés.
Yves Amouriq, Jean-Pierre Guédon, Nicolas Normand, Aurore Arlicot,
Yassine Ben Hdech, Pierre Weiss
To cite this version:
Yves Amouriq, Jean-Pierre Guédon, Nicolas Normand, Aurore Arlicot, Yassine Ben Hdech, et al.. Bone texture analysis on dental radiographic images: results with several angulated radiographs on the same region of interest. SPIE Medical Imaging 2011: Biomedical Applications in Molecular, Structural, and Functional Imaging, Feb 2011, Lake Buena Vista, United States. pp.796525, �10.1117/12.878152�. �hal-00637547�
Bone texture analysis on dental radiographic images : results with
several angulated radiographs on the same region of interest.
Yves AMOURIQ
*abc, Jeanpierre GUEDON
a, Nicolas NORMAND
a,
Aurore ARLICOT
a, Yassine BENHDECH
a,d, Pierre WEISS
c.
a
IRCCyN/IVC – UMR CNRS 6597- École Polytechnique University of Nantes.
Rue christian Pauc, La Chantrerie, BP 50609, 44306 Nantes – France
b
ERT 2004, UMR_S 791- Odontology dpt University of Nantes.
1 Place A. Ricordeau 44042 Nantes - France
c
LIOAD, INSERM, UMR S791 - Odontology dpt University of Nantes,
1 place A Ricordeau F44042 Nantes – France
d
QualiFormeD, 14 rue de la vieille horloge, 85000 La Roche sur Yon, France
ABSTRACT
Bone microarchitecture is the predictor of bone quality or bone disease. It can only be measured on a bone biopsy, which is invasive and not available for all clinical situations. Texture analysis on radiographs is a common way to investigate bone microarchitecture. But relationship between three-dimension histomorphometric parameters and two-dimension texture parameters is not always well known, with poor results. The aim of this study is to performed angulated radiographs of the same region of interest and see if a better relationship between texture analysis on several radiographs and histomorphometric parameters can be developed. Computed radiography images of dog (Beagle) mandible section in molar regions were compared with high-resolution micro-CT (Computed-Tomograph) volumes. Four radiographs with 27° angle (up, down, left, right, using Rinn ring and customized arm positioning system) were performed from initial radiograph position. Bone texture parameters were calculated on all images. Texture parameters were also computed from new images obtained by difference between angulated images. Results of fractal values in different trabecular areas give some caracterisation of bone microarchitecture.
Keywords: bone microarchitecture, Texture analysis, Computed Radiograph, Micro-Computed-Tomography,
fractal dimension.
1. INTRODUCTION
The BIOREGOS2 project aims to study the bone from several point of views. Fourteen academic research labs in Nantes, Angers and Le Mans are involved in this project from the material characterization, the mechanical, the chemical, and the medical intersections.
Bone microarchitecture is the predictor of bone quality or bone disease like osteoporosis. The study of microarchitecture is based on the measure of width, number, and separation of trabeculae as well as on their spatial organization [1,2]. It can only be measured on a bone biopsy, which is invasive and not available for all clinical situations. Bone texture analysis on radiographs is a common way to investigate bone microarchitecture. But relationship between three-dimension (denoted 3D) histomorphometric parameters and two-three-dimension (denoted 2D) texture parameters is not always well known, with poor results. [3,4]. This is the long term objective that we look for.
*
yves.amouriq@univ-nantes.fr, phone +33 6 08 76 64 457965 - 76 V. 6 (p.1 of 10) / Color: No / Format: A4 / Date: 2011-01-29 01:49:22 AM
In this paper, the three different image acquisitions of the same scene are described in section 2. Section 3 presents multiple results gained during the year from the cross study of microarchitecture and the corresponding 2D texture. This paper specifically focuses onto the so-called fractal dimension. This tool is easily implemented in 2D both for the projection radiograph as well as for the slices obtained from the micro scanner. The reader must be aware that it is very easy to derive this value from any binary image without having a true understanding of its “reality”. However, in the context of bone microarchitecture, this dimension is interesting to investigate because there is a direct link between its evaluation and the local geometry.
2. MATERIALS AND METHODS
2.1 Parameters and Figure of MeritThe aim of this study is to start from different angulated radiographs [5,6] of the same bone Region Of Interest (ROI) and see if a better relationship between texture analysis on several radiographs and histomorphometric parameters derived from micro CT can be developed. In this paper, we have used ImageJ software as well as Octave software in order to compute the different results.
Three texture parameters are often used for bone characterization:
− Hmean parameter : this is a fractal parameter. It can be derived from a geometric point of view by counting the numbers of disks inside boxes of several dimensions. Notice that this algorithm does not give a very precise idea of a real fractal dimension (this can be only obtained from a multiresolution analysis). However, this algorithm fits very well the structure of the bone composed of trabeculaes. This is why we keep this algorithm in this paper (we also keep the fractal word even if probably denaturated in this context). Fractal dimension of trabecular bone projection texture is especially related to connectivity and porosity. According to different authors [3,8,9], the description of the fractal shapes is given by a single parameter, H (Hurst exponent), related to the fractal dimension, D, by H = 2 - D. The higher H is, the smaller the roughness of the path.
− Run-length : this parameter actually corresponds to the previous parameter but in a 1D sense. It corresponds to counting on a line the length of series of black or white values. In order words, this is the “1D fractal” when the box size is only one pixel hight.
− Co-occurrence [7] parameters. These parameters extracted from Aralick Co-occurences matrices are often difficult to jointly interpret for several directions.
Notice that the 27° was derived to allows a specific relationship between radiographs and micro CT. This angle corresponds to a discrete angle in a rectangle triangle where the two orthogonal sides are of relative dimension 2 and 1. This situation gives a Mojette transform angle [10] which can be easily computed from the 3D volume in any directions.
2.2 Digital radiographs
Computed radiography (CR, Kodak RVG system , Rochester, New-York, USA) images of a dog (Beagle) mandible section in molar regions with one tooth were compared with high-resolution micro-CT volumes (denoted µCT) using a Computed-Tomography Skyscan 1072, Kontich, Belgium, voxel size about 19μm. We used also D3A medical systems radiograph (digital radiography system, D3A, Orléans, France) to perform the four same 27° angulated radiographs using another customized positioning system giving the 27° inclination. A Region Of Interest (ROI) including trabecular and cortical bone was determined between tooth roots.
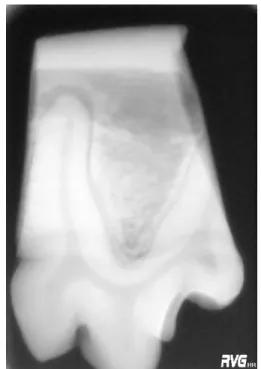
For this study, a Rinn ring (Dentsply) was customized for its arm positioning system. It allows to locate the sample on a specific 3D geometric position within the 2-1 angle relationship mentioned above. Figure 1 presents the customized Rinn ring (fig. 1 -a) as well as a digital radiograph (fig. 1-b) showing a 2D region of interest (2D ROI) corresponding to the trabecular bone that has also been reconstructed in 3D (fig. 1-c) from the micro CT after a manual extraction of the 3D ROI corresponding to the trabecular bone (fig. 1-d).
7965 - 76 V. 6 (p.2 of 10) / Color: No / Format: A4 / Date: 2011-01-29 01:49:22 AM
Figure 1-a Customized Rinn ring system (27° down on this picture)
Figure 1-b: Digital dental radiograph Kodak showing the 2D ROI and Figure 1-c: the 3D corresponding ROI reconstructed by the µCT
Figure 1-d: individualized section of trabecular bone on several slices (human drawing and interpolation) obtained from the µCT: white represents the bone
Four radiographs with 27° angle (up, down, left, right), were performed from initial computed radiograph position (also imaged). This gives us 5 different images of the same bone region onto the radiographs. The µCT gives the three dimensional (denoted 3D) microarchitecture of the bone. Again a 3D ROI was designed by the odontologist in order to
7965 - 76 V. 6 (p.3 of 10) / Color: No / Format: A4 / Date: 2011-01-29 01:49:22 AM
keep only the bone region. It must be mentioned that this 3D ROI only retains the trabecular bone and does not take into account the cortical bone.
Therefore, we have both the texture of the bone onto the radiograph and its corresponding 3D microarchitecture.
2.3 Texture parameters and fractal dimension
The D3A medical system allows texture analysis (double exposure) on radiographs with Hmean, run-length and co-occurrence results. We performed 8 times the measure on the ROI and on all angulated radiographs.
On radiographs issued from Kodak RVG system and from micro-CT, difference between angulated radiographs was calculated using Image J software. After binarisation of the ROI, fractal dimension of the difference image was also calculated.
According to X-ray angulation on RVG radiograph, there is a displacement of the ROI on the pictures produced by the 27° angulation. This displacement was calculated as an equivalent translation (instead of the true 3D rotation) and images were cropped to perform difference on the same zone.
Several ROI with different bone microarchitecture (according to µCT) were used.
2.4 Bone microarchitecture parameters
Bone microarchitecture parameters on the trabecular zone of the ROI were calculated using μCT software (CT AN,Skyscan 1072, Kontich, Belgium).
3. RESULTS
The customized Rinn ring allowed us to obtain images of the same ROI (region of interest) with precise 27° angulation in all directions (angulation of generator, bone and X ray captor fixed). These images are presented on figure 2 for the centered and 27° up displacment. Figure 3 presents images where a lateral 27° (right and left) rotation from the centered position was performed.
Figure 2 : a)RVG 0° (centered) b) RVG 27° up
7965 - 76 V. 6 (p.4 of 10) / Color: No / Format: A4 / Date: 2011-01-29 01:49:22 AM
Figure 3 : a) RVG 27° left lateral b) RVG 27° right lateral
Figure 4 : a) trabecular ROI 0° b) trabecular ROI 27° up
Figure 4 c: 2D correlation of 256x256 trabecular bone ROI : ( 0° - right lateral 27°) and ( 0° and 27° up) ROIs
7965 - 76 V. 6 (p.5 of 10) / Color: No / Format: A4 / Date: 2011-01-29 01:49:22 AM
Figure 4-c presents the 2D correlation between centered image (ROI in fig 4-a issued from fig.2-a) and right lateral (ROI in fig 4-b issued from fig 3-b). Instead of doing this computation onto the whole image, only a 256 square ROI
corresponding to the trabecular bone region was used. After equalization, these two ROI exhibits the same textures of a lumpy background style.
An interesting point of view is given by the displacement in one direction or another one. The 27° rotation gives an idea of the z dimension size of the trabecular region that can be estimated.This was measured and correlated with the 3D micro CT ground truth.
Figure 5 Difference between 0° and 27° left (RVG) Subtraction 0 and 27° left (RVG) Surface plot on difference 0 and 27 ° left (RVG)
Figure 5 shows the difference between centered and 27° images (L1 norm or absolute difference). The simple subtraction between images is also presented but was useless. The trabecular ROI of the difference is presented on the surface plot: it exhibits a very small range of values and the same kind of lumpy background as the ROIs by itself. Doing the same computation with images 27° left and 27° right also gives this kind of difference image still with a small grey level range.
From 0° radiograph and 27° left radiograph, the displacement was measured about 3,01 mm. The knowledge of the angulation and displacement allows for determination of mandible section thickness. This value can be of importance for in vivo experimentation.
7965 - 76 V. 6 (p.6 of 10) / Color: No / Format: A4 / Date: 2011-01-29 01:49:22 AM
Figure 6 Difference from 0 and 27° left images after a correction of displacement
Figure 7 Plot of the difference from 0 and 27° left images after a correction of displacement
After the displacement has been corrected (as in Figure 6), the difference computed between the two images showed in Figure 7 regions zero valued. This is correct to have at least some regions (both trabecular bone and trabecular
separation) that are superimposed and dissapear with the difference.
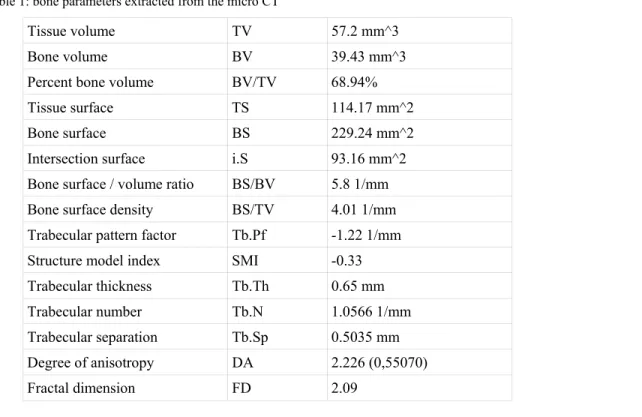
The bone parameter extracted from the micro CT are recalled in Table 1 below. The average trabecular thickness is around 0.6 mm while the average trabecular separation is 0.5 mm. One can find 1.05 trabeculae per mm. These measures are essential since they explain a relative organisation of the micro architecture as well as they lead to the main opinion for the medical viewpoint. The fractal dimension computed here will be discussed later on.
Next are presented Table 2 and Table 3 where the fractal dimension where computed. However, instead of taking the original ROI, here we first computed the difference image between two ROI images of different orientations. In Table 2, the computations were made on centered and 27° acquired radiographs. On Table 3, we computed DRR from the micro CT stack for different orientations. Thus in the second case, there is no need to correct for displacement since the center of the volume is always projected on the center of the projection. Figure 8 shows two images obtained by this DRR procedure which involves the Mojette projector at angle (2,1) corresponding to the 27° angle.
7965 - 76 V. 6 (p.7 of 10) / Color: No / Format: A4 / Date: 2011-01-29 01:49:22 AM
Table 1: bone parameters extracted from the micro CT
Tissue volume TV 57.2 mm^3 Bone volume BV 39.43 mm^3 Percent bone volume BV/TV 68.94% Tissue surface TS 114.17 mm^2 Bone surface BS 229.24 mm^2 Intersection surface i.S 93.16 mm^2 Bone surface / volume ratio BS/BV 5.8 1/mm Bone surface density BS/TV 4.01 1/mm Trabecular pattern factor Tb.Pf -1.22 1/mm Structure model index SMI -0.33 Trabecular thickness Tb.Th 0.65 mm Trabecular number Tb.N 1.0566 1/mm Trabecular separation Tb.Sp 0.5035 mm Degree of anisotropy DA 2.226 (0,55070) Fractal dimension FD 2.09
Table 2 Fractal dimension of ROI on µCT radiographs
Micro CT radiographs(DRR) – ROI on the difference between 0 et 27° name Position (left top pixel) size
Fractal value ROI1 X=320,Y=360 128/128 pixel 1,9066
ROI2 X=320,Y= 360 194/194 pixel 1,7608 ROI3 X=360,Y=300 128/128 pixel 1,6445 ROI4 X=360,Y=428 128/128 pixel 1,7379 ROI5 X=360,Y=300 128/256 pixel 1,7299
Table 3 Fractal dimension of ROIs difference on µCT radiographs DRR
Difference of images
ROI number Fractal value Difference of images ROI number Fractal value Diff 0 - 3,675° ROI1 1,985 Diff 0 - 13,5° ROI1 1,9379 Diff 0 - 3,675° ROI2 1,8143 Diff 0 - 13,5° ROI2 1,7627 Diff 0 - 6,75° ROI1 1,9491 Diff 0 - 20,25° ROI1 1,9012 Diff 0 - 6,75° ROI2 1,8144 Diff 0 - 20,25° ROI2 1,7202 Diff 0 - 3,675° ROI1 1985 Diff 0 - 27° ROI1 1,9066 Diff 0 - 3,675° ROI2 1,8143 Diff 0 - 27° ROI2 1,7608 Diff 0 - 6,75° ROI1 1,9491 Diff 0 - 33,75° ROI1 1,9109 Diff 0 - 6,75° ROI2 1,8144
7965 - 76 V. 6 (p.8 of 10) / Color: No / Format: A4 / Date: 2011-01-29 01:49:22 AM
Figure 8 Mojette Digital Reprojected Radiographs(DRR) obtained from µCT slices of the same ROI (region of interest) with precise 0° and 27° angulation (rotation of bone, generator and X ray captor fixed).
Fig 9-a Difference 0 and 27° left(µCT) Fig 9-b: Surface plot on difference 0 and 27 ° left (µCT)
Figure 9 shows the difference image of the 2 images presented in figure 8. The plot of the ROI exhibits no valley as it was the case in figure 7. This difference image of the ROI can be characterized by the same lumpy background found in figure 5. This was the case for all DRR ROI differences images. Thus, we computed the fractal value of all these differences ROI and the results are presented in Table 3.
In order to compute the fractal value, all these images were finally binarized (with different thresholds without significant changes).As shown in Table 3, the fractal dimension of a ROI of a difference of angulated radiographs is always the same whatever is the angulation (between 3, 675° and 33,75°). In the other hand, the fractal dimension of different ROI of the same difference of angulated radiographs is not the same, especially according to different bone microrchitecture (µCT determination).
Therefore, the fractal dimension of a ROI of a difference of angulated radiographs seems to be a constant parameter correlated to bone microarchitectecture.
7965 - 76 V. 6 (p.9 of 10) / Color: No / Format: A4 / Date: 2011-01-29 01:49:22 AM
This parameter cannot be correlated to Hmean, because this a fractal dimension of the difference image. Without double exposure system, this parameter can give information on bone micro-architecture. Correlated texture analysis on several angulated images gave better informations on bone micro-architecture. The influence of number of angulated radiographs (between 3 and 5), of the angle (27°) will now be studied for further works.
These results allows for completing the analysis between the 2D radiographs that can be obtained in a routine manner from patients and the 3D underlying bone structure.
4. CONCLUSION
Improvement of measurement of texture parameters with several angulated radiographs could allowed a better correlation with bone architecture descriptor and an easy diagnostic. Links between 2D radiographs and 3D micro CT for bone characterization have already been studied. However, the digital tools used here and the high correlations obtained allows for optimistic future characterization on alive bone through only radiographs. The fractal dimension of a difference of angulated radiographs is a constant parameter that can be correlated to bone microarchitectecture. The way of correlation needs further works. Angulated radiographs allowed a better correlation between texture parameters and bone microarchitecture. 3 to 5 angulated radiographs could be an easy way to provide a good knowledge of bone microarchitechture, obtained in a routine manner from patients in a lot of medical applications.
5. ACKNOWLEDGEMENTS
This research has been made under the program BIOREGOS2 with a grant from Région Pays de la Loire.
6. REFERENCES
[1] Dalle Carbonare L, Valenti MT, Bertoldo F, Zanatta M, Zenari S, Realdi G, Lo Cascio V, Giannini S.Bone microarchitecture evaluated by histomorphometry. Micron. ;36_7-8):609-16. (2005)
[2] Müller R, Hildebrand T, Häuselmann HJ, Rüegsegger P. In vivo reproducibility of three-dimensional structural properties of noninvasive bone biopsies using 3D-pQCT. J Bone Miner Res. Nov;11(11):1745-50. (1996)
[3] Guggenbuhl P, Bodic F, Hamel L, Baslé MF, Chappard D. Texture analysis of X-ray radiographs of iliac bone is correlated with bone micro-CT. Osteoporos Int. ;17(3):447-54. (2006)
[4] Southard TE, Southard KA. Detection of simulated osteoporosis in maxillae using radiographic texture analysis. IEEE Trans Biomed Eng ;43-2:123-32. (1996)
[5] Garcia-Figueroa MA, Raboud DW, Lam EW, Heo G, Major PW. Measurement of mesiodistal root angulation for panoramic images and the effect of buccolingual root angulation. Int Orthod. ;7-1:15-30. (2009)
[6] Mayer Y, Machtei EE. Divergence correction associated with implant placement: a radiographic study. Int J Oral Maxillofac implants ;24-6:1033-9. (2009)
[7] Galloway MM. Texture analysis using gray level run lengths. Comput Graph Image Proc ;4:172-179. (1975)
[8] Pothuaud L, Benhamou CL, Porion P, Lespessailles E, Harba R, Levitz P. Fractal dimension of trabecular bone projection texture is related to three-dimensional microarchitecture. J Bone Miner Res. Apr;15-4:691-9. (2000)
[9] Lespessailles E, Gadois C, Lemineur G, Do-Huu JP, Benhamou L. Bone Texture Analysis on Direct Digital Radiographic Images: Precision Study and Relationship with Bone Mineral Density at the Os Calcis. Calcif Tissue Int; 80:97-102. (2007)
[10] Guédon, Jeanpierre et al, The Mojette transform, theory and applications, edited by Jeanpierre Guédon, ISTE-WILEY Publishers, London & New-York (2009).
[11] Bodic, F., Amouriq, Y., Gauthier, O., Gayet-Delacroix, M., Bouler, J.M., Daculsi, G. and Hamel, L.,"Computed tomography assessment of alveolar filling with an injectable bone substitute," J Mater Sci Mater Med 13-10, 953-958 (2002).
[12] Jennane, R., Harba, R., Lemineur, G., Bretteil, S., Estrade, A., Benhamou, C., L., "Estimation of the 3D self-similarity parameter of trabecular bone from its 2D projection," Medical Image Analysis 11, 91-98 (2007).