Publisher’s version / Version de l'éditeur:
Transactions Canadian Society for Mechanical Engineering, 2, 3, pp. 169-174,
1973
READ THESE TERMS AND CONDITIONS CAREFULLY BEFORE USING THIS WEBSITE.
https://nrc-publications.canada.ca/eng/copyright
Vous avez des questions? Nous pouvons vous aider. Pour communiquer directement avec un auteur, consultez la
première page de la revue dans laquelle son article a été publié afin de trouver ses coordonnées. Si vous n’arrivez pas à les repérer, communiquez avec nous à [email protected].
Questions? Contact the NRC Publications Archive team at
[email protected]. If you wish to email the authors directly, please see the first page of the publication for their contact information.
NRC Publications Archive
Archives des publications du CNRC
This publication could be one of several versions: author’s original, accepted manuscript or the publisher’s version. / La version de cette publication peut être l’une des suivantes : la version prépublication de l’auteur, la version acceptée du manuscrit ou la version de l’éditeur.
Access and use of this website and the material on it are subject to the Terms and Conditions set forth at
Cooling load caused by lights
Mitalas, G. P.
https://publications-cnrc.canada.ca/fra/droits
L’accès à ce site Web et l’utilisation de son contenu sont assujettis aux conditions présentées dans le site LISEZ CES CONDITIONS ATTENTIVEMENT AVANT D’UTILISER CE SITE WEB.
NRC Publications Record / Notice d'Archives des publications de CNRC:
https://nrc-publications.canada.ca/eng/view/object/?id=1c3e15a2-0786-4671-946c-c535562c6a9b
https://publications-cnrc.canada.ca/fra/voir/objet/?id=1c3e15a2-0786-4671-946c-c535562c6a9b
O C l
TH1
N21r2
no.
639
c .2
BLDG
NATIONAL RESEARCH COUNCIL OF CANADA
CONSEIL NATIONAL DE RECHERCHES D U CANADA
Cooling Load Caused
by
Lights
by G. P. Mitalas p/ I la=
-
--- , --In .A Reprinted from TRANSACTIONSCanadian Society for Mechanical Engineering
Vol. 2, NO. 3, 1973-74
p. 169- 174
Research Paper No. 639 of the
Division of Building Research
OTTAWA
Charge thermique d6gag6e par des luminaires
SOMMAI RE
Une Btude analytique de la charge thermique dBgagBe par des luminaires nous a indiquB la nBcessit6 d'une determination experimentale de certains param6tres intervenant dans le calcul de cette charge de refroidissement. Pour repondre d ce besoin, une chambre calorimBtrique d pleine Qchelle a kt6 construite e t
Bquipee par la Division de la recherche du bitiment du Conseil National de Recherches du Canada.
Cet article expose les r6sultats d'une serie de tests effectubs dans cette chambre, dans le but de determiner la charge de refroidisse- ment causee par des luminaires fluorescents.
Les conditions d'essais ont BtB multiples et comprennent des effets tels que: I'Bcoulement ou le non-ecoulement d'air d travers des fixations, les coefficients de projet valables pour une gamme de fixations des luminaires, de taux de ventilation e t de capaciths thermiques de la chambre.
Les resultats de ces tests conduisent d la confirmation des con- clusions de I'Qtude analytique et notamment, au fait que la relation entre une variation Bchelon de la puissance lumineuse et la charge thermique de refroidissement correspondante, peut s'exprimer par une expression du type exponentielle avec deux coefficients independants. Un de ces coefficients depend de la capacitB thermique de la chambre e t I'autre e s t une fonction de la facon dont est arrangB le syst6me de ventilation e t du type de fixation des luminaires.
Cooling Load Caused
by
Lights*
ll~z atzalytical study o f t h e coolir~g load res~iltitzg fiorn power irlprit t o ligllts irzdicated t h e need fbr a n experimerztal deterttzitzatiotz o f sorne of' tlze paratneters irzvolved it7 t h e calculatior~s of this load. T o tneet this tzeerl a fill1 scale calori-
'.
Mita'asl MCSME rneter r o o m was briilt u t ~ t l itzstrutnetzted b y tlze Divisiotz o f Brlilditig Research o fRescarch officer
t h e Natiotzal Research Coritzcil o f Canada.
Building Services Scction
Division of Building Research This paper presents t h e results o f a series of' tests that were carried o u t zisitzg
National Research Council of Canada this facility t o measrire t h e cooling load f'br flliorescerlt ligllts b o t h with atzd
Ottawa, Ontario rvitlzout air flow t/zrorigh t h e fixtrires, aticl a set o f clesigtz coefficietzts fbr a range o f light fixtures, vetztilatiotz rates, atzci rootn heat storage capacities.
The reslilts of' these tests cotzji'rm the conclusions reacl~ecl b y t/ze a r ~ u l ~ ~ t i c a l sr~icl)~, tzatnely, t h a t tile relatiotz between a step cllutlge in polver itzprlt t o lights and tile correspotzclit~g cooling load cotnpotzetzt catl be described by at1 espotret~tial t y p e o f expressiotz wit11 t w o indepetzcler~t coefficients. Otie o f tlzenz depends oti t/ze rootn heat storage capacity and t/ze other is a fiitzctiot~ of t h e way the roonz veiztilation systenz is arranged a i d the type o f liglzt Jhtrires that are it~stallecl.
Introduction
Electric lights have relatively low efficacy in terins of ligllt output per watt. This fact, coupled with the trend toward higher and higher levels of illun~ination in buildings, has resulted in the power t o the lights becoming a major source of heat in most modern office buildings. Initially part of this energy is in the form of radiation, which is absorbed by the surfaces that enclose the room, and these surfaces are warmecl by it. Eventually this heat is transferred t o the room air by conduction-convection but there is an appreciable delay before it appears as heat gain by the room air. The type of lighting fixtures that are used and the way that they are integrated into the air supply and exhaust systems also has an important influ- ence on the amount of heat from the lights that enters the room. Both of these effects must be considered by the designers of heating and cooling systems for buildings if adequate and economical systems are to be achieved.
The general problem of calculating cooling load resulting from power input t o lights was investigated analytically(1). That study indicated a need for experimental work t o establish the appropriate values of the convective heat transfer coeffi- cients in rooms with various air supply and exhaust arrange- ments as well as the proportion of input power that is transfer- red upward and downward from the light fixtures. Conse- quently, a full scale calorimeter room was constructed and instrumented(2). It has been used to measure the cooling load for fluorescent lights both with and without air flow through the fixtures. This paper presents the results of these tests.
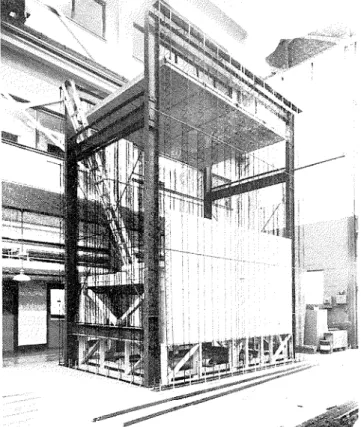
Description of the Test Facility aild Testing Procedure Figure 1 Calorimeter Room - Upper and Lower Concrete The test charnber is a small room 10 x 1 4 ft with a 9-ft-high Floor Slabs in Place.
ceiling and a 3-ft 6-in. space between the ceiling and the under-
side o f the floor above. Figure 1 shows the room during *Manuscript receivcd July 11, 1973 and in a revised form Nov. 1, 1973. construction. The floor consists of precast concrete slabs 6 in. No. 73-CSME-32, EIC Accession No. 1420.
C = C O O L I N G C O I L D = D A M P E R H = H E A T E R F = F A N A = A I R F L O W M E T E R
Figure 2 Calorimeter Room During Construction.
thick supported by a timber frame (weight of construction: 75 lb per ft2 of floor area) and the floor of the room above is the same except tlzat it is suspended from a structural steel frame. In this way there are n o high thermal conductivity members passing from the test room to its surroundings. The walls of the room are 4 in. of foamed plastic insulation with %-in. sheets of plywootl as facings. The inner face is covered by aluminum foil. The wall panels extend down 3 f t 6 in. below the floor t o enclose the space between tlze bottom side of tlze floor and the ceiling below. These wall panels are backed by light steel members which also support tlze outer wall panels. Figure 2 shows tlze first row of wall panels in position. There is a space about 10 in. wide formed by the steel stutls between the inner and outer panels through which air can be circulated. A ceiling of acoustic tiles and six 2-tube fluorescent light fixtures is installed in the room, ant1 a duplicate is installed in the space below tlze floor. Figure 3 shows a schematic cross- section of the facility ant1 also shows the air circulation circuits both in the room ant1 in the guard spaces.
Air at the same temperature as tlze wall surface temperature was circulated tl~rsuglz a space behind the insulated wall panels t o prevent any heat transfer through the walls.
The air conditioning system was all-air with supply ant1 return through one of the following:
Supply: (1 ) ceiling diffuser (2) wall-type fan coil unit (3) light fixtures
Return: ( 1 ) high wall return grille (2) ceiling grille
(3) light fixtures
and with a reheat type of air temperature control where cool- ing is provided by "wild" cooling coil and reheat by electric heater.
Figure 3 Air Circulation System-Unvented Plenum.
The test r o o m represents a section of an interior zone of a large building.
The main components of t h e room heat balance were t h e d.c. power of tlze room air temperature control heater, t h e heat removed by tlze chilled water cooling coil and the a.c. power supplied t o the lights and t o the blower inside t h e room.
The a.c. power input t o the lights and the blower (approx. 600W) was measured by a domestic type watt-hour meter. Tlle d.c. power supplied t o the r o o m air heater was determined by measuring the voltage drops across the heater and a current shunt.
The heat pick-up rate for t h e cooling coil i n the room air circuit was determined by measuring tlze temperature rise of water in passing through the coil, AT2, the temperature rise when the water passed over a n electrical heater, AT1 (E 1.8OF) and the power supplied t o the water heater, H (E 440 W). T h e heat pick-up by the coil is, therefore,
Both AT1 and AT2 were measured by calibrated platinum resistance thermometers with a precision of
*
0 . 0 1°F.The air temperature in the room was measured using ther-
mistors placed a t various points in the room.
The test procedure was very simple. First, t h e calorimeter room was equipped for a desired test condition (i.e., specific air circulation circuit was set u p , etc.). A normal run, consist- ing of two tests, was started and allowed t o continue f o r several days until steady state conditions were obtained. At this time the data recording system was started and a few hours later t h e lights were switched O N . The test was run f o r Trailsactions of the CSME
0
-
z < - z zoo L.L 0-
U u-
. I 0 0 cr - <-
0 0 8:
T I h l E . H O U R SFigure 4 Sample o f Experimentally Determined and Calcu- Figure 5 Sample of Experimentally Detern~inecl and Calcu- lated Cooling Loads Due t o Lights When t h e lated Results for t h e Case When Lights Were
Lights Were Switched ON. Switched O F F .
several more d a y s until steady s t a t e conditions again prevailed t = t i m e measured f r o m instant w h e n lights were a t which time t h e power t o t h e lights was switched O F F t o switched O N .
start t h e second test. This test was terminated after a b o u t 48
hours. A successful r u n required f r o m 7 t o 1 0 clays. This f o r m of a n exponential e q u a t i o n relating a11 excitation W and o u t p u t q ( t ) gives t h e following Z-transfer function, T h e o ~ ~ t p u t s of various transducers were measured o n c e K(z)(3):
every 2 minutes a n d recorded o n magnetic tape in digital f o r m
s o that t h e y could be processed by a digital c o m p u t e r . T h e a z0 + a l z l o u t p u t f r o m this processing was a tabulation a n d a plot o f s
-
q(z) = K(z) = 0W(z) ( 3 )
room t e m p e r a t u r e a n d cooling load variations. Figures 4 a n d 5 1 - b l 2 - I
show typical c o m p u t e r plots.
where In addition, steady s t a t e tests were carried o u t t o determine
t h e fractions of t h e heat pick-up b y t h e ventilation air above
and below t h e ceiling. T w o arrangements of ventilation air b , = e -- BA
return were tested for a range of air flow rates. In b o t h cases
t h e supply was through slots a t t h e side of t h e troffers and t h e A = t i m e interval return was through t h e center a n d around t h e tubes of t h e
"0 =
s(o)
= 1 - . A fixtures. T h e o n l y difference between t h e t w o tests was t h a t in Wo n e case t h e space above t h e ceiling was used as a plenum, a n d
-
kin t h e o t h e r t h e return air was d u c t e d t h r o u g h t h e ceiling space a I = A - - e C B L \ s i n c e a t s t e a d y state q(-) = W and did n o t mix with t h e air in it.
T h e cooling loacl can be expressed, therefore, as T h e variation with t i m e of t h e heat pick-up above a n d
below t h e ceiling by ventilation air a t non-steady conditions
was checked by measuring t h e temperature of t h e ventilation q ( t ) = a o W ( t ) + a l W(t A)
+
b , q ( t A) air entering t h e r o o m , temperature of t h e air as it passesthrougll t h e ceiling, ancl t h e temperature o f t h e air leaving t h e The accuracy o f t h e relationship between q ( t ) a n d W can b e ceiling space. T h e ratio of t h e temperature rises gives t h e r a t i o improved solnewhat by dropping tlle a. t e r m a n d adding an a 2 of cooling load below a n d above t h e ceiling. term, where a = q(A)/W and
Method of Determining Z-Transfer F u n c t i o n Coefficients froin the Experimental Results
T h e analytical s t u d y ( ' ) indicated that t h e cooling required t o maintain c o n s t a ~ l t room air t e m p e r a t u r e can be represented quite well by an expression of t h e form
where
A a n d B are coefficients q ( t ) = cooling load a t t i m e t
W = constant power i n p u t t o lights switched O N a t t i m e = 0
Thus,
Tlle a , , a 2 a n d b l values f o r A = 1.0 h r given in Table 1 were determined f r o m e x p e r i m e n t a l results as follows:
An e x p o n e n t i a l expression o f tlle form E(t) = W
+
k l -k2e-Bt was fittecl t o t h e experimentally determined cooling load. It was assumed that light p o w e r i n p u t , W , a n d the coeffi- cient k l , which represents the residual heat gain o r loss by t h e calorimeter r o o m t o t h e surroundings, were constant. T l ~ e measured values o f cooling load for the first f e w hours were n o t used in t h e s e calculations, a s t h e initial part o f the cooling load curve c o n t a i n s additional exponential terms, which decay within t h e first f e w hours.
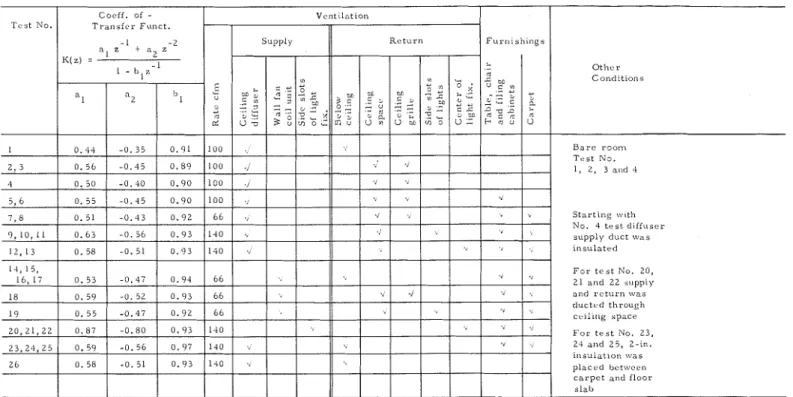
Table 1 , Experimentally Determined Z-Transfer Coefficients for Lights.
T h e b l value was calculated by b l = e - B n a n d using t h e B function is as good as t h e data warrant as is s h o w n in Figure 5 value determined b y t h e exponential curve fit. T h e range of and, in o t h e r cases, t h e measured cooling load a t low values o f t h e b l values determined from t h e experimental results is 0.89 t is n o t sufficiently accurate t o justify t h e determination of a n t o 0.97. and the estimated error is
*
0.005. extended transfer function.T h e a l coefficient was calculated using k 2 , b l a n d W values, i.e.,
F ~ ~ r n i s h i n g s T u s t N o .
Discussion Of Results W-k b
a l = l for first test (i.e., lights switched O N ) n,e ..oi
..
Coe/iicienii W a I z i a 2 z K ( z ) = O t h e r 0 C o n d i t i o n s k c - 2 5 a l 1 u 0 B a r c r o o m T c 5 t No. I , 2 , 3 a n d . i S t a r t i n g w ~ t h N o . 4 t e s t d i f f ~ ~ ~ t r s u p p l y d u c t w a s i n s u l a t e d P o r t c s t N o . 2 0 , 21 a n d 22 s u p p l y and r e t u r n \\,as ductc-d t h r o u g h c < . ~ i l n g s p a c e F o r t c s t No. 2 3 , 2 4 a n d 25, 2-in. i n e u l a t l o n w a sand As a l is t h e ratio of cooling load o n e hour a f t e r t h e lights
are switched O N divided by t h e power i n p u t t o lights, i t depends o n t h e short-term t h e r m a l storage characteristics o f - W
+
k 2 b , for thesecond test are OFF, t h e r o o m . These short-term characteristics d e p e n d , in turn, o na l - W t h e p r o p o r t i o n s of t h e light power t h a t is dissipated b y radiation and convection, t h e light fixture geometry, t h e
C o c f f . o f - T r a n s f u r F u n c t .
- I - 2
ventilation rate, t h e ventilation air supply and return arrange- T h e experimental range o f a l is between 0.44 t o 0.87 and
ment, a n d t h e t y p e of ceiling, as well as t h e t h e r m a l properties the estimated over-all accuracy of a l determined in this way is
*
0.03. of the surface layer of furniture, walls, floor, etc.T h e a 2 value is determined by Eq. 5, i.e., a 2 = 1 - b l - a l . Ventilation
T h e adequacy of t h e transfer functions determined in this way was checked by comparing an experimentally determined cooling load curve and cooling load values calculated using t h e derived transfer function.
S u p p l y
Figures 4 a n d 5 s h o w t h e agreement t h a t obtains using a simple transfer function t h a t is defined b y three coefficients a l , a2 a n d b l .
R c t u r n
T h e fit of t h e calculated values at low values o f t can some- times be improved by using a transfer function with more t h a n three coefficients. This improved fit is s h o w n in Figure 4. T h e extended transfer functions were n o t calculated f o r the o t h e r tests because, i n most cases, t h e fit o f t h e simple transfer
Values for t h e a l coefficient are given i n T a b l e 1 for several different ventilation arrangements in t h e calorimeter rooin. The lowest value, 0.44, was f o r the case where t h e supply o f ventilation air was through a diffuser in t h e ceiling, the r e t u r n was through a grille below t h e ceiling a n d t h e room was n o t furnished, while t h e highest value, 0.87, was for t h e case where ventilation air was supplied a n d returned t h r o u g h t h e light fixtures.
T h e values o f a l should n o t depend o n the l o n g - t e r n ~ r o o m thermal storage characteristics such as t h e t o t a l heat storage capacity of t h e floor slab and walls. This aspect of the depen- dence o f a l o n room details was confirmed a s follows: t w o tests were carried o u t where t h e long-term thermal storage characteristics o f the calorimeter room were modified dras- tically b y adding 2 in. of foamed polystyrene insulation between t h e c a r p e t a n d t h e concrete slab. T h e values deter-
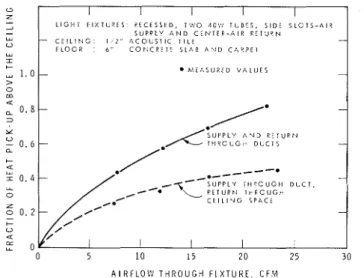
Figure 6 Fraction of Light Power Input that Appears as Cooling Load in Ceiling Space Versus Air Flow Through Vented Light Fixtures.
mined from these tests were a l = 0.58 for the standard floor and a l = 0.59 for the floor with 2 in. of insulation. The good arrangement between then1 indicates that a l is n o t very depen- dent o n the long-term heat storage capacity o f the room.
The lower values of b l were for the cases of the vented ceiling space and the higher values were for t h e unvented ceiling space and low ventilation rates. The addition of furni- ture into the room did n o t alter the bl value by a measurable amount, but the addition of carpet over all the floor surface increased the value of b , . The b1 value was not altered when the light fixtures were used as air supply and return registers even though the a l value varied quite markedly.
In general, these results confirm the conclusion reached b y the analytical s t u d y that bl values increase with the increase of heat transfer resistance between room air a n d various sur- faces in the room. For example, lower ventilation rate, carpet cover of floor surface, etc., increased the thermal resistance between room surfaces and rooin air and thus increased the b l value. 0 C, Z - 2 - w -0 w I C , 1 . 0 > o m u
,
0.8 I Y 0 - 0.6 a Tlze "bl " CoefficientsA I R F L O W T H R O U G H F I X T U R E . C F M The "aZ" Coefficients
I I I I I L I G I l i I I X T U P [ S P E C I S S E D . T Y I O .<O\'I I U D L S , S I D E S L O I S - A I R S U P P L Y A N D C C N T E P - A I R R L T U P N - C E I L I N G : 1.1" A C O U S T I C T I L E r L o o P 6 " C O N C R ~ T ~ S L A B A N D C A R P E T - M E A S U R L D V A L ~ I E S - - - /* - G;~~~ ;;~;u;;;;;/: -
The b1 coefficient defines the rate of cooling load increase or decrease after the lights are switched. The experimentally deterinined bl coefficients varied between 0.89 and 0.97. This variation was d u e t o different ventilation rates, types of light fixtures and the way the ventilation air was supplied and exhausted but n o t because of the changes in room construc- tion, as only one room construction was used for all the tests, (except for one special test of insulated floor already described).
C u
-
.-
-
----* / S U P P L Y I H P O U G I I D U C T ,--*-L
R E T U R N T H R O U G H C F I L I N G S P A C I - I I I 0 5 10 1 5 2 0 2 5 3TabIe 2 Design Values of " a l " Coefficient.
The a2 coefficient is given b y Eq. (5) i.e., a2 = 1 - b, - a , .
Eq. (5) is based on the assumption that the cooling load a n d power input t o lights eventually become equal. This is a valid assumption for t h e calorimeter room.
Roovr and Ceiling-Space Loads
The test results given in Figure 6 indicate a significant dif- ference (approximately 30 per cent at usual ventilation rate) between the heat pick-up by ventilation air above and below the ceiling for ducted and non-ducted air returns through ceiling space. This is because s o m e o f the heat picked up by ventilation air is transferred back into the room through t h e floor slab and ceiling when the space above the ceiling is used as a return air plenum. The use of ducted returns reduces this heat leakage substantially.
The tests carried out t o check the variation o f the ratio o f the cooling load above t o the load below tlle ceiling sllowed that it is nearly constant with time after the light power is switched, i.e., in a typical case it varied only fro111 0.40 t o
I'urnisl!ings
-- : \ i r .S~q>l)ly arid 1:c:l~u'~l I:,~K: U C l , i g l ~ t l' i s l ~ u - < , -- '5 t l l ~ , ~ ,sr '.;<I ''
lIc;n,y!:i.igl~l, s i n g l e 1.0:: ~ . ; ! t c ; .iul~ld:, and I it,ccarilt!, . . . 1 1 ~ 1 \'clltc<l ).: ...
r r r n i - l i i ~ l g s , n u i.i>rl~<lt rc11r11 Lclo:: c ~ , i l i n g ( \ ' < . 2 ) ( ; , )
o r t : i ~ ~ ? ~ r ) . l ' ~ ~ x n i l . u r c , ?Ictlim:! ti, l ~ i g l > r a l c : l:~.cessccl, n:,t .:cnt~.d . > > ( ! t ' ( c )
nu c ; ~ r l w t sup;>ly and r t , t u r n 1,ulo:: w i l i n g o r tlrr iugll c e i l i n g ~ 1 . i l l c ;lnd s p a c e ( \ ? , . . > ) ( a ! o r d i n a r y r ~ r n i t u r i . , !.I~cli~u:! t o I ~ i g l l r( , t c cmr r . . , i l ! ~ u r ::itIlout i n n c t , i l u r i n i ' u c t i t j n cttrl~wl t y ~ ~ e a i r ~ . o ~ l d i l i . i n i n g tcnlii n a l u n i t ; su;,ply t l i r o u g l ~ c c i l i t l g u r ':;~ll. diffuser; r e t u r n a r , ~ u n d l i g l l l l i x t u u c ; ; ~ n d t!~rougll c c i l i n g s p a c c ,: (.$ 2 .;.;)(;,:
:\I!? t ~ l ~ : arc L'urnit~u'e l : , ~ c t c d r e t u r n s l h r o u g h ! ~ n t < . c l tur i ' r t : i ~ - h a n g i n ~ i n . , ,)I. ::l.,?alul. ( < I )
l i g l l t i ' i s t u r c s a i r s l r e i l r t ~ ::it11 d n c ~ l , c l ,'i1urr1s
NO'I 1.S :
( ( 1
>
\ i s r ~ ~ o r n a i r s u p p l y r a l c i n cfl,: [,cr sc1. f t . $>I' l'1 N L , ~ i%re;3(I>'$ ln c r c t t s e ;tl by \.i>:j , . I I ~ I I carpc:t i s used
( c , ' I!IC e f f e c t * > C I 2 1 v a l u e I)), l51rnis!lings ~ l c t : ~ . c ~ ~ s c s ;.;1!<,11 l i g h t L'isL~lI'es ; I r e :2s~:cl ;ID 2 i r a~t]~i>l.) a r ~ ! i . ~ i - r u t u r r ~ ru g i s l c r s
( d : ' l l ~ i,oluc: i s c i l ~ l ~ l t c ~ t h e C r ; ! c t i u ~ ~ ~ 1 ' t!le lip111 pu:;m i n ] , u t tl1a1 i s ;,ii.l,<,d up 1,). v c n t i l . ~ t i r , t r a i r ;it
l i z l 1 1 1 ' i x ' ~ u r e s ur 2.-';, ~ . : l ~ i e l ~ ~ v c r i s gu<?,ltCr.
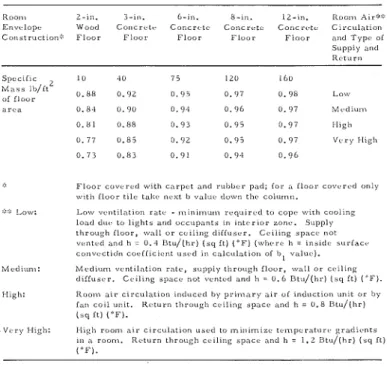
Table 3 The " b l " Values Calculated for Different Room Air Circulation Rates and Envelope Construction.
Room 2 - l n . 3 - 1 n . 6 - l n . 8 - l n . 1 2 - l n . [Loom r Z ~ r L ' , E ~ i v c l o p c Wood Corrcrutt. C o n c r c tv Coricrl.tr. C o n c r c t v Circu1;ltlon C o n a l r u c t ~ o n ; : F l o o r F l o u r F l o o r F l o u r F l o o r arid T y p c o i S u p p l y and R i . t u r n S [ x : c z i ~ c 1 0 .I0 7 5 I 2 0 160 b i a i s 1b/it2 uf f l o u r 0 . 8 8 0 . 9 2 0 . 9 i 0 . 9 7 0 . 9 8 Lou. arcs 0.8.1 0. 90 0.9-1 0 . 9 6 0 . 9 7 > l c r l ~ i ~ n ~ 0 . 8 1 0 . 8 8 0 . 0 3 0 . 9 5 0 . 9 7 1llg11 0 . 7 7 0 . 8 5 0 . 9 2 0 . 9 5 0 . 9 7 V ~ r y High F l o o r c u x ~ r c d w ~ t h c a r p u t a n d r u b b v r p a d ; f o r i, i l o o r c o v u r c d only w ~ t l i i l u o r 1 1 1 ~ tal:r n e x t 1, v a l u u du\r,n tile c o l u m n .
.: i I",": L o w v u n t l l a t r o n r a t c - ~ n ~ n ~ r n u m r c c j u ~ r u t l to c o p e w > r h c o o l ~ n g l o a d d u ~ t o I l g h t s arid u c c u p a n t s un ~ n t e r l o r zonr.. S u p p l y t h r o u g h i l o o r , xvi~ll u r c c ~ l l n g d ~ i i u s r r . C c l l l n g s p a c c n o t vi.ntr.d a n d h = 0.4 f i t u / ( h r ) ( i q i t ) ( ' F ) ( w i i c r e h = ~ n a l d r . ~ o r i a c r c o n v e c t l d n c o c i i l c l c n t u s u d i n c a l c u l a l l o n of b v.iluc.).
bicd>tmm: M c r l ~ u m v c r i t ~ l i l t ~ o r i r a l c , .iupply t l ~ r o u g h f l o u r , \villi o r c c ~ l ~ n g d ~ f f u s e r . C r l 1 i n g s p a c ~ not vcntud a n d 11 = 0. 6 ~ t u / ( l i r ) ( s q i t ) ( ' F ) . CIlgh: R o o m a ~ r c ~ r c u l a l ~ o ! ~ i n r l u c r d by p r r m a r y a ~ r u i r n d u c t l o ~ i u n ~ t o r by
fi,n c o t 1 unit. R c t u r n t i ? c u u g l ~ c u > l l n g = p a c e ;inrl h = 0 . 8 l i l u / ( h r )
('(i f t ) ( " F ) .
r V..ry Hlgii: lligii room air c ~ r c u l n t ~ o n in3cd to rnnilrnlzc t c m p c r a t u r v g r a d ~ r . n t a
In a r o o n i . R ~ . t u r n th r o u g h c c l l l n g ,pact a n d h = 1 . 2 U t u / ( h r ) ( a q f t )
("I.').
0.34. This indicates that a single transfer function can be used t o calculate the total cooling load caused by lights, and the loads in the ceiling space and room below are nearly constant fractions of this total.
Design Data Derived frorrl
Experitliental Results ancl Calculations
The experimental results by themselves are of limited value for design calculations since they do not cover a broad range of room construction, type of light fixtures, o r variations of installation and ventilation systems. The experimental results have been used, however, t o derive a set of design data for calculations of room cooling load due t o lights. These design data (i.e., coeff. a l and b l ) are given in Tables 2 and 3.
The set of design values of a l given in Table 2 for a range of types o f light fixtures, ventilation rates, systems, and room furnishings, has been derived from the experimental results simply by grouping the features of the r o o m light fixtures, and ventilation system that are appropriate for a single value of a l
.
The estimated precision of the al value that can be obtained from Table 2 is about +- 0.05.The design values of bl given in Table 3 for different room constructions that are characterized by their mass per ft2 of floor area, S, and for different room air circulation intensities were computed using the procedure described in References 4 and 5. (In these papers the b l value is called the ratio of successive terms.) This procedure takes i n t o account heat storage by room envelope components, heat interchange between room air and room surfaces by convection, and heat interchange by radiation inside the room. In these calculations two parameters were varied: t h e heat storage capacity of the room, and the inside surface convection coefficient. The first depends o n the floor slab thickness; the second on the room air circulation intensity.
There was good agreement between the calculated and the experimentally determined values of b l for S = 75 lb/ft2 of floor area (S for the experimental room is approximately 75 lb/ft2 also) indicating that this calculation procedure is
adequate for determination of b l values for typical room con- struction. The estimated precision o f the b l values that can be selected from Table 3 for usual room construction is f 0.01 for the higher values of b l and f 0.02 f o r t h e lower ones. It
should be noted that the addition o f extra resistance between room air and floor slab, such as a heavy carpet, increases t h e bl value. This was demonstrated by an experiment where 2 in. of insulation was placed between carpet a n d floor slab. Althougli the S value remained unchanged, the b l value increased from 0.93 t o 0.97. Thus, in special cases where t h e aptness of the value selected by Table 3 is in d o u b t and high precision is needed, the b l value should be calculated by t h e procedure outlined in References 4 and 5 or determined by test on a full-scale prototype.
Acknowledginent
The author wishes t o acknowledge t h e assistance of R.
Jaekel in running the test and J. G . Arseneault i n tlie prepara- tion of computer programs.
This paper is a contribution from the Division of Building Research, National Research Council of Canada, and is pub- lished with the approval of the Director of the Division.
References
1. Ki~nura, K. and Stephenson, D. G., ASHRAE Trarlsactiorrs, 74, Part 11, 189-197, 1968.
2. Mitalas, G. P. and Ki~nura, K. ASHRAE Trarzsactior~s, 77, Part 11,
1971.
3. Ragazzini, J. R. and I:ranklin, G. F., Sarrzpled-Data Control Systerrzs, McGraw-Hill Book Co., Inc., 1958.
4. Mitalas, G. P. and Stepl~enson, D. G., ASHRAE Trarlsactiorls, 73, Part I, 1967.
5. Stephenson, D. G. and Mitalas, G. P. ASHRAE Trar~sactiorls, 73, Part 1, 1967.
Nomenclature:
A = coefficient
a,,a, ,a,, b,, = coefficients of z-transfer function
B = coefficient
E (t) = exponential function of time fitted to t h e experimentally determined cooling load
K (2) = z-transfer function k l , k2 = coefficients
4 ( t ) = cooling load at time t
S = parameter t o describe room construction-total room component weight divided by floor area, lb of mass per sq ft of floor area
t = time
V = room air supply rate in cfm per sq ft of floor area
W = constant power input t o lights switched ON at time t = 0
z = z-transform variable
a
= time intervalAT = temperature difference
This publication is being distributed by the Divisioil of Building Research of the National Research Council of Canada. It should not be reproduced in whole or in part without permission of the original publisher. The Division would be glad t o be of assistance in obtaining such per- mission.
Publications of the Division may be obtained by mailing the appropriate remittance (a Bank, Express, or Post Office Money Order, or a cheque, made payable t o the Receiver General of Canada, credit NRC) t o the National Research Council of Canada, Ottawa.
KIA
0R6. Stamps are not acceptable.A
list of all publications of the Division i s availableand may be obtained from the Publications Sec- tion, Division of Building Research, National Research Council of Canada, Ottawa.