Comparative Functional Genomics of the Fission Yeasts
The MIT Faculty has made this article openly available.
Please share
how this access benefits you. Your story matters.
Citation
Rhind, N., Z. Chen, M. Yassour, D. A. Thompson, B. J. Haas, N.
Habib, I. Wapinski, et al. “Comparative Functional Genomics of the
Fission Yeasts.” Science 332, no. 6032 (May 19, 2011): 930-936.
As Published
http://dx.doi.org/10.1126/science.1203357
Publisher
American Association for the Advancement of Science (AAAS)
Version
Author's final manuscript
Citable link
http://hdl.handle.net/1721.1/85647
Terms of Use
Article is made available in accordance with the publisher's
policy and may be subject to US copyright law. Please refer to the
publisher's site for terms of use.
Comparative Functional Genomics of the Fission Yeasts
Nicholas Rhind1,†, Zehua Chen2, Moran Yassour3,4,5,*, Dawn A Thompson3,*, Brian JHaas2,*, Naomi Habib5,6,*, Ilan Wapinski3,7,*, Sushmita Roy3,8,*, Michael F. Lin8, David I
Heiman2, Sarah K Young2, Kanji Furuya9, Yabin Guo10, Alison Pidoux11, Huei Mei Chen12,
Barbara Robbertse13,25, Jonathan M. Goldberg2, Keita Aoki9, Elizabeth H. Bayne11,26,
Aaron M Berlin2, Christopher A. Desjardins2, Edward Dobbs11, Livio Dukaj1, Lin Fan2,
Michael G FitzGerald2, Courtney French6, Sharvari Gujja2, Klavs Hansen14,27, Dan
Keifenheim1, Joshua Z. Levin2, Rebecca A. Mosher15,28, Carolin A. Müller16, Jenna
Pfiffner2, Margaret Priest2, Carsten Russ2, Agata Smialowska17,18, Peter Swoboda17, Sean
M Sykes2, Matthew Vaughn14, Sonya Vengrova19, Ryan Yoder13, Qiandong Zeng2, Robin
Allshire11, David Baulcombe15, Bruce W. Birren20, William Brown16, Karl Ekwall17,18,
Manolis Kellis8,3, Janet Leatherwood12, Henry Levin10, Hanah Margalit6, Rob
Martienssen14, Conrad A. Nieduszynski16, Joseph W. Spatafora13, Nir Friedman5,21, Jacob
Z. Dalgaard19, Peter Baumann22,23,24, Hironori Niki9, Aviv Regev3,4,24,†, and Chad
Nusbaum2,†
1Biochemistry and Molecular Pharmacology, University of Massachusetts Medical School, 364
Plantation Street, Worcester MA 01605 USA
2Broad Institute of MIT and Harvard, 320 Charles St., Cambridge MA 02141 USA 3Broad Institute of MIT and Harvard, 7 Cambridge Center, Cambridge MA 02142 USA 4Department of Biology, Massachusetts Institute of Technology, 77 Massachusetts Avenue,
Cambridge MA 02139 USA
5School of Computer Science and Engineering, Hebrew University, Jerusalem, Israel 6Department of Microbiology and Molecular Genetics, Faculty of Medicine, The Hebrew
University, Jerusalem 91120 Israel
7Department of Systems Biology, Harvard Medical School, 200 Longwood Ave, Alpert 536,
Boston, MA 02115 USA
8Computer Science and Artificial Intelligence Laboratory, Massachusetts Institute of Technology,
32 Vassar St. 32-D510, Cambridge, MA 02139 USA
9Microbial Genetics Laboratory, Genetic Strains Research Center, National Institute of Genetics,
1111 Yata, Mishima, Shizuoka, Japan
10Eunice Kennedy Shriver National Institute of Child Health and Human Development, National
Institutes of Health, Bethesda MD 20892 USA
11Wellcome Trust Centre for Cell Biology, Institute of Cell Biology, School of Biological Sciences,
The University of Edinburgh, 6.34 Swann Building, Mayfield Road, Edinburgh EH9 3JR, UK
†To whom correspondence should be addressed. nick.rhind@umassmed.edu (NR), aregev@broad.mit.edu (AR),
chad@broadinstitute.org (CN).
25Present addresses: National Center for Biotechnology Information, National Library of Medicine, National Institutes of Health, Department of Health and Human Services, 45 Center Drive, Bethesda, MD, 20892, USA
26Wellcome Trust Centre for Gene Regulation and Expression, College of Life Sciences, University of Dundee, Dundee DD1 5EH, Scotland, UK
27Evolva Biotech A/S, Bülowsvej 25, 1870 Frederiksberg C, Denmark
28The University of Arizona, The School of Plant Sciences, 303 Forbes Bldg., 1140 E. South Campus Dr., Tucson AZ 87421 USA
NIH Public Access
Author Manuscript
Science. Author manuscript; available in PMC 2011 November 20.
Published in final edited form as:
Science. 2011 May 20; 332(6032): 930–936. doi:10.1126/science.1203357.
NIH-PA Author Manuscript
NIH-PA Author Manuscript
12Department of Molecular Genetics and Microbiology, Life Science, room 130, State University
of New York, Stony Brook, NY 11794 USA
13Department of Botany and Plant Pathology, Oregon State University, Corvallis, OR 97331 USA 14Cold Spring Harbor Laboratory, 1 Bungtown Road, Cold Spring Harbor NY 11724 USA
15Department of Plant Sciences, University of Cambridge, Downing Street, Cambridge, CB2 3EA,
UK
16Centre for Genetics and Genomics, University of Nottingham, Queen's Medical Centre,
Nottingham, UK
17Karolinska Institute, Center for Biosciences, Dept of Biosciences and Nutrition, Stockholm,
Sweden
18Department of Life Sciences, Sodertorn Hogskola, Huddinge, Sweden
19Warwick Medical School, University of Warwick, Gibbet Hill Campus, Coventry CV4 7AL, UK 20Broad Institute of MIT and Harvard, 301 Binney St., Cambridge MA 02141 USA
21Alexander Silberman Institute of Life Sciences, Hebrew University, Jerusalem, Israel 22Stowers Institute for Medical Research, Kansas City MO USA
23Department of Molecular and Integrative Physiology, University of Kansas Medical School,
Kansas City KS USA
24Howard Hughes Medical Institute
Abstract
The fission yeast clade, comprising Schizosaccharomyces pombe, S. octosporus, S. cryophilus and S. japonicus, occupies the basal branch of Ascomycete fungi and is an important model of eukaryote biology. A comparative annotation of these genomes identified a near extinction of transposons and the associated innovation of transposon-free centromeres. Expression analysis established that meiotic genes are subject to antisense transcription during vegetative growth, suggesting a mechanism for their tight regulation. In addition, trans-acting regulators control new genes within the context of expanded functional modules for meiosis and stress response.
Differences in gene content and regulation also explain why, unlike the Saccharomycotina, fission yeasts cannot use ethanol as a primary carbon source. These analyses elucidate the genome structure and gene regulation of fission yeast and provide tools for investigation across the Schizosaccharomyces clade.
The fission yeast genus Schizosaccharomyces forms a broad and ancient clade within the Ascomycete fungi (Fig. 1A) with a distinct life history from other yeasts (1). Fission yeast grow preferentially as haploids, divide by medial fission rather than asymmetric budding, and have evolved a single-celled lifestyle independently from the budding yeasts
(Saccharomycotina). Fission yeasts share important biological processes with metazoans, including chromosome structure and metabolism (relatively large chromosomes, large repetitive centromeres, heterochromatic histone methylation, chromodomain
heterochromatin proteins, siRNA-regulated heterochromatin and TRF-family telomere binding proteins), G2/M cell cycle control, cytokinesis, the mitochondrial translation code, the RNAi pathway, the signalosome pathway and spliceosome components with metazoans. These features are absent or highly diverged in budding yeast. In general, core orthologous genes in fission yeast more closely resemble those of metazoans than do those of other Ascomycetes (2). Fission yeasts have also evolved innovations in carbon metabolism, including aerobic fermentation of glucose to ethanol (3). This convergent evolution with the
NIH-PA Author Manuscript
NIH-PA Author Manuscript
budding yeast Saccharomyces cerevisiae offers insight into the evolution of complex phenotypes.
S. pombe is widely used as a model for basic cell-biological processes and to study genes implicated in human disease. To better understand its evolution and natural history, we have compared the genomes and transcriptomes of S. pombe, S. japonicus, S. octosporus and S. cryophilus, which constitute all known fission yeasts.
Genome sequence and phylogeny
We sequenced and assembled the genomes of S. octosporus, S. cryophilus and S. japonicus using clone-based and clone-free whole-genome shotgun (WGS) approaches (Table S1). Each genome is ~11.5 Mb in size. S. octosporus and S. cryophilus are 38% GC; S. japonicus is 44%. By comparison, the S. pombe genome is 12.5 Mb in size and 36% GC. We
assembled the S. octosporus and S. japonicus scaffolds into 3 full-length chromosomes of similar quality to the finished S. pombe genome (Figs. 1B, S1, S2 and Tables S2, S3) and identified telomeric sequence using WGS data (4). Telomere-repeats in S. japonicus (GTCTTA), S. octosporus (GGGTTACTT) and S. cryophilus (GGGTTACTT) matched a one and a half repeat-unit sequence at the putative telomerase-RNA locus, similar to the configuration in S. pombe (GGTTAC) (5). Using these motifs, we extended the S. japonicus and S. octosporus chromosomes into subtelomeric and telomeric sequence (4).
We constructed a phylogeny of the Schizosaccharomycetes within Ascomycota (Fig. 1A, S3) from 440 single-copy core orthologs, placing the monophyletic Schizosaccharomyces species as a basal sister group to the clade including the filamentous fungi (Pezizomycotina) and budding yeast (Saccharomycotina). We found an average amino acid identity of 55% between all 1:1 orthologs between S. pombe and S. japonicus, similar to that between humans and the cephalochordate amphioxus (Table S4). For the most closely related species, S. cryophilus and S. octosporus, 1:1 orthologs share 85% identity on average, similar to humans and dogs. The genetic diversity within S. pombe is low. Comparing S. pombe 972 to WGS of S. pombe NCYC132 and S. pombe var kambucha, two phenotypically distinct strains, revealed less than 1% nucleotide difference between the three strains (Fig. S4, Table S5).
Eradication of transposons and reorganization of centromere structure
Transposons and other repetitive sequences are thought to be crucial for centromeric function through the maintenance of heterochromatin (6). These sequences evolve rapidly, but the evolutionary relationship between centromeres, transposons and heterochromatin is unclear, in part because fungal centromeres have not generally been included in genome assemblies. The S. japonicus genome harbors 10 families of gypsy-type retrotransposons (4) (Figure S5 and Table S6). Sequence divergence of their reverse transcriptases suggests that these transposon families predate the last common ancestor of the Ascomycetes. However, a dramatic loss of transposons occurred after the divergence of S. japonicus; S. pombe harbors two related retrotransposon, Tf1 and Tf2; S. cryophilus has a single related retrotransposon, Tcry1; S. octosporus contains no transposons, but contains sequences related to reverse transcriptase and integrase that may represent extinct transposons (Fig. S5, Table S6). The disappearance of transposons in the post-S. japonicus fission yeast species correlates with the appearance of the cbp1 gene family, suggesting a transition in the control of centromere function. In S. pombe, Cbp1 proteins bind centromeric repeats and are required for transposon silencing and genome stability (7, 8). Although described as orthologs of CENP-B, a human centromere-binding protein, Cbp1 proteins apparently evolvedindependently within the Schizosaccharomyces lineage from a domesticated Pogo-like DNA
NIH-PA Author Manuscript
NIH-PA Author Manuscript
transposase (9). The appearance of the cbp1 gene family also correlates with the switch from RNAi-mediated transposon silencing in S. japonicus (see below) to a Cbp1-based
mechanism in S. pombe, suggesting that this shift to Cbp1-based transposon control allowed the eradication of most transposons from the fission yeast genomes, possibly by promoting recombinational deletion between LTRs (8). Furthermore, the cbp1 family is evolving rapidly (Fig. S6), suggesting that Cbp1-based transposon silencing is a
Schizosaccharomyces-specific innovation that arose after the divergence of S. japonicus. The loss of transposons was accompanied by a significant reorganization of chromosome architecture that conserves centromere function, suggesting evolution of novel centromere structures that compensate for the loss of transposons. In S. japonicus, transposons cluster next to telomeres and centromeres, as in metazoans (Fig. 1B,C). In the other
Schizosaccharomycetes, the subtelomeres and pericentromeres are also repetitive, but lack transposons (Fig. 1C). However, like S. japonicus, the centromeric and subtelomeric repeats are confined to pericentromeric and subtelomeric regions, respectively, with one exception — a centromeric repeat involved in transcriptional silencing at the S. pombe mating-type locus (10). We confirmed that the centromeres are heterochromatic by histone H3 lysine-9 methylation mapping (Fig. S7), and by showing that the S. japonicus centromeres are functional by meiotic mapping (Table S2).
Although centromeric repeats evolve rapidly, differing even between related strains (11), individual repeat sequences tend to be similar within strains (Fig. 1C). No similarity was observed between the centromeric repeats of S. pombe, S. octosporus or S. cryophilus. However, both S. pombe and S. octosporus centromeres contain repeated elements, highly similar between chromosomes, that are arrayed in a larger inverted repeat structure around a unique core sequence (Fig. 1C), suggesting that they are homogenized by non-reciprocal recombination. This contrasts with a lack of symmetry in S. japonicus, and implies that transposition occurs more rapidly than homogenization by recombination. Thus, the suppression of transposition likely led both to the degeneration of transposon sequences and to the evolution of symmetric centromeric repeats.
Despite the divergence of centromere sequence and of gene order on the chromosome arms, karyotype and pericentromeric gene order are conserved between S. pombe and S.
octosporus (Fig. S8). Thus, although gene conversion maintains the similarity of
centromeric repeats between the different centromeres, crossover recombination between centromeres is suppressed. We observed neither centromeric translocations nor neo-centromere events within these lineages, despite the fact that neo-centromeres can occur at novel locations in manipulated S. pombe strains. The retention of repetitive elements in the centromeres of (12) S. pombe, S. octosporus and S. cryophilus, even as they have lost their transposons, implies that centromeric repeats have an important function.
Since siRNAs are involved in both transposon silencing and centromere function (13), we investigated these roles in the Schizosaccharomyces lineage. In S. pombe, the centromeric repeats produce dicer-dependent siRNAs required for maintenance of centromeric structure, function and transcriptional silencing via Argonaute-dependent heterochromatin formation (14). However, transposons are silenced in S. pombe by RNAi-independent mechanisms and do not produce abundant siRNAs (Figs. 1B, S9) (7). To investigate whether centromere-directed siRNA production is conserved within the transposon-rich centromeres of S. japonicus, we sequenced small RNAs from log-phase S. japonicus cultures (which have a modal size of 23 nt) (4) and found that 94% map to transposons, both telomeric and centromeric (Figs. 1B, S9). The fact that siRNAs map to transposons in S. japonicus but not in S. pombe suggests that either the fission yeast RNAi pathway targets repetitive sequences
NIH-PA Author Manuscript
NIH-PA Author Manuscript
instead of mobile elements per se, or that the pathway evolved away from an ancestral role in transposon control to a dedicated role in heterochromatin function.
Evolution of mating-type loci
The structure of the mating-type loci and the cis-acting elements that regulate mating-type switching is highly conserved across all four species (Fig. S10). The expressed mat1 locus can contain either the plus (P) or the minus (M) allele and switches between the two by epigenetically-programmed gene conversion (15–17) from two heterochromatically-silenced donor cassettes: mat2-P and mat3-M (Figs. S10, S11). cis-acting regulatory sequences required for epigenetic imprinting and recombinational switching (18–20)are conserved (4) (Fig. S11), as is the epigenetically-programmed genomic mark associated with mat1 (15). In contrast, none of the cis-acting sequences involved in transcriptional repression of the silent cassettes in S. pombe are identifiable in the other species, although the donor cassettes are enriched for H3K9me heterochromatin (Fig. S7). In S. japonicus, the silent mat loci directly abut the centromere of Chromosome 3, suggesting that they may be silenced by a positional effect. In S. octosporus and S. cryophilus, the mat loci are distant from the centromeres, but each contains a conserved region of transposon remnants, which may be silencing triggers. Interestingly, they also contain inverted repeats, albeit shorter and less similar to each other than the inverted repeats that flank the mat2/3 locus in S. pombe (21). Thus, their silencing strategies may share elements from both S. pombe and S. japonicus. These results suggest that the mechanisms of imprinting and switching have been conserved, but that the strategies for establishing heterochromatin are plastic.
Comparative annotation of transcriptomes
We annotated the three genomes using standard methods and compared them with S. pombe (4). We then deep-sequenced polyA-enriched, strand-specific cDNA (22–24) (RNA-Seq), and constructed de novo transcript models (Fig. S12) for log phase, glucose depletion, early stationary phase and heat shock from S. pombe, S. octosporus, and S. japonicus and log phase, glucose depletion and heat shock from S. cryophilus.
In S. pombe, we reconstructed 4277 out of 5064 previously annotated genes; of the remaining 788 genes, 60% were covered over at least 90% of their length. 400 of our transcript models change coding exon structure of the gene, 95% of which maintained or improved conserved coding capacity (Table S7, S8 and Figure S12) (25). In addition, we identified 253 UTR introns. Lastly, we found 89 new protein-coding genes in S. pombe, 53 of which are conserved (Table S7 and Figure S13). We found no evidence that intron-rich fission yeast genes engage in metazoan-like alternative splicing (26). We found evidence for 433 alternative splicing events in S. pombe in the form of intron retention and alternative splice-donor or -acceptor usage, but no evidence of exon skipping or alternative exons; we found similar levels of splice variants in the other species (Table S9). However, since many of these variants disrupt the coding capacity (Fig. S14, S15) and only a minority of intron-retentions (146/393) are conserved between two or more species, we suspect that much of alternative splicing in fission yeast represents nonproductive splicing variants. Interestingly, in some cases the non-spliced variant may be the protein-coding isoform (Figure S14C,D, S15, Table S10).
Transcription primarily represents protein-coding transcripts
The majority of stable fission yeast transcripts originate from annotated protein coding genes. Most of the S. pombe genome is transcribed (22) with 91% of nucleotides covered by at least one RNA-Seq read. However, most transcription, as measured by steady-state
NIH-PA Author Manuscript
NIH-PA Author Manuscript
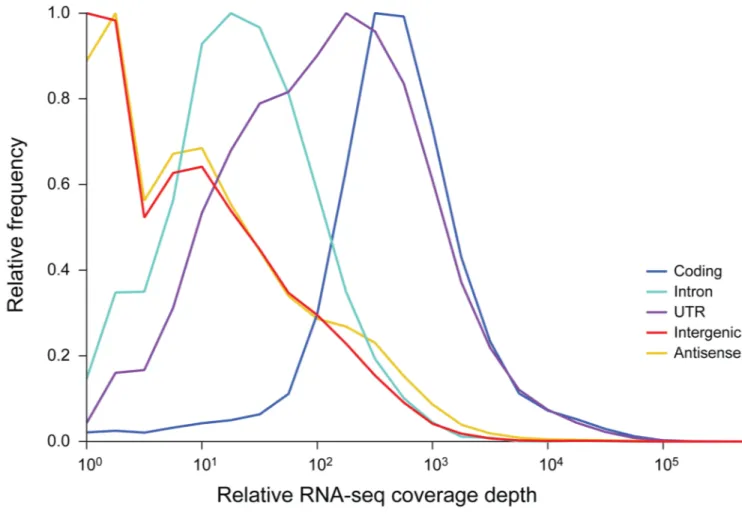
polyA-enriched RNA levels, is associated with well-defined transcripts, most of which are protein coding. Specifically, 37% of intergenic nucleotides (between the UTRs of annotated protein coding transcripts) are not detectibly expressed and 90% of transcribed intergenic nucleotides account for only 0.16% of the polyA-enriched transcript signal. Moreover, the median expression level of exonic sequence (99.1% of which are detectably expressed) is 305-fold higher than that of intergenic sequence (Fig. 2, Table S11), with intergenic transcription enriched within origins of DNA replication (Fig. S16) – gene-free loci with nucleosome-free regions (27–29) that may provide permissive loci for ectopic
transcriptional initiation (30).
Transcription of coding genes is heavily biased to the sense strand. Of coding genes, 73% have less than 5% of their RNA-Seq reads on the antisense strand. Genes with more than 5% antisense reads are enriched for convergent transcripts with intergenic distances of less than 200 bp (p < 10−8, hypergeometric test), but not with those of greater than 200 bp (p > 0.1), suggesting that much antisense transcription is due to read through of 3'-termination sites (31) (Fig. S17). Thus, stable transcripts in fission yeast genomes are primarily associated with known transcription units. We discuss notable exceptions below.
Conservation of gene content and structure
Despite the evolutionary breadth of the fission-yeast clade, as measured by amino-acid divergence, their gene content and structure are remarkably conserved. Of ~5000 coding genes in fission yeast species, 4218 are 1:1:1:1 orthologs across the clade, with the remainder of the orthologous groups containing genes that have been duplicated or deleted since their last common ancestor (Tables 3, S12). Protein kinases are even more conserved in gene content; 93% (102/110) of S. pombe protein kinases are 1:1:1:1 orthologs (4). Moreover, of 3601 S. pombe introns in 2616 spliced 1:1:1:1 orthologs, 2901 (81%) are identical across the four species (Table S13). The majority of changes are due to the gain of species- and clade-specific genes (Table S12, S14) (4). Overall, the conservation of gene content, gene order and gene structure within Schizosaccharomyces is higher than expected given the level of amino acid divergence. From amino acid divergence, we estimate that the fission yeast clade arose about 250 million years ago (Fig. S3). However, the conservation of gene content is significantly higher than that within Saccharomyces or Kluveromyces, both of which have much lower amino acid divergence (Table S15), suggesting that fission yeast amino acid sequences are evolving anomalously quickly, or that genome structures are unusually stable.
The majority of gene changes are due to the gain of species- and clade-specific genes (Table S12). We tested whether gene gain is due to rapid divergence of orthologous genes by looking for co-linearity in regions with species-specific genes, and examined these regions for signs of sequence similarity. We found that 94/317 S. pombe-specific genes are in the same position relative to neighboring genes as genes specific to other species (Table S16). Of these, 9 show greater than 15% identity to a cognate gene in another species, suggesting that they are rapidly diverged orthologs (4).
We also found 34 S. pombe candidates for horizontal gene transfer from bacteria, including two published examples (4, 32, 33) (Table S17), and similar numbers in the other species. Of these, 16 appear to have occurred before the radiation of the clade, and 9 appear to be specific to S. pombe.
Evidence for intergenic and antisense non-coding transcripts
We identified 1097 putative transcript models in S. pombe supported by strand-specific RNA-Seq data but containing no obvious coding capacity and having no correspondence to
NIH-PA Author Manuscript
NIH-PA Author Manuscript
well-defined non-coding RNAs (22, 24, 34) (Fig. S18, Tables 2, S18, S19). Of these potential ncRNAs, 449 are intergenic and 648 are antisense, overlapping a coding gene on the other strand by at least 30%. 213 of the ncRNAs overlap an annotated UTR on the same strand, suggesting that they may be alternative UTRs. Nevertheless, the data support 338 of the intergenic and 546 of the antisense ncRNAs as distinct transcripts (4).
Of the 338 distinct intergenic ncRNAs in S. pombe, 138 are conserved in location in at least one other species (Table 41). Moreover, 26 of the intergenic ncRNAs are conserved in sequence and of these, 9 are conserved in both location and sequence, suggesting they represent potentially biologically important noncoding RNAs. The transcripts that are conserved in location but not in sequence may represent functional transcripts that have diverged beyond recognition. Of the antisense transcripts, 328 (51%) are conserved across two or more genomes (Table S20), suggesting that they are biologically significant (35).
Antisense regulation of meiotic transcription
Across fission yeast, the ~250 genes with greater antisense transcription than sense transcription (Table S21) are significantly enriched for meiotic genes (p = 10−10 for S. pombe, hypergeometric test) (Fig. 3, S19, Table S22, S23), consistent with observations in S. pombe and S. cerevisiae (24, 35). Several antisense-transcribed genes have been proposed to be regulated by intron retention (36, 37), however these studies did not use strand-specific approaches, making it impossible to distinguish unspliced sense transcripts from antisense transcripts. We find no evidence of alternative splicing of any of these genes.
Antisense transcription of meiotic genes does not uniformly decrease as cognate sense transcription increases during meiosis (Fig. S20). This observation suggests that antisense transcription does not inhibit sense transcription, in contrast to the anti-correlation observed in S. cerevisiae (30, 35). Furthermore, meiotic genes are not enriched among genes with greater than 5% antisense transcription but less than 100% antisense transcription (p = 0.47, hypergeometric test), consistent with a stoichiometric mechanism of regulation in which antisense transcripts directly bind to and inhibit the stability or translation of sense transcripts.
Global conservation of expression programs within fission yeasts
To identify conserved modules of co-expressed genes, we examined expression patterns across the four conditions and between the four fission yeast with phylogenic clustering (Fig. 4). We found that patterns of gene expression between species grown in similar conditions are generally conserved, with dominant patterns associated with growth (log and heat shock) and stress (glucose depletion and early stationary phase). Moreover, similar expression clusters are enriched for similar gene annotations across the species. Fission yeast up regulate genes involved in mitosis, including those involved in the kinetocore, the spindle pole body and the anaphase-promoting complex, in response to glucose depletion (Table S24). In contrast, several classes of genes involved in growth are down regulated (4). None of these genes is significantly regulated in glucose depletion in S. cerevisiae (38).
cis-regulatory mechanisms are associated with novel and expanded
functions
Promoter motifs with conserved regulatory function across Ascomycota show new
functionality among the Schizosaccharomyces. For example, the motif bound by Rtg3 in S. cerevisiae is associated with amino acid metabolism genes across the phylum. In fission
NIH-PA Author Manuscript
NIH-PA Author Manuscript
yeast however, it is also enriched in genes responsive to various stress responses (Fig. 5A). Of the stress genes that have Rtg3 motifs in S. pombe, 36% are found only in the
Schizosaccharomyces clade, and many are also associated with the Atf1 motif, a conserved regulator of the stress response (Fig. 5B). Rtg3 does not have a detectable ortholog in the Schizosaccharomyces clade (39), but the motif recognized by Rtg3 in S. cerevisiae is clearly identifiable in fission yeast, suggesting that these regulatory motifs are more conserved than their binding proteins. We also found a similar acquisition of Schizosaccharomyces-specific genes by the Fkh1- and MBF-associated motifs, which regulate meiotic transcription in S. pombe (4, 40, 41). In particular, these two motifs were enriched in genes with antisense transcripts (Figure 5C). Most of the Fkh1/Mei4 target genes with antisense transcripts (80%, 47 genes) are meiotic genes, the majority of which are specific to the Schizosaccharomyces clade (Figure 5C).
Gene content reflects glucose-dependent lifestyle
Fission yeast and budding yeast of the Saccharomyces clade independently evolved the ability to produce ethanol by aerobic fermentation (3, 42). In contrast to the convergent evolution of ethanol production, the utilization of ethanol has not converged; although budding yeast can efficiently catabolize ethanol, fission yeast cannot use ethanol as a primary carbon source. The evolution of aerobic fermentation in budding yeast involved changes in gene content, most notably following a whole genome duplication (WGD) event, and in regulatory mechanisms of glucose repression (3, 43).
Like budding yeast, fission yeast have duplicate copies of the pyruvate decarboxylase (pdc) gene, needed to funnel pyruvate to fermentation. They also have orthologs of several activators and repressors of respiratory genes, including Hap2/3/4/5 complex members, the Adr1, Tup and Mig transcriptional regulators, and the Snf1-Sip1/2 kinase (3). However, there are substantial distinctions in gene content between fission yeast and the post-WGD budding yeast (Fig. S21). We identified loss of the glyoxylate cycle, loss of the glycogen biosynthesis, fewer glycolytic paralogs, loss of the gluconeogenic enzyme
phosphoenolpyruvate carboxykinase, lack of expanded adh genes, and lack of
transcriptional regulators of glucose repression as differences that illuminate the distinct metabolic capacities of fission yeast (4). All of these adaptations are consistent with the inability of fission yeast to consume ethanol as a sole carbon source. The loss of conserved enzymes highlights how fission yeast came to depend solely on glucose.
In both fission yeast and budding yeast, as glucose is depleted the expression of respiratory genes (oxidative phosphorylation enzymes, TCA cycle) is induced. However, unlike S. cerevisiae (38), in fission yeast the expression of the genes encoding the pyruvate
dehydrogenase complex and adh1 are reduced, preventing the efficient use of pyruvate for respiration. Instead, the expression of the ald genes is induced, which may provide an alternative mechanism for generating acetyl-coA in fission yeast.
Thus, the lack of efficient ethanol catabolism by fission yeast demonstrates that aerobic fermentation did not evolve to create a consumable by-product. Instead, ethanol is a waste product, possibly produced because it is toxic to competing micro-organisms. Interestingly, aerobic fermentation appears to have evolved as early as 200 million years ago in fission yeast (Fig. S3), long before the WGD and subsequent evolution of aerobic fermentation in budding yeast.
Conclusions
Our comparative analysis of genome structure and expression in the fission yeast, especially the analysis of centromere structure and evolution, demonstrates how chromosomal features
NIH-PA Author Manuscript
NIH-PA Author Manuscript
can be rearranged while retaining function and maintaining stable positions across taxa. We also provide insight into centromeric biology and elucidate conserved antisense transcription that may play a systematic role in meiotic gene regulation. Lastly this study informs on the major evolutionary innovation of aerobic alcohol fermentation in microbial metabolism that arose in parallel in the fission yeast and budding yeast lineages. As these results
demonstrate, comparative analyses improve the power of fission yeast as a model for eukaryotic biology.
Supplementary Material
Refer to Web version on PubMed Central for supplementary material.
References and Notes
1. Forsburg SL. Trends Genet. 1999; 15:340. [PubMed: 10461200] 2. Wood V, et al. Nature. 2002; 415:871. [PubMed: 11859360]
3. Flores CL, Rodriguez C, Petit T, Gancedo C. FEMS Microbiol Rev. 2000; 24:507. [PubMed: 10978549]
4. see Supplemental Online Material
5. Leonardi J, Box JA, Bunch JT, Baumann P. Nat Struct Mol Biol. 2008; 15:26. [PubMed: 18157152] 6. Wong LH, Choo KH. Trends Genet. 2004; 20:611. [PubMed: 15522456]
7. Cam HP, Noma K, Ebina H, Levin HL, Grewal SI. Nature. 2008; 451:431. [PubMed: 18094683] 8. Zaratiegui M, et al. Nature. 2010
9. Casola C, Hucks D, Feschotte C. Mol Biol Evol. 2008; 25:29. [PubMed: 17940212] 10. Grewal SI, Klar AJ. Genetics. 1997; 146:1221. [PubMed: 9258669]
11. Fishel B, Amstutz H, Baum M, Carbon J, Clarke L. Mol Cell Biol. 1988; 8:754. [PubMed: 2832735]
12. Ishii K, et al. Science. 2008; 321:1088. [PubMed: 18719285] 13. Grewal SI. Curr Opin Genet Dev. 2010; 20:134. [PubMed: 20207534] 14. Volpe TA, et al. Science. 2002; 297:1833. [PubMed: 12193640] 15. Beach DH. Nature. 1983; 305:682.
16. Egel R. Curr Genet. 1984; 8:205.
17. Vengrova S, Dalgaard JZ. Genes Dev. 2004; 18:794. [PubMed: 15059961]
18. Sayrac S, Vengrova S, Godfrey EL, Dalgaard JZ. PLoS Genet. 2011; 7:e1001328. [PubMed: 21423720]
19. Kelly M, Burke J, Smith M, Klar A, Beach D. EMBO J. 1988; 7:1537. [PubMed: 2900761] 20. Arcangioli B, Klar AJ. EMBO J. 1991; 10:3025. [PubMed: 1915277]
21. Singh G, Klar AJ. Genetics. 2002; 162:591. [PubMed: 12399374] 22. Wilhelm BT, et al. Nature. 2008; 453:1239. [PubMed: 18488015] 23. Levin JZ, et al. Nat Methods. 2010; 7:709. [PubMed: 20711195] 24. Ni T, et al. PLoS One. 2010; 5:e15271. [PubMed: 21187966] 25. Lin MF, Jungreis I, Kellis M. Nature Precedings. 2010
26. Kaufer NF, Potashkin J. Nucleic Acids Res. 2000; 28:3003. [PubMed: 10931913] 27. Gomez M, Antequera F. EMBO J. 1999; 18:5683. [PubMed: 10523311]
28. Eaton ML, Galani K, Kang S, Bell SP, Macalpine DM. Genes Dev. 2010; 24:748. [PubMed: 20351051]
29. Lantermann AB, et al. Nat Struct Mol Biol. 2010; 17:251. [PubMed: 20118936] 30. Xu Z, et al. Nature. 2009; 457:1033. [PubMed: 19169243]
31. Zofall M, et al. Nature. 2009; 461:419. [PubMed: 19693008]
32. Matsuzawa T, et al. Appl Microbiol Biotechnol. 2010; 87:715. [PubMed: 20396879]
NIH-PA Author Manuscript
NIH-PA Author Manuscript
33. Uo T, Yoshimura T, Tanaka N, Takegawa K, Esaki N. J Bacteriol. 2001; 183:2226. [PubMed: 11244061]
34. Dutrow N, et al. Nat Genet. 2008; 40:977. [PubMed: 18641648] 35. Yassour M, et al. Genome Biol. 2010; 11:R87. [PubMed: 20796282] 36. Moldon A, et al. Nature. 2008; 455:997. [PubMed: 18815595]
37. Averbeck N, Sunder S, Sample N, Wise JA, Leatherwood J. Mol Cell. 2005; 18:491. [PubMed: 15893732]
38. DeRisi JL, Iyer VR, Brown PO. Science. 1997; 278:680. [PubMed: 9381177]
39. Wapinski I, Pfeffer A, Friedman N, Regev A. Nature. 2007; 449:54. [PubMed: 17805289] 40. Lowndes NF, McInerny CJ, Johnson AL, Fantes PA, Johnston LH. Nature. 1992; 355:449.
[PubMed: 1734281]
41. Abe H, Shimoda C. Genetics. 2000; 154:1497. [PubMed: 10747048]
42. Piskur J, Rozpedowska E, Polakova S, Merico A, Compagno C. Trends Genet. 2006; 22:183. [PubMed: 16499989]
43. Kellis M, Patterson N, Endrizzi M, Birren B, Lander ES. Nature. 2003; 423:241. [PubMed: 12748633]
44. Mata J, Lyne R, Burns G, Bahler J. Nat Genet. 2002; 32:143. [PubMed: 12161753] 45. Assemblies and annotations are available at GenBank (S. octosporus: ABHY04000000, S.
cryophilus: ACQJ02000000, S. japonicus: AATM02000000), the Broad Institute Schizosaccharomyces website
<http://www.broadinstitute.org/annotation/genome/schizosaccharomyces_group>, which provides search and visualization tools and pomBase <http://www.pombase.org>. The RNA-Seq and SNP data are at the NCBI SRA (see Table S42). The S. japonicus siRNA datasets are at NCBI GEO as GSE26902 and GSE27837. This work was supported by NHGRI. C.N. and M.F.L. were supported by NHGRI; M.Y. was supported by a Clore Fellowship; I.W. is the HHMI fellow of the Damon Runyon Cancer Research Foundation; S.R. was supported by NSF; R.M. was supported by NIH; K.H. was supported by DRC; C.A.N and C.A.M were supported by BBSRC; P.B. was supported by the Stowers Institute and HHMI; Y.G. and H.L. were supported by NICHD; M.K was
supported by the NIH, an NSF CAREER award, and the Sloan Foundation; A.R. was supported by HFSP, a Career Award at the Scientific Interface from the Burroughs Wellcome Fund, the Sloan Foundation, an NIH Director's PIONEER award and HHMI. We thank the Broad Institute Sequencing Platform, A. Fujiyama and A. Toyoda for generating DNA sequence, M. Lara and N. Stange-Thomann for developing molecular biology protocols, J. Robinson, M. Garber, P. Muller for technical advice and support, A. Klar for providing S. pombe var kambucha (SPK1820), L. Gaffney for assistance with the figures, K. Mar and J. Mwangi for administrative support, and C. Cuomo for comments on the manuscript.
NIH-PA Author Manuscript
NIH-PA Author Manuscript
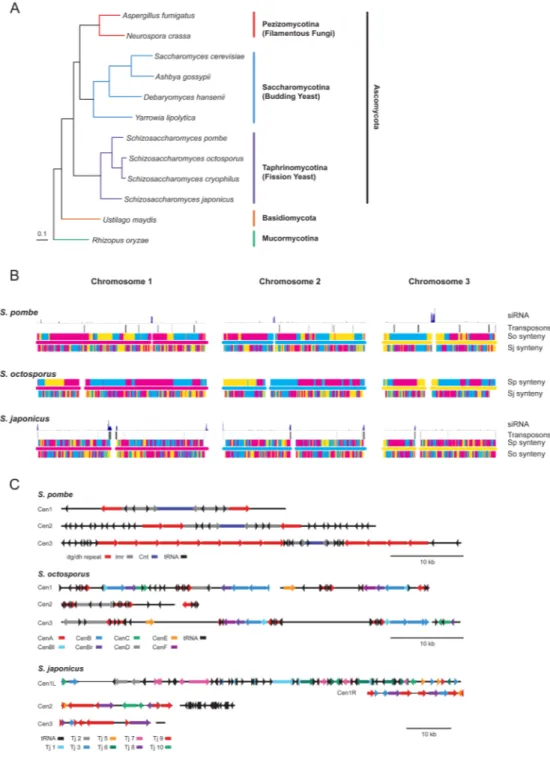
Figure 1. Schizosaccharomyces phylogeny and chromosome structure
A) A maximum-likelihood phylogeny of 12 fungal species from 440 core orthologs (each occurring once in each of the genomes) from fly to yeast. A maximum-parsimony analysis produces the same topology. Both approaches have 100% bootstrap support for all nodes. B) The chromosome structure of S. pombe, S. octosporus and S. japonicus. The middle bar in each figure represents the chromosome and its centromere: red for Chromosome 1, blue for Chromosome 2 and yellow for Chromosome 3. Above and below each chromosome are depicted the chromosomes in the other two species to which the genes on the chromosome of interest map, using the same color scheme. Above the S. pombe and S. japonicus chromosomes are depicted the distributions of transposons and mapping of siRNAs. S.
NIH-PA Author Manuscript
NIH-PA Author Manuscript
cryophilus is not included because its genome has not been assembled into complete chromosomes.
C) The centromeric repeat structures of S. pombe, S. octosporus and S. japonicus.
NIH-PA Author Manuscript
NIH-PA Author Manuscript
Figure 2. Polyadenylated transcription is predominantly confined to protein coding genes
The S. pombe genome was divided in to five different feature classes: protein coding sequence, intron sequence, untranslated sequence (5' and 3' UTRs) and intergenic sequence (all nucleotides between UTRs of protein coding genes). The frequency of RNA-Seq reads was calculated over sequential 20 bp windows across these features; for coding sequence, the frequency of antisense reads was also calculated. Frequency was normalized to the maximum frequency within each feature class to compensate for the different class sizes.
NIH-PA Author Manuscript
NIH-PA Author Manuscript
Figure 3. Meiotic genes are subject to antisense transcription
A) Examples of antisense transcription of meiotic genes. Above and below the chromosome coordinates are the coding sequence annotations on the top and bottom strand, respectively. Above and below these are the strand-specific RNA-Seq read densities on a 0–300 scale; signal above 300 is truncated to make the low amplitude signal visible.
B) Enrichment of GO annotations within the set of protein-coding genes with more antisense than sense transcription. All terms with a p value of less than .01 are included, except for high-level terms (i.e. biological process and molecular function).
NIH-PA Author Manuscript
NIH-PA Author Manuscript
Figure 4. Expression profiles cluster into similar patterns with conserved biological functions
A) Expression clusters for each species. Gene expression profiles for each species were clustered (4). The size of each heat map is proportional to the number of genes in the cluster and the number of genes in each is indicated. Similar cluster sizes and patterns reflect similar expression patterns between the species. The heat-shock transcription profile is similar to log-phase growth because the transcriptional response on the 15-minute timescale used here is limited to a relatively small number of genes.
B) A selection of enriched GO terms for each cluster. The color intensity is proportional to the negative logarithm of the hyper-geometric p-value enrichment on a continuous scale of 0–10. Complete GO term enrichments are shown in Table S26.
NIH-PA Author Manuscript
NIH-PA Author Manuscript
Figure 5. Conserved regulatory motifs have acquired new functions and new target genes
A) The enrichment of gene functional modules regulated by the Rtg3-biding motif in 23 Ascomycota. This motif is enriched upstream of amino acid metabolism genes in all Ascomycota. However, in fission yeast, it is specifically enriched upstream of stress-response genes. S. cerevisiae (Scer), S. paradoxus (Spar), S. mikatae (Smik), S. bayanus (Sbay), C. glabrata (Cgla), S. castellii (Scas), K. waltii (Kwal), A. gossypii (Agos), K. lactis (Klac), S. kluyveri (Sklu), D. hansenii (Dhan), C. guilliermondii (Cgui), C. lusitaniae (Clus), C. albicans (Calb), C. tropicalis (Ctro), C. parapsilosis (Cpar), C. elongosporus (Celo), Y. lipolytica (Ylip), N. crassa (Ncra), A. nidulans (Anid), S. japonicus (Sjap), S. octosporus (Soct), S. pombe (Spom)
B) Enrichment of Rtg3- and Aft1-binding sites in the promoters of stress response genes. Each row represents a gene. The strength of the strongest regulatory site upstream of the gene is indicated in the blue heat map. The expression of the gene in glucose depletion (gd) and early-stationery phase (es) relative to log phase is indicated in the blue-yellow heat map. Genes specific to the fission yeast clade are indicated in orange.
C) Enrichment of Fkh2/Mei4- and MBF-binding sites in front of antisense-transcribed genes. As in B, but each row represents a gene with greater antisense than sense transcription. Gene associated with meiosis (44) are indicated in magenta.
NIH-PA Author Manuscript
NIH-PA Author Manuscript
NIH-PA Author Manuscript
NIH-PA Author Manuscript
NIH-PA Author Manuscript
Table 1
Conservation of gene content and structure
Orthologous groups Introns same gain loss dup same gain loss S. pombe 4218 321 83 23 2901 297 27 S. octosporus 4218 133 48 5 2901 25 8 S. cryophilus 4218 283 73 11 2901 75 4 Ancestor of Soct and Scry 4218 103 44 15 2901 396 0 Ancestor of Spom, Soct and Scry 4218 339 159 29 2901 415 412 S. japonicus 4218 242 0 18 2901 708 214 Ancestor of Schizosaccharomyces 640 745 Total 2061 1152 101 1916 665