Determination of Martian Surface Reflectivity
From 0.4 to 1.1 Micron Using a Vidicon Spectrometer
by
Douglas John Mink
Submitted in Partial Fulfillment of the Requirements for the Degree of Master of Science
at the
Massachusetts Institute of Technology May, 1974
/ U ' Z -. vr
Department of Ejrth n Planetary Sciences, May 20, 1974 Cer t i f ied by: -w W-9
Accepted by:
Chairman, Departmental Commi ttee on Graduate Students
WITHDRN
MITLibraries
Document Services
Room 14-0551 77 Massachusetts Avenue Cambridge, MA 02139 Ph: 617.253.5668 Fax: 617.253.1690 Email: docs@mit.edu http://libraries.mit.edu/docsDISCLAIMER OF QUALITY
Due to the condition of the
original material, there are unavoidable
flaws in
this
reproduction.
We
have made every effort possible to
provide you with the
best copy
available. If you are dissatisfied with
this product and find it unusable, please contact Document Services as
soon as possible.
Thank you.
Some pages in the original document contain pictures,
graphics, or text that is illegible.
pag .
Determination of Martian Surface Reflectivity from 0.4 to 1.1 Micron Using a Vidicon Spectrometer
by
Douglas John Mink
Submitted to the Department of Earth and Planetary Science in part-ia.I fulfillment of the requirements for the degree of
Master of Science on May 23, 1974
ABSTRACT
A new astronomical instrument, the vidicon spectrometer,. is being developed at the M.I.T. Planetary Astronomy Laboratory. Based on the silicon diode vidicon system currently in use there, a low dispersion prism is added between the vidicon image tube and
the telescope, allowing digital vidicon photographs to he taken df spectra. These spectra are stored on magnetic tape and computer processed to create intensity vs. wavelength curves for stars -Ind planets. The high spatial resolution of the vidicon imagle tubte, combined with
a
higher spectral resolution than photometer fil ters currently -in use at M.I.T. give this instrument potent ial in the study of planetary surface composition from spectral ref lectivitt.. Procedures for reducing the vidicon images to spectra have bf'entested on a set of spectra of tio stars and the planet Mlars. It is concluded that the viclicon response is not linear enough wi th variations In exposure time at lot, levels of incoming light for consistent star spectra. although it works well with Mars clue to the planet's larger intensity where the vidicon tube has i ts poorest response. The spectrometer slit is so narrow (one seconr of arc for this data) that uaveleng.th-dependent var iations in refraction of light from a point source by the atmosphere .caw1r'e
,tar spectra of variable clualitl. Because of the lou quality of the star spectra. direct spectral rrflectivity measurenwnts (which are obtained using Mars to star ratios) proved to be impossible. Although further tests of the spectral and intensi ty response of
the silicon dinde Vidicon should be carried out in the laboratory before good results can be gua-anteed, the presont Mars spectra may probably be used in conjunction With photometer-derived reflectivity data to expand coverage of the surface of Mars.
Thesis Advisor: 'Thomas B. McCord
page 3
Acknowledgements
Numerous people were involved in the design and construction of the.vidicon spectrometer, although I have only met a few.
Professor Thomas B. McCord, Mr. Jeffrey Bosel, and Ms. Carle Pieters have been informative about the design of the hardware, as well as the conditions under which they obtained the Mauna Kea data. Dr. Robert Huguenin lent his insight into the problems of Martian surface composition, as well as criticizing an early draft of this thesis. Stevp Kent, who i4 also working with the
spectrometer, provided criticism and astronomical knowledge. My spouse. Catherine, has greatly aided me financially' and morally. while David McOonald greatly expedited the production of this
pag' 4
Table of Contents
I. Introduction
II. The Vidicon
Spectrometer-111.
Image
Processing
IV. Anal-ysis of Data
V. Recommendat ions for Future Use
page 50
page 5
page 9
page
16
page 5
1. Introduction
Although Mariner 9 has returned a vast quantity of information about the planet Mars,~ little was learned about surfsce composition. From such experiments as the infrared spectrometer., particle size and silica composition were estimated, but these. determinations had error bars so great as to be nearly useless In reaching conclusions about the composition of the surface materialso-f rars. Until the Viking Lander in 1976, there
is no way to physically look at a Martian rock with instruments. Probably the moot useful technique for remotely sensing surface composition is reflectance spectroscopy. Dollfus (1961), studying the polarization of light reflected by Mars , concluded
that limonite, a hydratdd iron oxide, was probably a major constituent. Hovis (1365) observed absorption bands in the
near-infrared reflectivity of limonite and suggested that they would be a diagnostic test for limonite on Mars. Sagan et al (1365) compared absorption pands they observed in laboratory specimens of
lisonite to Dollfus' Martian albedo curves and concluded that a surface with at least some limonite was not inconsistent with the data. Adams (1968) observed absorption bands between 0.5 and 2.5 microns in many iron-bearing minerals, the positions of which varied significantly from mineral to mineral. These bands are caused by electron transitions in iron ions and by vibrational bands i.n hydroxyl iokns and water molecules. Adams suggests that
page G
the absorption feature observed in Tull's (1966) geometric albedo curve is not inconsistent with a hydrated basalt composi tion. The feature observed at one micron in their spectra is not due to iron in iron oxides, but to iron ions in silicates. Adams anrd McCnrd (1969), using geometric albedoes obtained during the 0i;7
opposition discovered that curves for the bright aras ihad different shapes than those from the dark areas of the Mar ti:in
surface. They concluded that the surface was conposed of a combination of oxidized basalt and hydrated iron oxides. The bright and dark areas were modelled as being composed of of the
same.material in different degrees of oxidation.
McCord and Westphal (1971, see also McCord, Elias, and Westphal, 1971) observed Mars during the 1969 opposition and noted that the iron ion absQrp-tions were in different places, indicating compositional differences. Seven areas were observed, four dark and three bright, each being about five Martian longitudinal degrees in diameter. From this data, much compositional analysis has been. done (see Figure I for examples of mineral ref lectivities compared to Mars); however, from such a small sample, generalizations about the rest of the surface cannot be made. Despite over twenty additional spots obtained during the 1973 opposition, such interesting features as the Coprates canyon and the Hellas basin remain uncovered; what is needed is tihole disk coverage at higk $pectral and spatial resolution, A new technique, vidicon spectroscopy, has been developed to obtain the
MOAB . - I tI li-1.00 --0.00 0.3 0.5 11 WAVELENGTH (p) -j .4. Cr. 01-wI N3 *-*0 ) J 0- 5 4w 0 z ARABIA .. -S10J '003 0.5 .O WAVELENGTH (p) AREA 59/74 ~ -
iiIfifif
1.00-0.00 1 L t -1 0.3 05 WAVELENGTH (p) ) ' 1.5 WAVELENGTH (Mm)Figure 1.
Comparison of Mars
dark area reflectivity
to reflectivity of sheet
silicates. Note
resem-blance to the clay
mine-rals, kaolinite and
mont-morillonite.
(Courtesy Dr.Robert
Huguenin)
-j U-0 zpage 7
page 8
desired high resolution ful -disk coverage. This thesis describes that technique.
page 3
11. The Vidicon Spectrometer
The silicon diode array vidicon *was originally developed for television and picturephone use, but because of its large dynamic range, high quantum efficiency, and linear response, it is being used by a growing number of astronomers as a digital replacement for photographic plates. The only advantage a photographic plate has over a vidicon is spatial resolution; however, that is not a limiting factor as atmospheric conditions are the resolution-limiting factor in astronomy. McCord and Westphal (1972), Kunin (1972), and McCord and Bosel (1973) have reported on the
development of a vidicon system for single-frame astronomical photography at the Planetary Astronomy Laboratory of the Massachusetts Institute of Technology (MITPAL). This system is based on an RCA silicon vidicon tube with a peak quantum
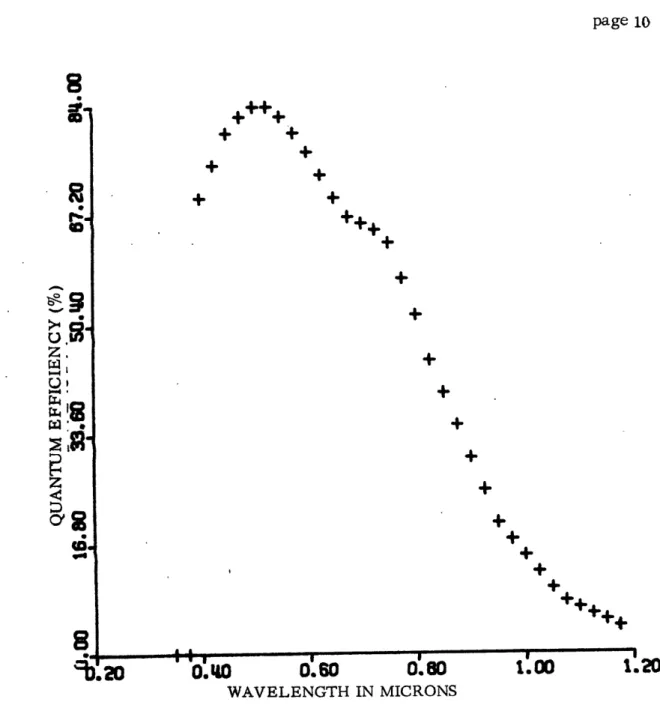
efficiency of 85% at 6.5 microns, sloping off to about 6% at 1.1 microns (see Figure 2). Using filters this system has been developed as a two-dimensional imaging photometer, using filter sets similar to those used with photometers for spectral reflectivity work at MIT. As reported by McCord and Bosel, a vidicon spectrometer which w
the vidicon combined' with a
a vidicon photometer is under
The vidicon spectrometer
is attached to the front
telescope.
Schematically it
ould give the spatial resolution of greater spectral resolution than such
development.
is basically an optical syctem which end of the vidicon system on the
page 10
20
0.~~4.4
+
+
.
6008
.012
>4.
WAVELENGTH IN MICRONS
Figu re 2.
Quantum
efficiency of the RCA vidicon.
This is the percentage of incoming photons which
the diode array and affect it as opposed to being
reflected or passing through without being absorbed.
This graph was made by averaging the published
.
page
11
through 'hich 'light
telescope is
passed.
refocused onto the
practice this is
done
from a slit situatec The dispersed image surface of the vidi
through a system of
I
at
the focus
of the
of the
slit
is then
con diode array. In
mirrors (see Figure 3
ls) to avoid the infrared absorpt
vidicon tube consists of a 1024
biased diodes. A photon impinging on thein
a decrease
in charge
i
read out by scanning the di
recharges the diodes as
proportional to the amount
beam is at any given time,
diode array
'can
be known.
passed on to be recorded anelectronics of a silicon v
n the diode ode array it hits of charge I the inten it wi th them os t. si ty ion ofby
1024
vidico reachean ele
prodBy k
at eac
lenses. array of revereaen target resul'ts
s. The
image is
ctron beam which ucing a current nowing where theh location in the
These intensity elementsd displayed (for further detai idicon see Crowell and Labuda
are then Is on the (1363)). The vidicon is read out as 250 rows of 256 image elements, each of
which
corresponds
physically
to
four diodes.
In such a
loier
resolution scan, less accurate positioning is required of theelectron beam.
No
data
is lost, and the vidicon's resolution
is
still better than the atmosphere allows. The intensity image is
amplified, recorded on magnetic tape, and displayed on a slow scan
TV monitor. This image is then available for further computer processing. The spectrometer system is diagrammed in Figure 4.
A portion of a vidicon spectrometer image is presented in Figure 5. The elements along the column correspond to spatial
for detai The
page 12
CAMERA
image is
in focus
BAFFLES
SPHERICAL
MIRROR
BAFFLES
VIDICON '
Figure 3.
LOW
DISPERSION
PRISM
image is
in focus
here
Optics of the MITPAL vidicon spectrometer.
The telescope is to the right.
page 14
elements along the slit. Wavelength is along the abscissa. The magnitude of each element is proportional to the current from the vidicon diode array at the time a corresponding diode uas read by
the scanning electron beam. The image is now ready to be turnerd into a spectrum.
6
f
U 1800~B~~t lISs 0Z muloo 19owI1l a1fl uT 119so Iloquwuoq
SUflX 31esjyq jo
aftwT
IaitUozaaadS
uo3TpTA alo JOuopxod
v
0qginx
911 se1 II 891 911 U11 bAi '981 811 611 LOT ZII II1 SIT ZI 181 081 91 11 4il 161 1 til 1 -LI I i M1 I -9 09T~T7T7T~LTL1~9T~T 91 ~40~~61 -TT6T 761~r6T~6-T~96 ~-061~7671 6T~ 1 R~T 161 -5-sT -r Q61 CD? ?Z t0? 907 10? ZI (1? vi1? 17 LI 7? Z Orz Wk 1te 1e SU il? M11? ?. 4. e 1/ 114 '#1_ -1 4z VU 0S7 Zzi i z4 -4 trd6 % 194 Ve 162 _9? 112 1 [62 V2 9 917~ 11. M* L1 -69? ?tZ 68Z C0% 41 LOt LEE 15E 19E 49t 5 11 S91 91f t F Aft. c t u it 411' "4091111 "1 t99 IOU s'L 4f -I C 9Q 2 1 ~I V~~6C -6C~~6 I ~19 41-- ~~ 9 ~b C 6 6I5 ~ T 1T T! I1~~ ~ 1 -!J- h 6 7of;i LtA : 1f. t z2 994 2** 61S Z2S 0 9s 9 09 9F9 099 t19 99 s69 669 169 '69 301 911. Ili P6i li f.# ' tw f ' /19 ' *)', 21S 0I '(E19 ~11[ -1~ ~1 -951 ~ '079 T'l" 499 ~69 b1T6 ,6:6 6&LE6 '054 ~9;6-~ 146 T7' It1 I6 M ZMi 3 - 4-62a tva q69 tab 16M. ?0i1 T101 0611 89?1 10 1 >1 f)ot At It I Gh!;1 OM1l- GLE1 00o1 Uft1. ';rit if sot ! fi I U*,, I tI If I 4 Mpi I -s. If LF69 I Z6 1 11 OMI 9I F1 ST 10'7fUS91 9":91 Cs L Iw ZIW ib 1611 IL 6491 G llel 01.1 46-M I 12F1 I p Ii I 711 -b96 9l0 1(-11 9L41 U/l 4;1.k1 or41 Z091 1111 69±1 1IP1 91V1 6061 bIb I 6zb LP41 r61 S%61 9761 ,1 1 # 'ki 1" '9 l 11t I I I,:! -lt 9111 1l aidl M i.I 1 9a. 1 6441 1991 1261 10? 107 P112 112 61el0 06?2 '2// I127 (46/? 9677 /21 16/2 vf2 ,'t? f'67 7,1/ , 1 e -v Viet o9.1 066 q191 1691 191 old! s60S 0912 (Z2 e64.? 6/t 14./ U6AI L1si V . ? Z 5 / 9s2 Uo / 1EA /IL It ISIS 1! L . e ' .#." -4 o71 '1641 6'91 T91T i- T -26T'902Z 262-1 Cz~7?(z ?01;zZ 09 r2~42-5,r)s2' 9 Z/7 -OW -6 1, Z'? ;17? I.'Z F 7 C." 01 1.61 L91 101 142 sl461 07 9i 19 1o7 W 99C9 r9 r-7 97 39 f.1r '' ,/ . 7TrrT I';1 *.1f~l I11i Lialtowl st1 uv1io zE0/ 012 IIt 9s,54 i(5d 6094 zs9/ 191/ 1',91 th9? 117 W9l/ 16,1 SI,'9 4199 1$ 7 6 1:'.? $ / if- -,I 6171 9941 L191 1 1i 'iLl 6991 ZC61 6112 COV? 941C /294?9t I.Z 1'j. S 1'za? U17' (12)? Eu91 I, 2 ?vj4? T,,7 1'.? c , v? 507 -bf t621 921 25Z91 Lil1 l V covll SIG? 9b7e Vol? 01341, 915.4 1I52 t29 4994 t19 LlME 4Z? 1'1 Z 99Le 9 1 LL,12/s , 14/ br'' 01, 11e'4 6,1?1 1W61 1s1 9Q01 6wA1 U911 0!mt 102? 6! ? 26fe 6('2 40'52'194 116/ 6I se 2c ',2 1/9? b,/ I ', ci W 1 ? 669 ,.92 f2. 61. ' *4 ' -if ft11 f1f1 901 Z9'1 6f 1 11. 1 '041 0I ,912 6422 ("It 419? /E9/ .41 5r 7 ? (4 9? ,? 'y 47s 61'/ *14/ G9/z 17? IfeV/ I Pt 1. 1/ -1G O961~ -16.T1~T1FT~W1 61 1 TVV1f56 9 669' 1r'T- 1 Z502I~ -'ff2 -1 77-n 7 PT' ' -. R921 6e.Z1 S961 P91 21L1 iill 9941 (.112 5422 411E at1,? I 94? 4244 44t4 01 664? 96',? 1; 7 f(w. 6 7%1 / ni/ 1'07? 1/4' 6,V LA" -jo 0141 C.91 S -7('1 141 110/ I afII d1?? 4eI 11? 604 / S0l91 19921? 446 69t> 13 67 z46? 14')( I901 W'( j 4960 I 1f 6 'v 7 1f 4 / Ild (. -/1 1E41 (It/I 0'1 9r.. I 11 1912 f 01. 119 /6121 f11 216, 1 o? 9f.01 4906 14,(,0 f, U? 4Ili f 61 V s1)$ 0/1* ISu( ( /)? y '( ;jL .I1 ;0 I 9961 1611 es1 901_ 117 9517 SEZ? 9992 004? 6z6? ?,b6. 9401 02IE 6c1 1/1 11E 'WIE 46/ q99f s4uzi P41' 141,1 7 I A -A 0913V i991 9'V1 S202 E107 EL02 q992 CIS? POL? 91V? 69v~e 0962 190E Yo0t 1M0 I10 EI 0 A51 clo t 11 150 I21 f7 7kISf(u fuf (p-.vG -94 1611 L?!.1 1691 5011 6911 0061 11"z t10 2 21 512 64'; 109 Sl.92E/LZ Zile E 8l I ? 91? 0Ube Odif ? 0n 914d I/ ',I/ Oile '*s&/ 41$1 -''1 C(71 I I 19C1 */' 1 I5/l 7411 O0 1 1/17 /? ? 1ff., 4p/'1f 9/ (? 1 Y',? 491.? 9I.I 1.? " 199 1 4 .'.4 I j'i . / .. 'v N..* ./ 5611 4l*1 Z11 1191 &11±! 641 i!6t !AiL 12tz 04 9 1052 /654 19 2 4L %z ale t .1 1 -,,± * .. 1,4r-1 u ' -Z , -P'* -SZ 0±01 9(1Z 19*1 1061_ot'1 0 t-'1 12eT $961 LO0 6L17 912? Il2 4 E917 t V /964? Ve',Z 19/_I,6/ L1 4' -# -'A- I 0?-VI ~~7sM~CfCTLLil,~1T1~o#eii (40 l 92 61A ~6772 iiolQ -i622U-4ie--2 l" dit 1. 7- ' I" uC -. , ,e17 7 =12 -7 f4.1 1611 1111 041 41 6941 p191 111 L/61 100e 5102 671Z 511? 100Z 461 681? 57'i? E(01 Z11? "LIZ 1/24 ZU 1 '.'? kt '// Li'W -Zl %601 ivll Wf 1641 6SI6 i9'.1 90L1 261 L40? Li214 1022 59/7 441 9s6t 0917c1 6E2 IN* 66e / o1.4/ t4/ve 11 v k6E tit I? c41. LI? -l/ Ptlt b621 LZV1 Z491 tUS1 6191 0521 9961 211 LU0/ IL2 V0k2 ILE? L61 00t4 I0i92 Ont4/ e tit 4 e I4 11II? 01^z 42 I (1 G4 6.It- -9I 9E11 6(ll 591~51~L9f- L~9.1 '9911 61~01 ~4122~ L6 Z LI'? 6442 L444 Eit261.4? 1462 L964 -/ L 4 , c1/ Cvz IL"? S24 -61 1111 1621 b4 9%1 S?91 W91 l 110 SRI 9?2 1 654 484? 154/ VB49 0467 .1191 SZ91 4*s09 0l44 IU'? 2i r? 41 2 1 : 7/ -"1 F 6%~ 0 6 &li.2 6~451 isi I'. "991 ±961 1LZ!6 014 0962 L1'2 6IYS 24/ 6'97 6962 1.9e/ 02/ O3 c/'.tL 1 -1 59 S0 P 6 5101 2011 S911 T11E1 951 1111 618191 Usti 910? 040? A401 W407 660? 2LI_ 1611 6112 L4IC 9/1/ 1!? 611? 647 -9! L141 Li" Sf, 15 69 84 -6'f 949 61 tL f CI tL401 __ 661 G(1 .41 Z41 61 6,1119 81.971 11? UZ! E4 jI tit L4 SLIE 161 604 li t1 (75 ?LS 165 419 149 649 69 459 096 6S9 51'9 ZA9 f- 99 L%9 L1210 . 1/41 LIP -.1 -9z 64z ~i9 L61 e61 Z9Z 0E Z4 Z 54 919 90~ 5ES ~66 LW~If6 ELS 109 CW~~129 019 5z9 91- 11, '/96 o -l -922 9?? IF? 0? Z 4% Z 4? 952? CL? 48? 001 6? 66/ 111 L? ZT* 517 SE f. 4( ( L, 41i 44t I' m * cf( 4; 1E .-/) 00? 60? 661 161 50? 10 60Z 602 90? 61? ~2 O 04 0 21? ~6%z ~1 661 b32 /0? 661 b2 iz / ' 6 ItU -11 461 "41 b8 s81 1e1 E81 ±91 091 tLI Al1 2L1 091 11 tLl 9t1 ±15 0L1 91 .9I EA1 etI S9! 1 1 191 4;!-# 1 6I1 19t ~461 09f 1 6tT ~7i ~ Ol~ 9 1~9~ f1 1 61r61 651T9 (191 6 41 7?1 11 $ 191 ', 6 1 -- F 91 S91 b1 911 SLT 991 191 0L1 551 i5 LS1 E1 ±51 s41 1 49S491 I 51 il . 661 OSI 951 6 A1 161 -2 IlI 691 IL! I 'll * 91 6SI ~ PI1 61~ 6 1 4~ 1 -41 I1 61 ^151 1 6 61t e4 I 61 '.61 i61. *6! M1 11 Ltel I1 I41 "i-591 9S2 9L1 6±1 161 Z91 611 991 t91 691 Il1 1p 611 E99 091 661 091 g . 991 r 1I1 C C I1r I . esl .) ±1 171 9 1 69! 1(1 tS1 491 CS I . 1 191 1LT 041 I z61 v 011BiTT1 4 T i 1 1 , 1 651 1'1 191 6I1 -', 491 691 961 ?11 Z11 491 911 191 (91 591 191 991 991 Si zqI il 1I9 111 41 L91 116 U1 161 191 S -I 161 t 9 961 ±81 /61~ 96! 991 561 9v1 PI Op t ~191 6±1 W91 641 061 oou I 61 161 261 li 1 0.. 1 ".1 141 69! -04/ 1zi 94? vie Ise S4/ 94? 61Z 94? 61? ie 04 0? 02 ?4/ 44 L4E ive/4 s v 1 21 -Z H r, 64S 946 ±65 155 266 965 I9s 466 9 9h _C' 655 055 _' 666 1096 inF9; ' 64; 9i 7i -J1. "-i 1 -11--- 1 1---t01 1~ 1h 61 'i901 %A,~i~ fe i i I~ t.141- (4141 Jo I -16if 4 1 'i 2111 1"1 (17 1 #.= Ut1 Iil 11#1 Iv.page- 16~
111. Image Processing
The first processing that must be done to the image is to convert the " column coordinate into wavelength. This is clono
through the use of a calibration function:
S= -SO+
0=)
+
(X'- xO)
(S+
So)-So,
,
and C being. three constants determined from three column number-wavelength correspondences as fol lows:C =N( - ) (St+ SO) (S2+SO) so -St+(XXS - St) $ ($- S
(4-t4)(S2-Si)( -
Si-X)
6
-So.= -S + (C -9 $ - 2
A
) S - i
C
9
..
These correspondences are obtained by observing the spectrometer image of a calibration lamp with known sharp emission lines
fav
show4n in Figure G). From this calibration, which is redons: periodically as data is taken, the wavelength-column relationship is known - (see Figure 7 .for an example). The resolution also0 varies as
a
function of wavelength, as would be expected (see Figure 8 for a sample dispersion function plotted from the first derivative of the calibration function).0.
64.00
98.00
128.0
180.00
192.00
2N,
VIDICON COLUMN
A spectrum of the calibration source, indicating vidicon intensity
of each vidicon element along one row. Assigned wavelengths are
indicated.
Figure 6.
V1DCu)2 F.125 Sir 35.0 La 0.3317 S4= 57.5 L2= 0.357 S3* 199.5 L3s 0.809 LC= 0.1541 Cz-41.73d8 SO*-263.2354 - _-1 0.3.133 51 - C.3508 101 0.4114 151 0.526C 201 0.8248 ? 0.3139 52 0.31~~ 02c0.413~152 0.524~ 0.8357 1 0.3145 53 0.3527 103 0.4146 153 0.5328 203 C.8471 4 ;. 31,f .')4
0.3*416
10 5 0.3158 55 0.3546 105 0.4179 155 0.5398 205 0.8708 6 0.36456~~.35~5~~106~~d.419~~156~0.543~3~~~2'6~~~~8834~ 7 C.317G 57 (.3565 107 . 0.4213 157 0.5470 207 0.8963 ti 0.~3~17 T58~ 0.315'~ LOP~ 0.4230~~ 158 0.507 20q~~0~. 0099~ 9 C.1113 59 0.4 85 109 0.4?47 159 0.5546 209 0.9237 ia M.0169 6 .'' 42V0 .9382 11- 0.3196 - 61 0,3605 111 0.4283 161 0.5624 211 0.9532 12 0~.32C3~~ ~~62~ ~0.3215 ( 112 ~0.4301 162 0.5664'~1 ~0.96 8 13 0..32C9 63 0.306 113 0,4319 163 0.5705 213 0.9850 14 0.16 601 15 0.3223 b 0.3 47 115 0.4357 165 0.5190 215 1.C194 17 03216 67 ('.3668 117 0.43q5 167 0.5878 211 1.0569 16 0.3243 0.3b79 lj8O.446 .076 19 C.32t0 64 '0.3(-Q 119 0.4435 169 0.5970. 219 1.0977 zu .2 700.3/ 1 20 26 O. 4 4 67 0618 6 O 20 1.A195V /1 0.3264 11 0.37121?1 0.4476 111 0:6C66 221 1:1424 le i 0.34271 72 0.11 -M -- 664 23 C.3279 73 0.3735 123 0.4518 113 0.6167 223 1.191S .44 0. 32 6 4 0.3 741 124 -0.4534 174.6219 I 224 .2179 25 0.3293 75 1.315q 125 0.4561 0:6272 745 1.2458 426 0.3301 76 0.453 176 6 27 0.33C8 7 0.37!2 1?7 0.460i 117 0.6381 227 1.3060 4d 0.3316 -78 06i7Th 128 0.462d 1 22 "8338 29 0.3323 79 0.3bV7 L20 0.4651 119 016496 229 1.3733 30 1.331 80 0 3 0 1 .- 2 - -I' 1.304 01 03 149 81 0.483? 141 '0.4698 101 . 0. 6617 231 1.4489 . 32 0.3346 82 Z 3644 1320.4 1 0.667 22 1.4904 33 C.33i4 e3 0. U) 133 .4746183 016743 233 1,5346 34 33t2 4 U.3810 1 4 0.4171 184 0-60.03 23 15818 . 3 0.3370 85 0.3H83 135 0.4796 185 0.6876 235 1.6324 36 0.3378 86 063396 136 0.412i 186 0'69452361.6866 37 81 0910 137 0*484S 187 0.7016 237 1.7451 38 0.3314 88 0.3113 13A 0.4874 188 0.7089 238 1.8081 39 C.3401 P9 0. 11 134 0,4101 189 0.7164 239 1.8764 40 0.3411 90 0.31r51 14r 0.4928 190 0.7241 240 1.9505 41 0.34190.3965 141 0.4956 191 0.7319 241 2.C313 42 0.1428 92 0.39V) 112 0.4984 162 0.7401 242 2.1197 ~3 ~3 0.3993 143 0.5013 193 0.7484 2432168 46 50 94 0.4008 145 0.507 165 0.5790 245 2.940 4b Oo~43 96 0.4037 146 0.5101 196 0.749 246 2.5758 4 91___ 0..462 117 0.513 197 0.7843 247 2.1256 60.34,0 98 0.46 148 0.5163 198 0.59 248 2.8937 StA 7290 71 9 0.314 0.313 17 1L/9 047 ).45195 199 1T 0.8039 6~~16 22~1R229 3.0862 73.4993735 123 0.4522 1C3 0.142 250 3.1077Figure 7. Wavelength as a function of vidicon column
for a typical calibration function. The three column(Sn)-wavelergth(Ln) tpairs used to determine the function are given at the top.
Columxi number is at the left, wavelength at
page 19
300280
260 240 220z
2000
o
180
z
0
U 160 W 140Z
120
, 10080
6040
20 0 0.3 0.4 0.5 0.6 0.7 0.8 0.9 1.0 1.1 1.2 WAVELENGTH IN MICRONSFigure 8. Spectrometer dispersion function.
spectral. resolution per image element
as a function of wavelength.
page 20
has been written which runs as a subroutine under the Planetary
Astronomy Laboratory's image processing system (DIPSYS) which has
been set up to provide a metastructure under which vidicon images
may be easily processed.
A simplified diagram
of this program
appears in Figure
9.
The spectral image is read off the run tape by DIPSYS and stored on a disk where it is available to the spectral processing routine, which has three basic tasks. The first and easiest is to punch out the intensities along one row of the image onto computer cards for input into a plotting routine(this was how Figure 6 was produced). Second, it can subtract the average background from the image, column by column, where the rows over which the background is to be averaged are read from the input instruction cards. Last, and most important, the program can produce a new 'image in which all of the elements have the same
spectral resolution. For spectral reflectivity work, where the range of interest is 0.4 to 1.2 microns,' a resolution of 250 angstroms, the best resolution at 1.2 microns, was chosen. Figures 10
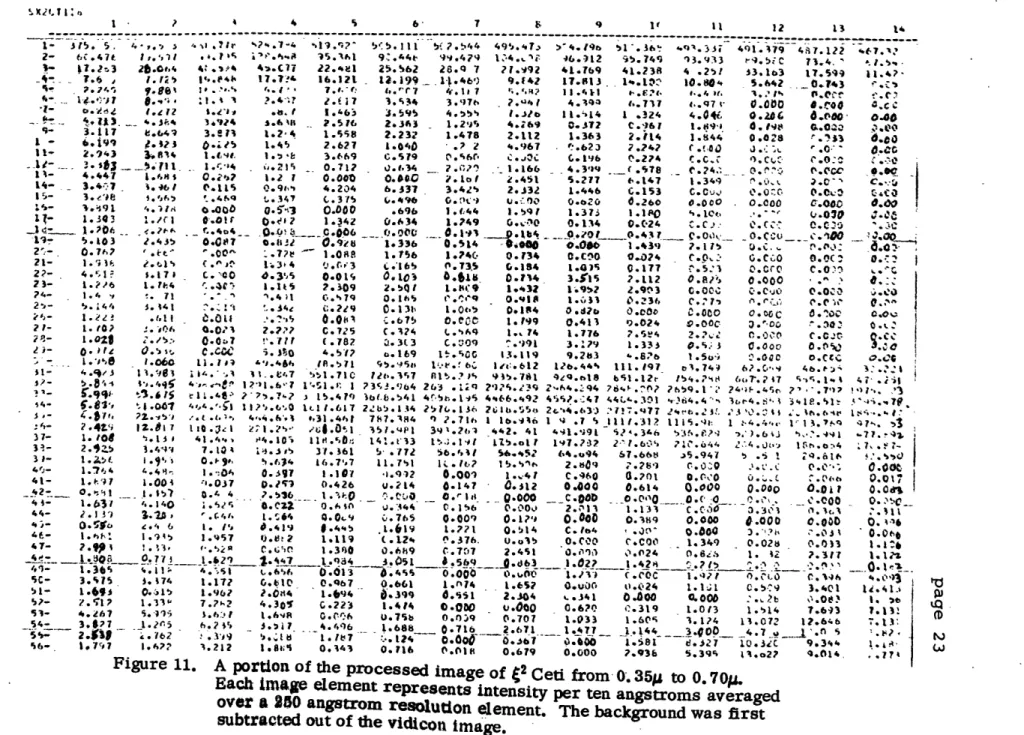
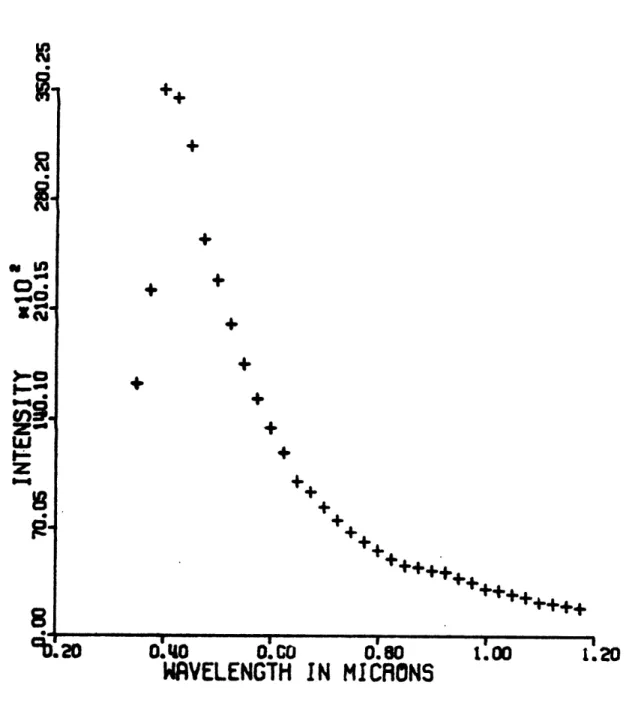
and
11 show the effects of this processing on an image of the standard star Xi 2 Ceti. Portions of these images are then integrated spatially along the slit. Due to atmospheric and telescope optical effects, a star image is not a point; it is smeared out spatialy into to a Gaussian distribution of intensity which is at its maximum where the point source would be. To use the full energy output of the star at a given wavlength, the image must be integrated across all rows where the image intensity ispage 22 '2 --. 'C 1-4 .. .. 1 ..0 oN 3 e 0 . C' -v 4" -4 .. I' 'Cl I r .W ... .. 0 . .. 1 ..-1:1 '' 1 a .4!1 ph r 4 11% ." .
I
-v
N. 4 ^M 4 V- c -a y r ' sa -I"'t f ; 7 04MI -- ' . P%:4 '-.e . ~ -a 1r c. -" 41%o a *,"e 4.7r, 4 N aI a e-j .. e o '.ar N " ... u-" a e 0 o -eU'...t- -C . . . .. . .m00 04 I ---. eor, .. O -A . -.a ,.. .. -we .0. ,..~
a'w e ,4% x 41 11.0' a ---..- .~.0... a O 0 , . 1 v ow--4' . c- .. ow, a og A A h -4 en A I '4 .' '0.. .. ... 4 -.. .A .4' o a.. N .- n- ,'0 a '.---.- - --- ~-a .O -A- e 7 o aECN.,e a ' A4''4' SeINCANN 5 I e s , o -N sr N. E.0 N S '7 -' % 4 .9 .4 N *A CA C a .... .---..-.--.-a ,, ... ~.... ..-* -..---* I a *' *" 4% N 4% a'N a -o .. '.7 ' eA -'N a' sa 4 e nA-N a 4' e M4m~ a's asi a :a t.a t'a a .. e 4 tUj N P 0 (b, --! N. e . .. i ~ . * cir-~
'AN.-4 -,.4JN -J "," , 4 A e a t 'IQ %' ' -' r . r a eA . -*- e.'4%" A'A~ -,-- % N** '' *. 4. o- A- -'IV --+ --- ---- 3.* ---e..- .4
.am
.. .w~
. . .- -:M . -. -. r . e . 0 r... -- * a N -* t *;- *4* -r. I '' C N . ro -\ .o-w w , -- * -. -4 -* - -I 1P f --. C'o- 'A f- (f ft -G 17 N f, C -- I f, . 4 -* t- P o----I
C- ' 4 't -1 f --- -"- *..4 ' -4 -4 .~s- -~e --. -r U- -- --- v r -- -~ f4 m r "y t N P- t -a -..- - --: w. N .f-,. -a -1% -44--.. .- -.. % CI 0 -0! s m .. -.--- ---N c,% N P -.- '%- ' N'4 ' ft- -o : ... A -to .- , C N N c4 ' , (4 It Pri -4 -V . f" e ^- --I* fy P" % -Z, or, -4 r. c "4sN -s (4 . 7r N-- --4 ..-- *A-4 , -C ' -N 4 -+ C '-c --r .4 -- M, '0 -P ' N ' -P. 1 *r V U ft IL 1 f- 1& 0 so --- f^ 4P -f N -fPN'f N -0 0;e -. j.eea-
-s.sw .- .. -.- -4..-4 C .. '... ... .. ..-- -4C. r4 ,v -4 ,:1 t 1% . IF .7-~-4e .'n .N -M A *C A C CA N *'N N NN 5" N N N C -U ' N. ' " 4 eN N A N N *N N N N r4 f 0! 1 04 % ta%!- ' j Si" C * ' N 0 ' -e N-f . 'Z N N F. .0% -ee A r -- V. N -V II m- --- ,0 f- 14 t emo %, e ' I-erews.e- m N 't v I . -aN.-1
.I . C... .. . -. A. N. 'e .A ... .s -... .4e .4~ ... ... -= ' CA 4'e -# 'A --A 4% . -. IN I .0ee'0'e~wne-4N----o---=~o--.O00N0l" 4%NN 1"T4C'4NAC4%I''oCA* CA--, N.--' N i W." '..s N. N. .4% a 541 -.s% ... .. e Ce w N.. "I -a-. a C'"0 N t ,r .7 4 A N..9 --e- -. 4 .- .. 4 '5-.e -o f -M N N' -N% -e N ---o- W N M M0 IN %. A4 "I l*.efC ' I m 4- -CA A ~ . . C -A -n -e .. -. -Col- [ P-r s' V- N -9 --- -. -- --. -7.. 9. A1 *A W.. so m -" 4% -. 44 %N -1% -^!: n -o4--- n~ N 'y I ere0'?'-C.No 4-. e '4- --* --me 0- -o...-- . -... D, . A ... tv.. 1 -:I
q --D .. -4 Q-ft N CA -N N 4 9'. 1A %tE 0% 'r .n 0 ^"J v 4 9 -# . W 4% o" N on s M- 4 CW 4 C C A CA CC C A W A -% CA CA -4 0' 'A a' "- N 4 -' e N N N -. -A ' CA mA 'A N N A N N -4 'AN CA at ' a V N o- 'o 0 t 4 , e 'A --d N CA N N .... ... .-j .. q.- ~.- .9 --. 4 e e .8 't a .. V -P .- ry w- m -- 0% r A oe NiA.7 N NN C A .0 .a 'A4 N C i' 4i * 0e '- '4 L" -4 A -.N 4 d |~ 4N-N CA C C 4 N A C b ACA CA 4 CAN un Co P *- 4 It N 9 r m a a, N N 01 N PA W A" a' . .4 N -4 f4 %4.*4 4 N 44 ... ... ? -... ... .4.--, A -A N V- + . N- 'AA A 4 ON cAmC I"'N N v , * SA -e -* CA Z e CA CA A N N CA C A CA CA -.. ... -4 P 4 . Nf- c 4r .% -+ 4 -',rt NM Ion N" CAt P N m%~ 0% 'CO ... .. .- -. . . . 4 w -N N .. 4.1% 3'4 4% A N '*[.e
... .. 4.. .. N .e WC- C. L% 4"4.Ne sass- sat..,e a -i . . ... .-.- -4- 1-I".' -N --... ... .e .. ... ~ --- w' -r U0 . "m I e a j o-.. e ,'N C . ., A . . .. ~ .41 0 0O
'. cc >O4 QO b0 5 --Q)0 C3 -OD . 0I 2 * 4 5 6 7 9 V 1l 12 13 t'
- - - - - - - -- - - - --- - - - - -- - - ---
---1- 315. 5. 4-,. a ,?7r 4.7-. %119.'7~ 5 -5.111- 7,544 4945.'.72 19b j 51-.36- .-. 33 417 9417.122 41'7.'P
2- 6C.47 f r.1 94.7 a14- Mi 9-.'.44t 99.479 1-,''4.I ' 46.12 rs. 7419 93.933 -4. 5:C 73.4. 5 .s.
- I7.t,3 2t.0to4 4o.4*4 41.C77 22.4el 25.562 28.9 7 27.992 41.769 41.238 4 .251 33.163 17.549
11.47-4- 7.6s 1 i., 14.044% 17.774 16.121 13.199 1-.146) 9.F42 17.813 . 1...1 10.804 5.642 0143 f
.
v.
8% I' -10% 'A . ' 7.* o .'r 7 4. .I iI'Co? I I .#O1 t.-,4 . 1. . A.. , 1% l . * ,- . 0i *..- :1.' l ?.47 - .- 7 ?.534 3.976 ?.4.1 4.394 6.717 e.97v 0.000 .c@0 4.C.
a./4 . 4,71). -_-_ 1.zi 3.W4 1.m .I.. 1.6l4 2 516 1.463 2.363 3059g - 4. t) 1.29il 4.269 I.to I 0.372 .*14 1 .324 C.i61 4.046, 1.09-1 0.t'e 0.2h o..2% 00 - o.ogV C 9- 3.117 k.o64 3..11 1.2.4 1.558 2.232 1.478 2.112 1.363 2.14 1.44 0.028 *.3) 8ec
1 -it- 6. 1997 ?.3V3 0.z45 1.451 2.627 1.040 .? 2 '.967 .623 2.?47 C.'C0 a.: ; .o:- 0.c
2.943 t 3.$h -.I Lc 1.34. 1.,-1 3.69 c.579 C'.%6' C.t~. C .196 0.274 c C9.ca .0:^ O.'
- - ..215 0.712 1.C.34 - .0? .- 1.166 4.399 ._.78 (e 7.' crg o.occ ..
- 4-447 1.41 O.fmS ? 1.2 1 0.000 0.00.0 .loI 2.451 5.277 6.147 1.349 k.0 *.0,' C.,5
14. , 3.7 . 4.+6 A.115 Q.9t- 4.24 6.337 3.42V 2.532 1.446 C.153 coocu 40.0:C 0. 0 k .ca
I5- 3.e08 6- 1W9 91 4.1 t fi '.46Q t. 347 C.375 C.I496 0."it U.00 0.020 0.260 0.000 . .COO C.OWG 0.00
IA 0-co0 ao.7<3 0.000 .o696 1.C44 1.59 1 1.373 1.0 .100 --.- lc .. 070 %o.d
11 1.343 1./Cl 0.01r 0.e 1.34Z 0.634 1.749 0.0o 0.134 0.C-24 C.C.>: 0.CC. 0.015 -ac
M- 1-206 .f<? . O.0'5 c.006 .0.0040 ..11 . .Vo.2g 0.417 V.010 - e-g
19- 2'- 5.103 0.767 1.435 0.0 . a01i 0.9u2t 1.33. 0.514 -%900 *.Oa 1.4391 7.115 OC. .00
-'i.te' 1.00n 1.72e 1.008? 1. ?S6 1.746 0. ?34 D.0030 0.024 Cop% . ZI G.ec g -1 . 0c
22- 4;1 I 1.171 C. 00 0. 3"s 0.013 . 0.1101 4.118 0.714 3.515 2.112 0.5'3 0.000 1., r .z
23- 1.?,/6 to.714 r .,c ,1 l.14 2.309 2.5Q) 1 leM1C9 1.4d32 10.952 2.903 C.0 0 ,1 O.000 0 00 z .
74- -,- 1-' '' .1,4 ' 5.141 71 -% . 't '4 4, )1 C.4 0 cl.%79 0.16% c.e il . 4
~ta
1.Cn 31 .:.36 t C. I7- no~es C~ 'i 0.2.9 0.131 1.005 0.184 0.826 0.0 C; 0 . c C" 0.0.
k I 1zm -o? 0 .6n.1 -."A6 4.0-1 0.01 2.??? 1.5 . .675 0.e0 1.,99 0,411 9.024 V.00C . D.110 0..I.
C.725 C.174 0.%..9 1.%74 1.776 7.5e 2.*; S.0C0 C.Ct .C
1.020 1.'e 2./5 1.06o *.00 11. 0.0"7 0 9 e.4l P.711 .30 (.782 4.5'1? Ci.3E.3 a.169 1 t.S0G C. 00 13.119 ".991 9.263 3.179 '-.876 1.333 0. 1 3 0.000 .00 0.050O.ccc .
.s57 %.95.4 l''.f6C 1/:.612 126.44% 111.197 el.744 62.-9 4 6. 0, : ' ''
1 '3 13*98 1 ''~ .1 -.1'7 5.710 2."7 5.? PS 915.781 9/Q...38 bt.12e I54.?48 6,7-.147 S%.1. 4 7 i
t'j. t-t
-i.445' 7-,$ 3c.60 15 . ?3 3.964 26*3 .129 2"2.z & Z %. 4 ,. ..- 07 ?htp,9,1- 741* . .-. v .. '.9Vd65e 7.- 7->7? > 1549 It6 W6.541 4r-h. I9-P 4%66.%92 4 'i10. 4 7 44C...3'oi s0 4. 4 U-4. li., I,3.1 Sl ,.7 14- 3G- 2.$ ', 1g.06-f 4 1 '' 0 U1125 M t .617 24 5 . 13-4 15 IG. 156 24;1 b.'550 2< 4 ., 33 ??747 2T h. S 3 )3 1A 4 8 .
, ?4.-s' .-4 .f.i' 4 . *31.46h 7147.lii4 e) 2.71t, 1 16.446 1 4 .7 5 1111.31? 11I 5r. : 1 -4.4'.. V 1 1..No -47-,.
-- 2.4Z.5 12.$17 110 .,7,-1 2 .2", / .0 1 51.14P I 3Y91.21)1 .442. 41 441.199t. 5 .346 536.t7 -.>.':). 60 .9 -. 7 P.+3
37- 31- 1.08 2. Z5 3.41' .. 13 # 41..to* 7.104 P4.103 IV id.0S .Ss5 37.361 141.t-13 5- .772 15tJ.1'# 56.411 1.5.o11 $6.ft5Z 197.32 64.u94 2 67.665 25.947 11644 2:A ?.4 .*, S .t ' Ih'.o.4 24.616 ;7.$.s .#
31?- 1.45C 40- .17J 4 4.4% . 106- 0.090" . 1*-.04 0.397 5.I74o 16.7Vs7 1.107 11. .1 7'll 1k .0.00.) It,? 1 1.v41 5. t C.9)60 2.8094 (1.701 C1.2619 0.00L0 cl.0~ -; 0., . V. .0 0.017o.. 00t,
41- 4 - 1.004 J. 1 ,1.037 0.?1q)2 0.426 U.214 0.147 O.312 0.000 0.614 0.000 0.00c 0.0iI 0.0n1
.1? - 0. 4. ?.536 1.3p . _ --- 0.eI Q.000 c.00 0.0 .i. e.0000 0.M50..
t4- 1-.1 4.140 1.S/ G.ca O.SAn %.344 0.156 0.000 2. MI 1.13 C.C. ~3.3?1 (.I 1( 31
44- 2-1in M.7., '.641- 1 .';64 0.00,9 .7US 0.00r) 0.17,0 0.000 0. -9i 0.000 j..000 0.000 0.4"6
4;- 4- 0. 1 . 5'F e.'0 l *.94 6 1 .7 1. i 0.419 0.13"2 #.445 1.119 .1.619 C.124 1.7?l .*3 76. 0.035 0.514 C.104' O.c00 cOcoo .0 0.000 1.349 3.? 0.or 0 os.0)n . -0'1.id
4T- 7.9p 1 - -1, -.,:e" C.6170 1.310 0.6h9 C.7V17 2.4%1 '~ 0.2 4 0.i ~1 h .4 7.317 1.1gt
- -11 .6 29 %.4 .4 301 4.569 63 ___ .1.02.7 1.4214 1; . 7 P) 0 0a . s Q
4 - 1.30 fe.I1;.- 4 .Ss I ,.61P6 0.013- #_.4%% - 0.0 o06.00 "
~
66coc to.) r Ci. 4,4 c.u ~~h 4 .O9SC- 3.75 3. 174 1.17? G.t10 0.967 0.661 1.014 1.652 0.uor 0.024 1.1 1 0.5'9 3.401 11.41.1
51- 5?- 53- 4.267 7.'517 1.69j 0.:15 5.9'-> 1.33" 7.?k2 1.96? I.6 ' 4.3011 2.04 1.I.tda 0.0C6 0.223 1.6-94 ~ 9.75 1.414 .399 0.000 0.S51s- 0.0,59 -.U.000 2.304 70 - t..341 0.6? 1.033 0.000 1.60 .319 3.174 1.013 0.000 11.072 1.514 '2,t: 12.646 7.6411 1'.08L 7 t).13.
54- - 3.677 2.~ 1.15 6.* 2 IS, 39t,17 -- 4- 6 1.688_. 0.716 2.671 1.477 _ 1.144 3.,00 4.7J. S
..7 3.m 1. ., o1?4 - 4 o) 0 -- 0-0 1-_81 - -- __.0 9-34 N
%6-1 1.* 797 0477 '.212 1 avi 0.3 0.116 0.0111 0.679 0.000 7.936 5.394 13.o27 '.014, .177 W
Figure 11. A portion of the processed image of 42 Ceti from 0. 35S to
0.
7 0p.
Each image element represents intensity per ten angstroms averaged
page 24
above the background.
After this integration, the spectrum vector
is punched out onto cards for plotting and further processing.
A
more advanced version of this processor will
incorporate
the:'
plotting, ratioing, and other functions into one
OIPSYS
subsyste~m.
where only disk files will be used.
The final
procedure needed for good spectral
ref lectivi t
y
data of the surface of a planet
is to know from what
part
of
the
surface the spectrum originates.
A photograph is taken through
the eyepiece, loeking at the slit in a mirror tilted 45 clegrees to
the
optical
axis of the telescope (the first surface in Figure
3).A similar logging arrangement is
used for photometer
data.
A
plotting program has been written to create Calcomp plots of the
coordinate grid of Mars (or any other planet) projected onto a
disk using the physical ephemeris of the planet from
The
American
Ephemeris and Nautical Almanac and the time of observation
in
Universal Time.
Figure 12
is a block diagram of the program,
while Figure 13 is a typical,
although smaller
than normal,
output.
To position the spectrometer slit on the ditk
of
.the
planet,
the
negative of the photograph of the telescope image
is
projected onto the
'grid,
and the
slit
marked by hand.
At this
point
the -original
vidicon images have been reduced to constant
resolution spectra of stars and known positions on Mars;
and
reduction to spectral reflectivity data,
as well as testing, can.
PHYSICAL
EPHEMERIS
(1 MONTH)
CREATE TABLE OF
SUB-EARTH POINT
COG~RDINATES AND
APPARENT DIAMETER
RUN CAR D:
day of month
UT start of run
UT end of run
Lcaption
Figure 12.
Flowchart of grid
plotting program.
ADD HOURLY CHANGE
OF PARAMETERS TO
TABLE
CA LCULATE POSITION
LOF SUB-EARTH POINT
CALCULATE NUMBER
OF MAPS TO BE DONE
(one per five minutes)
DRAW LINES OF LATITUDE
in spherical coordinates,hold
$ constant and rotate in
6.
transform so that sub-earth
point is at 0=900,
6=00and
project to plane.
DRAW LINES OF LONGITUDE
in spherical coordinates, hold
6
constant and rotate in $.transform as with latitude lines.
WRITE CAPTION
object, time, sub-earth point,
apparent diameter in arc-seconds.
LOG MAP and INCREMENT TIME
GET NEW RUN CARD and
CHECK FOR LAST INPUT
MRHS
VIDSP
4
0
T
L
L
D
EC
C
OF
4
CT. 18, 1973
=
8:
58 UT
RT= -17.3
ONG= 9.
8
IA=
21.46
SEC
Figure 13.
A typical grid plot produced by the program in Figure
the third produced for vidicon spectrometer Mars run
12, )
page 27
IV. Analysis of Data
The first major attempt
to use the vidicon spectrometer to
take spectra for reflectivity work occurred during the opposition
of Mars during October, 1973.
On two consecutive nights the
Mauna
Kea
eighty-inch reflector was trained on
the planet Mars, and
about 75 spectra were taken, as well as an equal number of spectra
of the standard stars Alpha Lyra and Xi 2 Ceti.
Xi 2 Ceti
was
chosen because
it
was near
Mars
in the sky,
while
Alpha Lyra has a
spectrum which is well known and
is
used to calculate planet/sun
ratios to get reflectivity.
Figure 14 demonstrates the reduction
methods used to get spectral reflectivities from raw intensity
spectra.
To avoid airmass reductions, spectra of Alpha Lyra and
Xi
2 Ceti were taken when the two stars were at
-the
same airma!-s,
1.38.
Since star/star ratios exhibit
little
variation with
loai
airmass changes, the ratio of the two stars obtained from these
spectra can also be used to reduce reflectivities
-it oth-r
airmasses.
Before any data was reduced to reflectivitin-.,
extensive testing was done to see whether the
data
would
beusable. This portion of the thesis will describe that work, usinV;
the best results obtained to date.
Figure
15
shows
a
high resolution spectrum of Alpha Lyrat
which has been averaged over
258
angstrom segments
to
simulate the
spectrometer output.
Figure 16 is an Alpha Lyra spectrum from the
page 28
AIR MASS CORRECTED SPECTRA
Production of spectral reflectivity from
raw spectra. Air mass correction not
not needed if objects to be ratioed are at
the same air mass.
page 29
+
+
wlfs+
+
8+
.0;>
:
+0
+
+
+++
+
+
+
WAVELENGTH IN
MICRONS
Figure 15. Spectrum of aLyra, averaged over
250 angstrom resolution elements, from
a 50
angstrom
resolution spectrum provided
in
.W) (1>
0.40
0.
b
WR,-VELFNG1 T I
IN
MrI6h.C
Figure 16. aLyra spectrum from vidicon spectrometer with vidicon response (Figure 2) divided out.
page 30
Crn
page 31
removed. Note that the peak is shifted to a slightly longer wavelength and that the shape is generally broader to about 0.7 microns. To test the repeatability of the data, pairs of spectra of the same star were ratioed to each other. Results of one such pair are shown in Figure 17 (all ratios plotted are normalized to 1.0 at 0.S75 microns). Figure 17a is the ratio of two Alpha Lyra spectra with similar airmasses (1.40/1.38), but different exposure times (Ssec/lsec). If the response of the system were perfectly linear, that is, if intensity recorded from a given source is a linear function of the integration (exposure) time, the curve would be. flat. It is obvious that it is not; however, .the relatively flat region corresponds with the peak intensities of the spectra, so it may be that low level signals are nonlinear representations of the intensity received from the star. To test this idea, a 'pedestal' was set up under the spectrum.. All intensities below a certain value would be ignored, and possibly, the nonlinear features of the curve would go away. Figures 17b and 17c show the results of installing pedestals of 300 and 400. respectively (the maximum intensity registerable is 403S). a p)edestal of 300 seems to help from 0.5 to 0.8 microns, but a lIarger pedestal doesn't help at all. Figure 18 shows a similar ratio for two Xi 2 Ceti spectra with slightly different airmaq'es (1.67/1.32) and different exposure times (20sec/15reec). Once again the curve is relatively flat over the peak in incoming energy, this time from almost 0.4 to 0.8 microns. (Figure 19 is a
++++++++44.4
4.4.4.
4.
4.
0.40
U UO'.EENG0 .60
0O.80N
WAVELENGTH IN MICRONS
SRLTR86
/
SRLYR83
Figure 17a. Ratio of two aLyra spectra, all elements
above background included.
page 32
4.
+
C,,
z
U.'
4.
4.
4.
++
.20
1.00
1.20
page 33
.g.~.g.
4~.g*
4.4.
+
4.
+
4.
4.
+
o.40
00so
08o.
1.20WAVELENGTH IN
MICRONS
SRLTR86
/ SRLTR83
Figure 17b. Ratio of same two aLyra spectra,
this time including no elements less than 300.
CD IU,
z
LU
~6. 'rn-Go81
Sf1bko
-0-4.
4.
~4*
- EEG I M6icRWAVELENGTH IN MICRI
SALYR86
1.00 '
1.20
SRLTR83
Figure 17c. Ratio of same two a Lyra spectra,
this time including no elements less than 490.
page 34
co0RI-.
zc
C-~B'
"b2
- ---- - - - -----page 35
4~
4+
4.
.4.
44444444+4.
U44-0WAVE
'.GT
N C'.S
WRVELENGTH IN MICRONS
SXCT112
SXCT124
Figure 18. Ratio of two t2 Ceti spectra, including
all image elements above background.
b-n
z
wi
PICie
81
,b'.a0
page 3G
typical Xi 2 Ceti spectrum). this time, however, there is a smooth upturn which has some undetermined significance. Thut . star ratios seem to be usable, at best, from 0.4 to 0.8 microns.
Now that there is some idea as to the reliability range of the spectrometer, indefinite though it may be, the Mars spectra can be observed. Figure 20 is a typical Mars spectrum, summed over five vidicon elements down the slit. Note that the peak is
in the red, rather than the blue like the two stars' spectra. This is because the stars are both of spectral type AO, while the
sun, which is providing the light which is ref lected from Mars is a cooler, redder type G. Figure 21 shows a saturated spectrum of Mars. 'The peak intensity of 4095 is surpassed from 0.5 to 1.0 microns, although around 1.1 microns, the signal is unsaturated. Originally it was thought that the unsaturated portions of a saturated spectrum could be used to extend the range of an unsaturated spectrum which had a very low signal beyond 1.1 microns. The data show, unluckily, that there is little or no overlap between the good signal from one and the good signal from
the other type of spectrum. Once again, an attempt was made to do away with low, nonlinear signals with a pedestal. Figures 22a.b,and c show the progressive changes as pedestals of 300 and 400 are subtracted from the original spectrum. Ratios of Mars images seem to be more consistent than those of star images. Figures 23a,band c and 24a,band c are the results of ratioing different 'images of Mars to each other. The three images used
page 37 4.
+44.
+
+
xg
-.20
+0,40
0.60
WAVELENGTH
SXCT112
0.80
*
.00
L..
IN
MICRONS
INTEG.
Figure 19. A typical t2 Ceti spectrum. Note that the peak is at a longer wavelength and the shape is broader than a Lyra.