HAL Id: inserm-00483216
https://www.hal.inserm.fr/inserm-00483216
Submitted on 12 May 2010
HAL is a multi-disciplinary open access
archive for the deposit and dissemination of
sci-entific research documents, whether they are
pub-lished or not. The documents may come from
teaching and research institutions in France or
abroad, or from public or private research centers.
L’archive ouverte pluridisciplinaire HAL, est
destinée au dépôt et à la diffusion de documents
scientifiques de niveau recherche, publiés ou non,
émanant des établissements d’enseignement et de
recherche français ou étrangers, des laboratoires
publics ou privés.
GABAergic hub neurons orchestrate synchrony in
developing hippocampal networks.
Paolo Bonifazi, Miri Goldin, Michel Picardo, Isabel Jorquera, A. Cattani,
Gregory Bianconi, Alfonso Represa, Yehezkel Ben-Ari, Rosa Cossart
To cite this version:
Paolo Bonifazi, Miri Goldin, Michel Picardo, Isabel Jorquera, A. Cattani, et al.. GABAergic hub
neurons orchestrate synchrony in developing hippocampal networks.. Science, American Association
for the Advancement of Science, 2009, 326 (5958), pp.1419-24. �10.1126/science.1175509�.
�inserm-00483216�
DOI: 10.1126/science.1175509
, 1419 (2009);
326
Science
et al.
P. Bonifazi,
Developing Hippocampal Networks
www.sciencemag.org (this information is current as of December 4, 2009 ):
The following resources related to this article are available online at
http://www.sciencemag.org/cgi/content/full/326/5958/1419
version of this article at:
including high-resolution figures, can be found in the online
Updated information and services,
http://www.sciencemag.org/cgi/content/full/326/5958/1419/DC1
can be found at:
Supporting Online Material
http://www.sciencemag.org/cgi/content/full/326/5958/1419#otherarticles
, 20 of which can be accessed for free:
cites 43 articles
This article
http://www.sciencemag.org/cgi/collection/neuroscience
Neuroscience
:
subject collections
This article appears in the following
http://www.sciencemag.org/about/permissions.dtl
in whole or in part can be found at:
this article
permission to reproduce
of this article or about obtaining
reprints
Information about obtaining
is a
Science
2009 by the American Association for the Advancement of Science; all rights reserved. The title
Copyright
American Association for the Advancement of Science, 1200 New York Avenue NW, Washington, DC 20005.
(print ISSN 0036-8075; online ISSN 1095-9203) is published weekly, except the last week in December, by the
Science
on December 4, 2009
www.sciencemag.org
GABAergic Hub Neurons Orchestrate
Synchrony in Developing
Hippocampal Networks
P. Bonifazi,1* M. Goldin,1* M. A. Picardo,1I. Jorquera,1A. Cattani,1
G. Bianconi,2A. Represa,1Y. Ben-Ari,1R. Cossart1†
Brain function operates through the coordinated activation of neuronal assemblies. Graph theory
predicts that scale-free topologies, which include“hubs” (superconnected nodes), are an effective
design to orchestrate synchronization. Whether hubs are present in neuronal assemblies and coordinate network activity remains unknown. Using network dynamics imaging, online reconstruction of functional connectivity, and targeted whole-cell recordings in rats and mice, we found that developing hippocampal networks follow a scale-free topology, and we demonstrated the existence of functional hubs. Perturbation of a single hub influenced the entire network dynamics. Morphophysiological
analysis revealed that hub cells are a subpopulation ofg-aminobutyric acid–releasing (GABAergic)
interneurons possessing widespread axonal arborizations. These findings establish a central role for GABAergic interneurons in shaping developing networks and help provide a conceptual framework for studying neuronal synchrony.
T
he coordinated activation of neuronalas-semblies features in most physiological brain functions and influences proper network wiring during development (1–3). In addition to cellular excitability, synaptic efficacy, and the balance of excitation and inhibition, the
architec-ture of network connectivity may be central to the
production of synchronous neuronal activity (4–7).
The relationship between network dynamics and topology has been studied using concepts from graph theory and statistical physics (7–9). Small-world and scale-free organizations are particularly
appealing models for brain connectivity because they offer a compromise between computational
needs, wiring economy, and robustness (1, 10–14).
These complex topologies have been found in contexts as diverse as the Internet, social sciences,
or biology (8, 15). When applied to neuronal circuits,
both models share one common feature: Al-though most neurons are connected locally, a few “hub” neurons possess long-range connections that link large numbers of cells, thereby bestow-ing network-wide synchronicity. It has been pro-posed that neuronal hubs orchestrate behaviorally relevant activity in cortical assemblies, as well as being causal in producing pathological oscilla-tions (4–6, 16). However, the existence of neuronal hubs is still speculative, perhaps because of the conceptual and technical difficulties of investigating them, including the rarity of high-connectivity (HC) as compared to low-connectivity (LC) cells. Additionally, definitive functional confirmation that neuronal hubs play a key role in
synchroni-1Institut de Neurobiologie de la Méditerranée, INSERM U901,
Université de la Méditerranée, Parc Scientifique de Luminy, Boîte Postale 13, 13273 Marseille Cedex 9, France.2 Depart-ment of Physics, Northeastern University, Boston, MA 02115, USA.
*These authors contributed equally to this work. †To whom correspondence should be addressed. E-mail: [email protected]
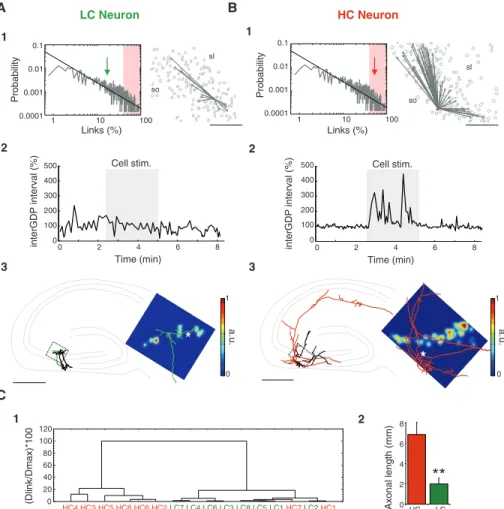
Fig. 1. Analysis of multineuron calcium activity reveals a scale-free topology in the developing hip-pocampus. (A) (1) Two-photon calcium fluorescence image of a rat hippocampal slice loaded with Fura-2AM and visualized with multibeam excitation at
×10 magnification. Scale bar, 100mm. DG, dentate
gyrus. (2) Detected contours of the cells from the fluorescence image shown in (1). Red dots are the 10 highest-connectivity neurons in the represented network based on the analysis of calcium event onsets; gray lines mark the output links of one HC neuron. (3) Probability distribution plot of the fraction of output links over the total population of active neurons imaged with ×10 magnification (gray
line,n = 3224 neurons in four slices; SOM). The
graph is plotted on a loglog scale, and a power-law
distribution with a slope (g) of 1.3 T 0.1 (n = 4) is
indicated in black (SOM). The inset shows the location of the 30 highest-connectivity neurons (~1% of the population, red dots) on a schematic representation of the hippocampus. The dashed rectangle indicates the size of the area of a x20
movie. Scale bar, 100mm. (B) (1) Same as (A1) but at
x20 magnification. The imaged region corresponds to CA3b/c; that is, around the dotted area in (A1). Arrow indicates the direction of the dentate gyrus.
Scale bar, 100mm. (2) Same as (A2) but for the movie
taken in B1. (3) Same as (A3) but for a population of 7588 neurons. The probability distribution of output links from smaller CA3 regions also follows a power
law with a similar scaling power (g = 1.1 T 0.1, n =
45). The probability threshold for HC neurons was
fixed to 40% (red-shaded area). The inset indicates the location of HC neurons (red dots) on a schematic representation of the CA3b/c region of the
hippocampus. HC neurons represented 5T 1% (n = 45) of all functionally
connected cells. This value was not significantly different from that calculated in
subfields from ×10 data sets of the same size as ×20 images, because HC neurons
represented 4T 1% of the connected cell population in ×10 movies (n = 4, P >
0.05, Student’s t test). sl, stratum lucidum; sp, stratum pyramidale; so, stratum
oriens. Scale bar, 100mm.
B A 1 1 DG CA3c CA3b 2 2 0.0001 0.001 0.01 0.1 10 100 1 3 3 Links (%) Probability 0.0001 0.001 0.01 0.1 10 100 1 γ = 1.1 Links (%) γ = 1.3 Probability so spsl
www.sciencemag.org SCIENCE VOL 326 4 DECEMBER 2009 1419
REPORTS
on December 4, 2009
www.sciencemag.org
zation processes requires testing the causal influ-ence of HC cells on network dynamics, something that cannot be achieved with post hoc data analysis (13, 17, 18).
To find cells involved in the synchronization of neuronal networks, we designed a method to map functional connectivity (FC) in real time in living brain slices, based on the analysis of multi-neuron calcium activity. Here we use the term FC to denote the statistical relationship between the activities of neurons (19), which should not be confused with the effective connectivity of
func-tional synapses (20, 21). This enabled us to
per-form targeted electrophysiological recordings and stimulation of neurons with a known degree of FC, while imaging network dynamics. We analyzed the developing hippocampal network because it provides an ideal circuit in which to investigate the existence of hub cells. First, as in most developing brain structures, network activ-ity is concentrated in rhythmic synapse-driven synchronizations, the giant depolarizing
poten-tials (GDPs) (3, 22). Second, the network topology
underlying the generation of GDPs is confined to
local CA3 circuits in slices (23–25), which
sub-stantially simplifies the experimental approach. Last, understanding the cellular basis of synchro-nization in developing circuits is important, because several maturation processes rely on early network oscillations (22).
Using multibeam two-photon excitation of hip-pocampal slices from rats and GAD67-green fluo-rescent protein (GFP) knockin (KI) mice [5 to 7 days old; see the supporting online material (SOM)]
loaded with the calcium indicator Fura-2AM (26),
spontaneous multineuron activity was recorded with a temporal resolution of 50 to 150 ms (Fig. 1 and fig. S1). The FC of the hippocampus was first investigated at a large scale (with a ×10 objective, Fig. 1A). Focusing on the CA3 region, the activity
of 806T 155 cells (n = 4 slices), distributed across
the dentate gyrus to the CA1 region, were simul-taneously imaged. Focusing on temporal correla-tions, a functional connection directed from neuron A to neuron B was established if the activation of A consistently preceded that of B (SOM and fig. S1B). An FC map was thus constructed for all recorded neurons (Fig. 1). In all slices imaged at low magnification, the average distribution of the number of output links per neuron was best fitted by a power-law function with an average scaling
power of–1.3 T 0.1 (n = 4 slices, Fig. 1 and SOM).
Power-law distributed connectivity is the signa-ture of a scale-free topology, in which hubs are
rare neurons with a high connectivity index (8).
Neurons with the highest connectivity tended to concentrate more often in the CA3c region (Fig. 1A3, inset). Previous studies have reported that this particular area is a preferential site of initiation for spontaneous GDPs (25, 27).
To increase the chances of finding hub neurons, we next performed experiments in the CA3c area at higher magnification (with a ×20 objective,
Fig. 1B). As previously reported (26), we were
able to combine targeted electrophysiological
recordings with calcium imaging. Out of 142 neurons recorded while imaging, only 45 were included in the following analysis because esti-mation and probing of network topology required very stable experimental conditions (SOM). The connectivity of the networks imaged at x20 was also distributed as a power law with an average
scaling factor of–1.1 T 0.1 (n = 45 slices; Fig.
1 and SOM). HC neurons were preferentially located in the stratum oriens and lucidum at the
two borders with the pyramidal cell layer (Fig. 1B3 and fig. S3B3). To test the contribution to net-work dynamics of neurons with different degrees of connectivity, we targeted cells covering the
entire connectivity range (Figs. 2 and 3,n = 20 HC
and 25 LC neurons). Neurons were recorded in current-clamp conditions and stimulated while im-aging population activity. Two stimulation protocols were applied for each neuron (SOM): (i) a phasic stimulation [short suprathreshold current pulses
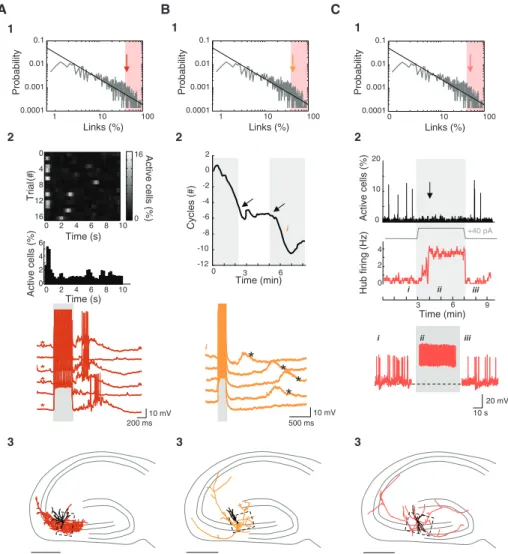
A B LC Neuron HC Neuron 1 1 Links (%) Probability 0.0001 0.001 0.01 0.1 10 100 1 Time (min) 0 100 200 300 400 500 0 2 4 6 8 in te rG DP in te rv a l (% ) Cell stim. 2 2 3 3 Links (%) Probability 0.0001 0.001 0.01 0.1 10 100 1 int e rG DP in te rva l( % ) Time (min) Cell stim. 0 100 200 300 400 500 0 2 4 6 8 (Dlink/Dm ax)* 1 0 0 1 HC LC 0 2 4 6 8 Axonal length (mm )
**
2 C HC4 HC3 HC5 HC8 HC6 HC2LC7 LC4 LC6 LC3 LC8 LC5 LC1HC7LC2HC1 0 20 40 60 80 100 120 sl so sl so*
*
0 1 a. u . 0 1 a. u .Fig. 2. Stimulation of HC but not LC neurons affects network dynamics. (A) Data from a representative LC interneuron. (1) The green arrow indicates the position in the pooled power-law distribution of output links (Fig. 1B) of the recorded neuron. Red-shaded area indicates the HC region, considering a 40% probability threshold. The right contour plot shows the position (solid red dot) and output connections (gray lines) of the
illustrated LC interneuron. sl, stratum lucidum; so, stratum oriens. Scale bar, 100mm. (2) Phasic
current-clamp stimulation (200-ms pulses of 75-pA current every 10 s, gray area) of the LC interneuron while being imaged did not affect the occurrence of GDPs (detected from the calcium activity). The interval between GDPs as a function of time is plotted. Values are expressed relative to the average interval between GDPs calculated before the stimulation period. (3) Neurolucida reconstruction of the recorded cell on a schematic representation of the hippocampus reveals an interneuron-like morphology displaying a local axonal arborization (green). Dendritic arborization is black. The black rectangle marks the imaged region. Scale bar,
500mm. This is a color-coded representation of the functional connectivity map [same as (A1)] (SOM)
overlaid with the axonal morphology (green) of the cell. The asterisk indicates the cell body position. Red represents high cell density (a.u., arbitrary units). (B) Same as (A) but for a representative HC interneuron. Phasic stimulation of the HC interneuron [same protocol as (A2)] significantly decreased GDP frequency [(2), P < 0.05]. The recorded cell displayed a widespread axonal arborization (red) spanning locally toward the cells functionally connected [(3), right panel] and further toward the dentate gyrus and the CA1 region [(3), left panel]. (C) (1) Cluster analysis tree of the morphological variables describing the 16 recorded and
imaged interneurons (Ward’s method, Dlink: Euclidian distances, see SOM). Distances were normalized. Most
HC and LC interneurons (based on the analysis of the imaging data) segregated in two different groups. (2)
The total axonal lengths of HC and LC interneurons were statistically different (P < 0.01).
on December 4, 2009
www.sciencemag.org
repeated at 0.1 to 0.2 Hz (the frequency range of GDPs occurrence)]; and (ii) tonic stimulation (con-tinuous positive or negative current injections, bringing the cell to a membrane potential where it fired continuously or was completely silenced, respectively). Cell/network interaction was esti-mated using three metrics (SOM): (i) the frequency
of occurrence of spontaneous network synchroniza-tions (GDPs) during the stimulation relative to the resting condition; (ii) the peristimulus histogram plotting the average fraction of cells activated by the phasic stimulation; and (iii) the phase precession/ succession of GDPs relative to a harmonic oscillator
mimicking GDPs’ rhythm in resting conditions; in
this way, the number of observed versus expected GDPs was estimated over time (SOM). A cell was considered as affecting network dynamics signif-icantly if it satisfied any of the above criteria.
About a third (8 out of 20 neurons) of the targeted HC cells exhibited a significant cell/ network interaction (Figs. 2B and 3). In contrast, no LC neuron but one showed any significant cell/network interaction (24 out of 25 neurons; Fig. 2A and fig. S2A). The effects of neurons significantly affecting network dynamics (n = 9) could be summarized as follows (Fig. 3): (i) in four cases, tonic or phasic stimulation induced sus-tained action potential (AP) firing that
signifi-cantly decreased the occurrence of GDPs to 48T
13% of resting conditions (P < 0.05; Figs. 2B and
3C and movie S1); (ii) in three cells, phasic stimulation triggered network synchrony in the
form of GDPs in 37T 4% of the trials within 1 s
after the stimulus (P < 0.05; Fig. 3A and fig. S5);
(iii) in three cells, phasic stimulations induced a phase succession of GDPs as compared to resting
conditions (Fig. 3B, P < 0.05). Our evidence
suggests that these neurons may act like func-tional hubs. We will henceforth refer to these as hub neurons.
The developing hippocampal network com-prises two major cell types: pyramidal
glutama-tergic cells and g-aminobutyric acid–releasing
(GABAergic) interneurons. In adult cortical structures, network function is strongly modu-lated by the action of GABAergic interneurons that represent a minority of the total population but include a variety of subtypes (28). Half of the experiments were performed in GAD67-GFP KI
mice (29) to selectively identify GABAergic
neurons. All hub neurons recorded in GAD67-GFP KI mice, based on their HC index, were
GFP-positive (fig. S3,n = 4). Accordingly, the
fraction of GFP-positive cells was four times higher in the HC region than in the total cell population (22% of HC neurons versus 6% of all
neurons,n = 46 movies in GAD67-GFP KI mice).
Therefore, hub neurons are GABAergic, and we next examined whether they represented a specific morphological population. While being recorded, cells were filled with biocytin. All nine hub cells were aspiny neurons and often possessed multi-polar dendrites and a cell body located at the border between the pyramidal cell layer and the stratum oriens or lucidum. All HC neurons that were not hubs were morphologically identified as pyramidal cells (fig. S2; 4 cells reconstructed). LC cells not influencing network dynamics exhibited either interneuronal or pyramidal cell morpholo-gy (Fig. 2 and fig. S2). All hub neurons had dis-tinctive morphological features, displaying a widespread axonal arborization that most often crossed subfield boundaries, running parallel to principal cell layers toward both the dentate
gyrus and CA1 region (n = 6 of 9 neurons, Figs. 2
and 3). Three of the hub cells exhibited dense preferential innervation of the CA3 principal cell
layer, suggesting a perisomatic, basketlike (28)
interneuron subtype (Fig. 3A and fig. S3B2). We
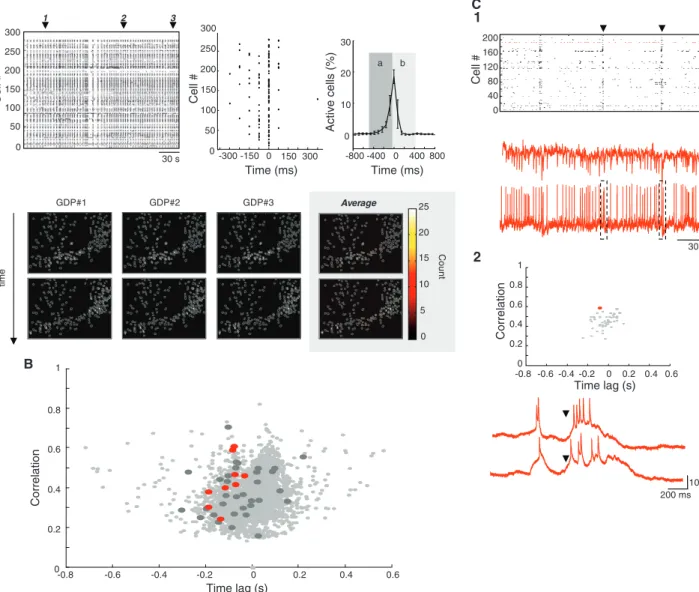
A B 1 1 1 2 * * * * * * * * 200 ms 4 8 12 16 0 2 4 6 8 10 0 16Activ e cells (%) Trial (# ) Time (s) Activ e cells (%) 0 2 4 6 Time (s) 0 2 4 6 8 10 Links (%) Probability 0.0001 0.001 0.01 0.1 10 100 1 Links (%) Probability 0.0001 0.001 0.01 0.1 10 100 1 Probability Links (%) 0.0001 0.001 0.01 0.1 10 100 0 2 2 0 0 -12 -10 -8 -6 -4 -2 0 2 3 6 Cy cle s ( # ) Time (min) i 20 mV Hu b firin g (Hz) 0 10 20 Activ e cells (%) +40 pA 0 2 4 3 6 9 Time (min) i ii iii 3 3 500 ms i
*
*
*
*
10 mV 10 mV i ii iii 10 s 3 CFig. 3. Perturbations of network dynamics induced by the stimulation of HC interneurons. (A) Data
obtained from a HC interneuron triggering network synchrony (P < 0.05). Frame rate, 10 Hz. (1) The red
arrow indicates the position in the pooled power-law distribution of output links (Fig. 1B) of the recorded neuron. (2) Fraction of cells active as a function of time after repetitive phasic stimulation (200-ms pulses of 100-pA current every 10 s) of the HC interneuron (16 consecutive trials). The peristimulus time histogram shows the average across different trials. Red traces are current-clamp recordings from the stimulated HC neuron for six consecutive stimulations (gray). Four out of six trials (indicated by red asterisks in lower panel) triggered GDPs appearing as polysynaptic membrane potential depolarizations. (3) Neurolucida reconstruction of the recorded HC cell on a schematic drawing of the hippocampus. Axonal arborization is in color; dendrites are black. The dashed rectangle indicates the imaged region.
Scale bar, 500mm. (B) Same as (A) but for a HC interneuron inducing a phase succession of GDPs when
stimulated (P < 0.05). Phase succession is illustrated in the top graph of (2) plotting the number of GDP
cycles skipped during phasic stimulation (gray) as a function of time. The number of expected GDPs was calculated during resting conditions (white) based on the average interval between GDPs. Arrows indicate transitions between oscillatory regimes. Current-clamp recordings from five consecutive stimulation trials for the period marked by (i) show the progressive delay in the occurrence of a GDP (black asterisks) after stimulation (gray). (C) Same as (A) but in a HC interneuron preventing GDPs when stimulated. Graphs in (2) show the fraction of active cells (top histogram), as well as the cell firing frequency (middle), as a function of time. Peaks of synchronous activity (GDPs) disappear when the membrane potential of the cell (bottom) is depolarized by continuous positive current injection (40 pA; SOM). Current-clamp traces show the activity in the HC neuron in resting (i and iii) and stimulated (ii, gray) conditions. The black arrow
indicates the time when a significant effect on network dynamics starts (P < 0.05).
www.sciencemag.org SCIENCE VOL 326 4 DECEMBER 2009 1421
REPORTS
on December 4, 2009
www.sciencemag.org
next performed a multivariate analysis of the morphometric data of eight HC and eight LC interneurons (SOM). Hub interneurons signifi-cantly differed from LC interneurons by the length
of their axonal tree (6865T 1238 mm versus
2150T 483 mm, P < 0.01, n = 16 cells, Fig. 2).
Given their extended morphology, it seems prob-able that hub neurons have a higher probability of being severed in brain slices than other cells and thus probably represent a higher fraction of neu-rons in vivo [but see (20)]. We conclude that functional hubs are GABAergic interneurons with a long axonal arborization. Hub neurons
therefore have the features required to activate many postsynaptic targets.
In order to determine the nature of the func-tional link between hub neurons and other cells, we first asked whether stimulation of hub neu-rons could directly trigger a calcium response in other neurons, even in the case where the net effect of stimulation was to desynchronize activ-ity. We thus compared functional and effective connectivity maps (SOM and fig. S4). We found that there was a large overlap between the two
maps in the case of HC interneurons (53T 6% on
average, n = 5), whereas stimulation of HC
pyramids activated only 8T 1% of functionally
connected neurons (n = 5), indicating that these were effectively not connected to follower cells. We next performed targeted paired recordings from HC and follower neurons (n = 16 pairs). In the case of HC interneurons, we observed a 37% probability of finding a monosynaptic GABAergic connection between neurons (n = 8 pairs, fig. S5). This was significantly different from the case of HC pyramidal cells, because no direct connec-tion could be revealed when recording from them
(n = 8 pairs, P < 0.05, Wilcoxon-Mann-Whitney
two-sample rank test). This is in agreement with
A 1 -800 -400 0 400 800 0 10 20 30 Activ e cells (%) Cell number 0 50 100 150 200 250 Cell # 300 1 2 3 Fraction of cells 0 0 50 100 150 200 250 Cell # 300 0 5 10 15 20 25 Average time Time (ms) 30 s -300-150 150 300 Time (ms) a b 2 GDP#1 GDP#2 GDP#3 C ount B C 1 0 40 80 120 160 200 30s Cell # 10 mV 10%DF/F 200 ms 2 Time lag (s) Correl ati o n -0.8 -0.6 -0.4 -0.2 0 0.2 0.4 0.6 0 0.2 0.4 0.6 0.8 1 -0.6 0 Time lag (s) -0.8 0.4 0.6 0.8 1 Correl ati on 0.2 0 -0.4 -0.2 0.2 0.4 0.6 10 mV
Fig. 4. Hub neurons are activated at the onset of spontaneous network synchronizations. (A) (1) Raster plot of the onsets of calcium events in a representative movie (frame rate, 20 Hz). There are many spontaneous GDPs appearing as broken vertical lines in the raster plot. The middle raster plot shows GDP1 on an expanded time scale. The right plot represents the average temporal profile of the fraction of cells sequentially activated in all GDPs recorded in the same network. The peak of cell coactivation was used as zero time reference. Error bars indicate SDs. (2) Contour plots showing cells activated during the buildup [region a in (1)] and at the peak (b) for the three GDPs marked by arrows in the raster plot in (1). Note the similarity between the patterns of cells. Color-coded contour plots on the right quantify how many times a cell is recruited in one of the two temporal windows over 25
representative GDPs. (B) Time-correlation graph (SOM), plotting for each imaged neuron (7588 neurons) the average correlation and average time of activation relative to all other cells. Red dots indicate targeted functional hubs and dark gray dots indicate all other recorded neurons. (C) (1) Raster plot [calculated as in (A1)] of the network activity (frame rate, 6.67 Hz) while recording an HC hub neuron (red dots) in current-clamp mode (bottom trace). Calcium events (top trace) reflect spiking activity (bottom trace). (2) Same time-correlation graph as in (B) but only for the recorded slice shown in (C1). The red dot marks the HC hub neuron. Red traces show current-clamp recordings of spontaneous activity in the hub neuron at the time of two different GDPs [marked by arrowheads; dashed rectangles in (C1), lower panel]. AP firing occurs in the hub neuron about 200 ms before GDPs.
on December 4, 2009
www.sciencemag.org
the imaging data and comparable to the highest synaptic connectivity rates reported for inter-neurons in the adult cortex (21). It therefore rep-resents a high value given the fact that all the monosynaptically connected neurons were more than 100 mm apart (the average distance between
recorded neurons was 130T 20 mm, n = 16 pairs,
fig. S5) and that the connection probability is very likely to increase with age (30, 31). We conclude that the functional connectivity of hub neurons is supported by an effective synaptic connectivity and propose that HC pyramidal neurons are more likely to operate within assemblies (32).
Because hub function may depend on differ-ences in cellular excitability or synaptic strength (33, 34), we next examined the basic electrophysio-logical properties of hub neurons as compared to LC interneurons (Table 1). Of the basic features an-alyzed (SOM), hub neurons received more sponta-neous excitatory postsynaptic potentials (EPSPs) and
had a lower threshold for AP generation (Student’s
t test, P < 0.05). A lower AP threshold could in-dicate a more advanced maturation stage for hub
neurons (35). Both properties should result in a more
efficient activation of hub neurons by synaptic inputs. Finally, because stimulation of hub neurons significantly affected the occurrence of GDPs, we examined their specific involvement in the spontaneous synchronization process. In
agree-ment with previous estimates (36), the dynamic
of a single GDP was characterized by a buildup
of activity lasting on average 350 ms (Fig. 4,n =
8 slices, SOM). Using cluster analysis (SOM), a stereotypical spatiotemporal synchronization pat-tern accounted for one-third of the GDPs within
the recording period (33T 2%, n = 45, Fig. 4).
For each neuron, we estimated the average cor-relation and time of activation relative to all other cells in GDPs that clustered together (Fig. 4 and
SOM). In almost half of the movies (n = 20 out of
45), the time correlation graph presented a bi-modal distribution (Fig. 4B), indicating that GDPs repetitively started synchronizing neurons plotted on the left side of the distribution, whereas neurons on the right were activated last. By
pooling the data from different slices (n = 7588
neurons, 45 movies), we found that the majority
of functional hubs clustered on the upper left region of the graph, indicating a more reliable activation at the onset of GDPs (Fig. 4B); this is in agreement with the lower AP threshold and higher synaptic drive described above. Other recorded neurons were evenly distributed across the correlation plot. Cell-attached and whole-cell recordings confirmed that cells activated at the buildup of synchronization indeed fired APs before the occurrence of GDPs (n = 14 neurons, fig. S1C). AP firing in hub neurons thus predicts network synchronization in the developing CA3 region.
This study shows that a scale-free topology can underlie synchronous network patterns in living cortical networks. We suggest that hub neu-rons, composed of a subpopulation of GABAergic interneurons, orchestrate spontaneous network synchronization. Two different morphological types of hub neurons could be distinguished within our sample data set: (i) cells displaying a long axon spanning regions with sparse collater-als, and (ii) basketlike neurons with a dense but more local arborization pattern. Network synchro-nization could be triggered by phasic stimulation only in basketlike hub neurons (Fig. 3A and fig. S5). In the adult hippocampus, long-range projecting GABAergic hippocampal interneurons have been described (37) and their hub function has been suggested but never been probed (4). Perhaps the long-axon hub neurons act as connector hubs, whereas basketlike hubs have a local hub function (19). Regardless, the present results confirm the crucial role of GABAergic transmission in shaping network patterns at early developmental stages, when GABA exerts a complex excitation/
shunting inhibition action (38, 39). The
sponta-neous activation, before synchrony, of hub neu-rons with many direct postsynaptic connections is compatible with excitatory actions of GABA. However, hub cell stimulation also often slowed down network oscillations and in some extreme cases completely desynchronized activity. One possible explanation is that the shunting actions of GABA retard or prevent synchronization. How-ever, other possibilities cannot be excluded, in-cluding a phase-resetting effect by which a hub cell can either advance or delay bursting in
intrinsically oscillating neurons (39), depending
on their phase at the time of the hub input (40).
Single neurons can trigger population syn-chronization in the disinhibited adult CA3 region (41) or elicit a chain of cell activation in the cortex that can translate into behavior or switch
the global brain state (42–44). Therefore, the
demonstration that hub neurons functionally op-erate in the brain helps bridge the gap between single-cell and network activity. This finding should facilitate the investigation of the mecha-nisms by which many physiological and patho-logical network oscillations are generated.
References and Notes
1. G. Buzsáki, Rhythms of the Brain (Oxford Univ. Press, Oxford, 2006).
2. L. C. Katz, C. J. Shatz, Science 274, 1133 (1996). 3. Y. Ben Ari, Trends Neurosci. 24, 353 (2001). 4. G. Buzsaki, C. Geisler, D. A. Henze, X. J. Wang, Trends
Neurosci. 27, 186 (2004).
5. G. Grinstein, R. Linsker, Proc. Natl. Acad. Sci. U.S.A. 102, 9948 (2005).
6. R. J. Morgan, I. Soltesz, Proc. Natl. Acad. Sci. U.S.A. 105, 6179 (2008).
7. D. J. Watts, S. H. Strogatz, Nature 393, 440 (1998). 8. A. L. Barabasi, R. Albert, Science 286, 509 (1999). 9. S. Boccaletti, V. Latora, Y. Moreno, M. Chavez,
D.-U. Hwang, Phys. Rep. 424, 175 (2006).
10. L. A. Amaral, A. Scala, M. Barthelemy, H. E. Stanley, Proc. Natl. Acad. Sci. U.S.A. 97, 11149 (2000).
11. R. L. Buckner et al., J. Neurosci. 29, 1860 (2009). 12. V. M. Eguiluz, D. R. Chialvo, G. A. Cecchi, M. Baliki,
A. V. Apkarian, Phys. Rev. Lett. 94, 018102 (2005). 13. D. Eytan, S. Marom, J. Neurosci. 26, 8465 (2006). 14. O. Sporns, C. J. Honey, R. Kotter, PLoS One 2, e1049 (2007). 15. D. J. de Solla Price, Science 149, 510 (1965). 16. E. V. Lubenov, A. G. Siapas, Nature 459, 534 (2009). 17. K. V. Srinivas, R. Jain, S. Saurav, S. K. Sikdar,
Eur. J. Neurosci. 25, 3276 (2007).
18. S. Yu, D. Huang, W. Singer, D. Nikolic, Cereb. Cortex 18, 2891 (2008).
19. E. Bullmore, O. Sporns, Nat. Rev. Neurosci. 10, 186 (2009). 20. S. Song, P. J. Sjostrom, M. Reigl, S. Nelson,
D. B. Chklovskii, PLoS Biol. 3, e68 (2005).
21. A. M. Thomson, C. Lamy, Front. Neurosci. 1, 19 (2007). 22. N. C. Spitzer, Nature 444, 707 (2006).
23. A. A. Cattani, V. D. Bonfardin, A. Represa, Y. Ben-Ari, L. Aniksztejn, J. Neurophysiol. 98, 2324 (2007). 24. M. Canepari, F. Mammano, S. G. Kachalsky, R. Rahamimoff,
E. Cherubini, Cell Calcium 27, 25 (2000).
25. L. Menendez de la Prida, S. Bolea, J. V. Sanchez-Andres, Eur. J. Neurosci. 10, 899 (1998).
26. V. Crepel et al., Neuron 54, 105 (2007). 27. S. Bolea, J. V. Sanchez-Andres, X. Huang, J. Y. Wu,
J. Neurophysiol. 95, 552 (2006).
28. T. F. Freund, G. Buzsáki, Hippocampus 6, 347 (1996). 29. N. Tamamaki et al., J. Comp. Neurol. 467, 60 (2003). 30. D. Doischer et al., J. Neurosci. 28, 12956 (2008). 31. L. Groc, B. Gustafsson, E. Hanse, Eur. J. Neurosci. 17,
1873 (2003).
32. K. D. Harris, J. Csicsvari, H. Hirase, G. Dragoi, G. Buzsaki, Nature 424, 552 (2003).
33. L. Wittner, R. Miles, J. Physiol. 584, 867 (2007). 34. F. Strata et al., J. Neurosci. 17, 1435 (1997). 35. S. Rheims et al., J. Neurophysiol. 100, 609 (2008). 36. L. M. Prida, J. V. Sanchez-Andres, J. Neurophysiol. 82,
202 (1999).
37. S. Jinno et al., J. Neurosci. 27, 8790 (2007). 38. Y. Ben-Ari, J. L. Gaiarsa, R. Tyzio, R. Khazipov, Physiol.
Rev. 87, 1215 (2007).
39. S. T. Sipila, K. Huttu, I. Soltesz, J. Voipio, K. Kaila, J. Neurosci. 25, 5280 (2005).
40. H. Y. Jeong, B. Gutkin, Neural Comput. 19, 706 (2007). 41. L. M. de la Prida, G. Huberfeld, I. Cohen, R. Miles,
Neuron 49, 131 (2006).
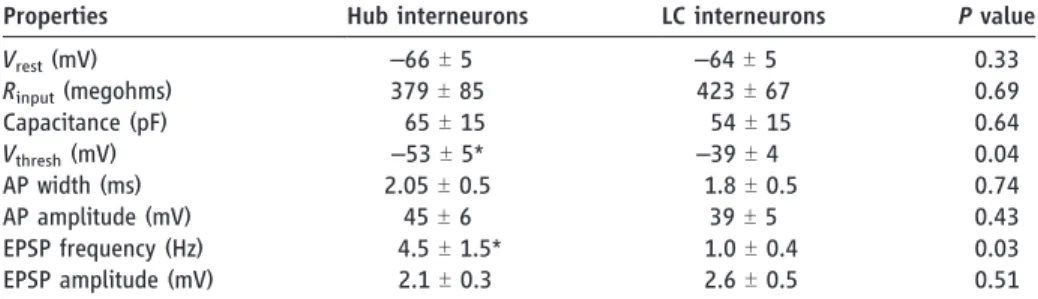
Table 1. Comparison of basic electrophysiological properties of hub neurons and LC interneurons. Measurements were obtained from whole-cell recordings in eight hub and eight LC interneurons
(see SOM methods). Vrest, resting membrane potential (corrected value; SOM); Rinput, input
resistance;Vthreshold, AP threshold (corrected value; SOM); AP width, AP width measured at
half-maximal amplitude. Asterisks indicate significant differences.P < 0.05 was considered significant.
The right column indicates theP value given by Student or Mann-Whitney tests.
Properties Hub interneurons LC interneurons P value Vrest(mV) –66 T 5 –64 T 5 0.33 Rinput(megohms) 379T 85 423T 67 0.69 Capacitance (pF) 65T 15 54T 15 0.64 Vthresh(mV) –53 T 5* –39 T 4 0.04 AP width (ms) 2.05T 0.5 1.8T 0.5 0.74 AP amplitude (mV) 45T 6 39T 5 0.43 EPSP frequency (Hz) 4.5T 1.5* 1.0T 0.4 0.03 EPSP amplitude (mV) 2.1T 0.3 2.6T 0.5 0.51
www.sciencemag.org SCIENCE VOL 326 4 DECEMBER 2009 1423
REPORTS
on December 4, 2009
www.sciencemag.org
42. M. Brecht, M. Schneider, B. Sakmann, T. W. Margrie, Nature 427, 704 (2004).
43. G. Molnar et al., PLoS Biol. 6, e222 (2008). 44. C. Y. Li, M. M. Poo, Y. Dan, Science 324, 643 (2009). 45. We thank D. Aronov, M. Colonnese, J. Epsztein,
B. Fernandez, G. Fishell, C. Holmgren, B. Gutkin, M. Milh, and R. Khazipov for helpful suggestions and critical comments; C. Allene, K. Bennouar, and F. Michel for help with the experiments; and K. Obata and K. Vogt for
kindly providing GAD67-EGFP Ki mice. This work was supported by grants from INSERM, the Ville de Marseille and Region Provence Alpes Côte d’Azur, the Fondation pour la Recherche Médicale, the Agence Nationale pour la Recherche, the Fondation pour la Recherche sur le Cerveau, and the Fondation Bettencourt Schueller. R.C. and A.R. were funded by the CNRS. M. Goldin and P. Bonifazi were funded by Framework Program 6 (FP6) and FP7–Intra-European Fellowships for career development.
Supporting Online Material
www.sciencemag.org/cgi/content/full/326/5958/1419/DC1 Materials and Methods
Figs. S1 to S5 References Movie S1
27 April 2009; accepted 23 September 2009 10.1126/science.1175509
Deletion of Atoh1 Disrupts Sonic Hedgehog
Signaling in the Developing Cerebellum
and Prevents Medulloblastoma
Adriano Flora,1Tiemo J. Klisch,1,2Gabriele Schuster,1Huda Y. Zoghbi1,2,3,4*
Granule neuron precursors (GNPs) are the most actively proliferating cells in the postnatal nervous system, and mutations in pathways that control the GNP cell cycle can result in medulloblastoma. The transcription factor Atoh1 has been suspected to contribute to GNP proliferation, but its role in normal and neoplastic postnatal cerebellar development remains unexplored. We show that Atoh1 regulates the signal transduction pathway of Sonic Hedgehog, an extracellular factor that is essential for GNP proliferation, and demonstrate that deletion of Atoh1 prevents cerebellar neoplasia in a mouse model of medulloblastoma. Our data shed light on the function of Atoh1 in postnatal cerebellar development and identify a new mechanism that can be targeted to regulate medulloblastoma formation.
D
isruption of the delicate balance betweenproliferation and differentiation in cere-bellar granule neuron precursors (GNPs) underlies medulloblastoma, the most common
pediatric tumor of the nervous system (1, 2). A
class of particularly aggressive medulloblastomas associated with very poor prognosis show high
expression of Atoh1 (3), a transcription factor
highly expressed in GNPs also known asMath1
(4), and recent in vitro studies proposed that Atoh1 might be involved in neoplastic
prolifera-tion (5, 6). Given that deletion of Atoh1 in mice
results in perinatal death (7), the function of this transcription factor in the developing postnatal cerebellum has remained opaque.
To deleteAtoh1 in the postnatal developing
cerebellum, we crossedAtoh1flox/floxmice (8) with
mice carrying the gene coding for a
tamoxifen-inducible Cre recombinase in the Rosa locus
(R26CreER) (9) and a null allele of Atoh1
(10, 11). After activation of Cre by tamoxifen,
RosaCreER;Atoh1+/flox
animals (designated here as
Atoh1wt
) maintain one functional allele ofAtoh1,
whereasRosaCreER;Atoh1–/floxmice (designated
here asAtoh1D) loseAtoh1 expression. We
in-jected postnatal day 3 (P3) animals and analyzed
their cerebella 3 days later. Nissl staining of matching sections of the external granule layer (EGL), the neuroepithelium formed by GNPs,
revealed thatAtoh1Danimals had a much thinner
EGL than that of theirAtoh1wtlittermates (fig.
S1). Using phospohistone H3 staining to
visual-ize theM phase of the cell cycle and Tuj1 for
neural differentiation, we found that the EGL of
Atoh1D
mice had been depleted of cycling im-mature precursors (Fig. 1, A and B, and fig. S2). Staining for active caspase 3 did not reveal any
apoptosis in the EGL ofAtoh1Dmice (fig. S1, E
and F). We thus investigated whether deletion of Atoh1 triggers the GNP differentiation to granule neurons or induces these cells to transdifferen-tiate to other cell types. Shown in fig. S2, cells
still populating the surface of Atoh1Dcerebellum
that had deleted Atoh1 still expressed Zic1, a marker of differentiating postmitotic EGL cells and mature granule neurons, making transdiffer-entiation unlikely. Proliferating GNPs express Pax6 at low levels, whereas differentiating
post-mitotic precursors show high expression ofPax6
and turn on the neural differentiation marker NeuN. The cells residing on the surface of the
cerebellum of Atoh1D expressed high levels of
1Department of Molecular and Human Genetics, Baylor
Col-lege of Medicine, Houston, TX 77030, USA.2Howard Hughes
Medical Institute, Baylor College of Medicine, Houston, TX 77030, USA.3Departments of Neuroscience and Pediatrics, Baylor College of Medicine, Houston, TX 77030, USA.4
Pro-gram in Developmental Biology, Baylor College of Medicine, Houston, TX 77030, USA.
*To whom correspondence should be addressed. E-mail: [email protected]
Fig. 1. Atoh1 deletion disrupts GNP proliferation and induces differentiation. (A and B) Phosphohistone H3 staining of cerebella of animals injected with tamoxifen. (Left) Nissl staining of cerebella of animals injected with tamoxifen. The boxed regions represent the images to their right, showing the staining for
phosphohistone H3. The arrow in (B) indicates a single cycling cell in the Atoh1DEGL. (C and D) Pax6 and
NeuN staining shows the immature GNPs [(C), white bar] not expressing NeuN and the differentiating population [(C) and (D), between the yellow dotted lines] coexpressing both markers. The colocalization pattern is shown on the bottom right.