DEVELOPMENT OF A QUADRUPOLE IASS SPECTROMETER by
CHARLES EDWARD WOODWARD
B.S., Iowa State College
, or-7\
-I Ly3 ) J
S.M., Massachusetts Institute of Technology (1960)
SUBMITTED IN PARTIAL FULFILLMENT OF THE REQUIREMENTS FOR THE DEGREE OF
DOCTOR OF PHILOSOPHY at the
MASSACHUSETTS INSTITUTE OF TECHNOLOGY June, 1964
Signature of Author ...,. Department of Electrical Engineering, May 15, 1964
Certified by
...
t~,
...
-V (
Thesis SupervisorAccepted
by
...
.
...
-
,,
... ... ....
DE10VELO P ENT OF A QUADRUPOLE ASS SPECROETLER by
CIRLS EDWARD tWOOhIARD
Submitted to the Department of Electrical Engineering on May 15, 1_64, in partial fulfillmnent o the require-ments for the degree of Doctor of Philosophy
ABSTRACT
The thesis project was the development of electronic circuits for a moderate-resolution quadrupole mass spectrometer intended as a flexible laboratory instrument to cover I to 400 amu in four ranges.
Extension of the theory of the quadrupole mass filter showed That high transverse ion momenta pose significant problems in ion collection.
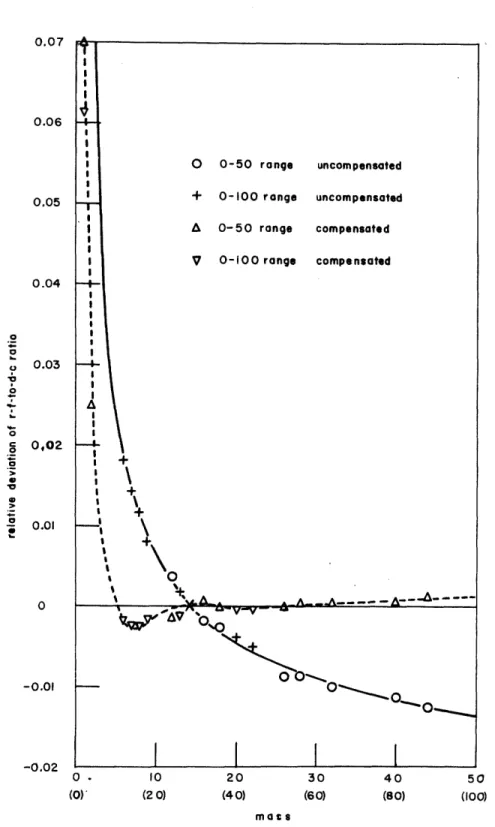
The electronic circuits that supplied voltages to the mass filter were capable of 50:1 spectral range sweeps in 0.1 sec, but resolution over a wide sweep range was limited by nonlinearity in the control of the r-f voltage. Compensation reduced the nonline-arity over a 10:1 sweep range from 4% to 0.4.
The electron-multiplier ion collector of the spectrometer was operated in a particle-detection mode to eliminate the effects of multiplier gain variations. The theory of coincidence losses in
such particle-detection systems was extended to a nonparalyzable counter following a pulse-stretching amplifier. A "delay-line" ratemeter was shown to possess certain signal-to-noise advantages over the conventional R-C output circuit, but practical limitations eliminated these advantages. Pulse circuits with resolving times better than 5 x 0-3 sec were used in the particle-detection system.
Mechaxnical imperfections in the quadrupole lens limited spectrometer resolution to m/Am = 40. The ultimate sensitivity was a partial pressure of 10-11 torr.
Thesis Supervisor: Arthur R. von Hippel
ACIT OWInXDGEMEN TS
The author 'ishes to express his appreciation to Professor A. R. von ippel for his support,. advice and encouragement.
Thanks are expressed to Professor C.K. Crawford for initiating and sustaining the quadrupole mass spectro-meter project, as well as for designing and constructing all parts of the instrument that are characterized by the term "physical electronics."
Recognition is due Messrs. Juri Klonizchii and
Modesto Maidique for construction of some of the apparatus, to other members of the Laboratory for Insulation Research who have assisted in the project, and to those who helped prepare the manuscript: Messrs. John Mara, Douglas Nicoll, and Michael Hale. who drew many of the figures, and Miss
iv
TABLE OF CONTENTS Abstract ... Acknowledgements ... List of Figures ... List of Tables ... . e . . .eI·itlt1®.I. The Electric-Quadrupole Mass Spectrometer ... A. The mass filter ... B. Ion source ... .... C. Ion collector ... ... . II. Theory of the Quadrupole Mass Filter ...
A. Description of operation .... ... ... B. Equations of motion .... .. .. .. ...
C. Mass-filter operation ... D. Design considerations ...
III. Mass Spectrometer Construction .. ... A. Quadrupole lens ... B. Ion source ... ... ... ...
C. Electron multiplier ... ...
D. Vacuum system ... 0... IV. Electronic Drive Circuits for the Mass Filter ...
A. Circuit requirements ... B. Control generator ... ... ... C. R-f rod driver ...
D. D-c rod driver ... .. ... V. Design Considerations for the Electron-Multiplier Ion
Detector
A. Introduction ... ... ...g.... B. The electron multiplier as a current amplifier... C. The electron multiplier as a particle detector .... D. Spectrometer output noise ... E. Pulse signal processing ...*... F. Linear signal processing ...
Page ii iii vi viii 1 3 7 7 9
9
9
19 28 .35 35 39 40 4647
47 49 54 79 84 8586
90 97 108 ... 6 . . . * . . .0. .. 4 0 * .. . . . .. . . ... . .. . . . . .. 0 · · · · · · · · · r · · · · · · · · r·vJ
Table of Contents (cont.)
Page
VI. Electron-Multiplier Ion Detector ... 125
A. System characteristics ... . 125
B. Pulse system ... .. .... ... 151
C. Output processor ... 161
VII. Mass-Spectrometer Performance . ... 166
A. Line shape ... 166
B. Resolving power ... 169
C. Mass spectra ... ... 171
VIII. Conclusions .... ...
...
175A. Summary of work ... ... 175
B. Suggestions for future work ... ... 178
Appendix A. Coefficients in Series Expansion of Solutions 183 of Mathieu's Equation Appendix B. Tank Coil Design ... 186
Appendix C. Symmetric Signals in Balanced, Inductively 198 Coupled Circuits Appendix D. Self-Checking Balance Detector Algorithm 201 Appendix E. Pulse-System Test Apparatus ... 204
References .... ... ... 209
LIST OF IGURES
Page 1.1. The electric-quadrupole mass spectrometer. 2 2.1. Stable ion trajectories in the mass filter. i0 2.2. Quad-rupole-mass filter electrodes. 11 2.3. Stability diagram for quadrupole mass filter. 14
2.4. x and y trajectories. 17
3.1. Quadrupole lens. 36
3.2. Ion source. 41
3.. Ion-source circuit diagram. 42
73.4. Electron multiplier. 43
3.5. Electron-multiplier structure. 44
4.i. Block diagram of mass-filter circuits. 48 4.2. Block diagram of control generator. 50 4.5. Circuit diagram of control generator. 51
4.4. Circuit diagram of r-f rod driver. 55
4.5. Deviation of r-f to d-c ratio. 73
4.6.
Circuit diagram of d-c rod driver. 805.1. Distribution in amplitude of ion-electron-multiplier 91 output pulses.
5.2. Probability distribution of pulse amplitudes. 92
5.3.
Performance of counter systems. 1005.4. Delay-line ratemeter. 112
5.5.
Response of delay-line ratemeter. 1135.6.
Impulse response of ratemeter circuits. 1236.1. Differentiator-limiter performance. 130
6.2. Differentiator response. 132
6.35.
Ion-detector pulse system. 1336.4.
Electron-multiplier circuit. 135"List of Figures (cont.)
Page
6.-. Preamplifier circuit. !44
.7. Prearplifier performance. 147
6.8. Interstage limiting mplifiers. 150
6.9. Response of preamplifier-amplifier-limiter 152 chain to test pulses.
6.10. Pulse standardizer. 154
6.11. :Pulse standardizer output. 157
6.12. Response of preamplifier-amplifier-limiter 165 chain to electron-multiplier output pulses.
7.i. Spectral line shape. 167
7.2. Background-gas mass spectra. 172
8.1. Proposed high-linearity rectifiers. 181 B.1. Thned coupling transformer circuit. 186
B.2. Coupled-coil configuration. 193
C.l. Rod-driver output circuit. 199
C.2. Output circuit collapsed into simpler form. 199
D.i. Balance-detector flow graph. 201
E.l. Pulse-system test apparatus. 205
E.2. Pulse baseline cleaner. 207
viii
LIST OF TABLES
page
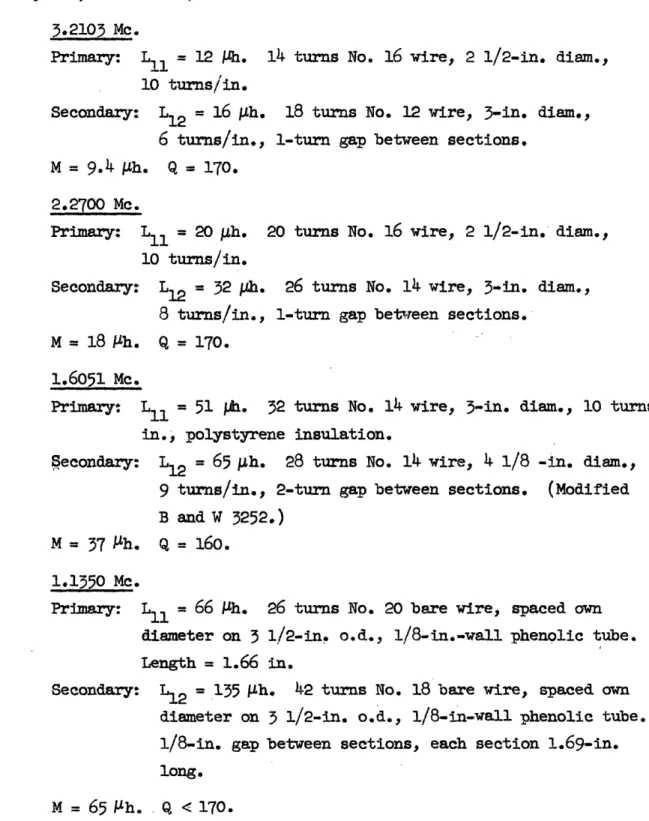
4.1. Buffer-output r-f transformers. 56
4.2. Output tank coils. 57
6.1. Pulse-system resolving times. 160
I. THE ELECTIRIC-QUADRUPOLE MASS SPECTROMETER
The purpose of this thesis was the development of a small mass spectrometer of modest resolving power m/Am (perhaps 500) but with sufficient flexibility to permit it to be easily applied to
such diverse problems as the thermal decomposition of dielectric materials and the study of electron-ionization cross sections of the vapor states of solids. The instrument was to be capable of
sweep-ing wide spectral ranges (up to 50:1) in relatively short time (as little as 0.1 second). An electric-quadrupole mass filter (which had been used by previous workers only in feasibility studies and
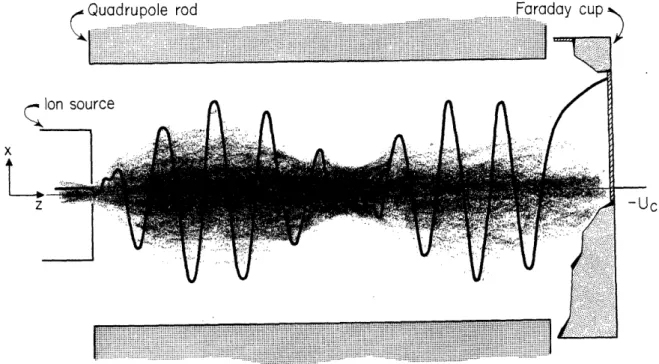
as a background-gas analyzer) was selected for this application and incorporated into a complete spectrometer system as shown in Fig. 1.1. Ions from an ion source are mass selected by the filter and then
detected by an ion collector. The mass spectrum is recorded on an oscilloscope or other recording device.
This thesis was part of a joint project with Professor
C.K. Crawford. Those parts of the spectrometer involving physical electronics (e.g., the ion source, quadrupole lens, ion collector, and vacuum system) were the responsibility of Professor Crawford; the associated electronic circuits were the responsibility of the author.
4a o 04 ax 0 re o 4 o 0I -4
A. The Mass Filter Principles of Operation
The mass-separation element of the spectrometer is the electric-quadrupole mass filter invented by Paul and his
co-workers at Bonn University.1-3 It consists of four long, parallel cylindrical electrodes, usually circular rods, with d-c and r-f voltages applied. Ions to be mass selected are injected along the axis of the electrode assembly. By a proper choice of applied voltages, ions in a specified mass-to-charge-ratio range (the pass band of the filter) traverse the quadrupole lens and are collected at the output end; other mass-to-charge-ratio ions are deflected sidewise. For operation as a mass spectrometer, the electrode voltages are varied so as to sweep out a mass spectrum as a func-tion of time.
The mechanical precision of the quadrupole lens sets an
upper limit on resolving power, but the precision of the quadrupole voltages is the practical limitation on the resolving power of a wide-range instrument. A major part of this thesis work was the development of circuits to provide precise voltages over wide mass-spectral ranges.
Comparison with other Mass Filters
Any new mass spectrometer has to compete with existing ones. While many different types exist, only two have gained wide
-
t4-spectrometer (single or double focussing), and the time-of-flight spectrometer, which operates by measuring the times required for isoenergetic ions to traverse a drift tube.
The magnetic-deflection and electric-quadrupole instruments use dispersion in space: All ions except those of the desired m/e ratio are discarded at some location other then the ion collector. In principle these two types of mass filters are interchangeable; the quadrupole could be replaced by a magnetic sector. The time-of-flight, in contrast, uses dispersion in time: All ions reach the collector; distinction is made by arrival time.
The great advantage of a time-of-flight instrument is that each mass spectrum is obtained in a short time (100 Isec in one commercial instrument). Hence spectra may be taken at a high rate (10 /sec) and rapidly change spectra, as from fast chemical re-actions, observed. On the other hand, because the source gas is ionized in a low duty cycle (0.25 sec per 100 sec collecting time), the effective sensitivity is lower than that of a spatial-filter instrument. This "sampling in time" also makes impractical experi-ments with modulated ion beams. Finally, at least at the present
state of the art, the time-of-flight mass spectrometer has a
resolution too low to permit distinction between masses differing by a fraction of a mass unit.
If one compares the two spatial-filter instruments in resolving power, the severe requirements on mechanical tolerances of the
quadrupole filter probably make it inferior. Resolving power up to m/Lm = 8000 has been achieved with great difficulty with the
quadrupole, ' while 500,000 has been reported for a magnetic in-5
strument. Commercial double-focussing magnetic instruments offer resolutions of 15,000, a value beyond the capability of a practical analytical-laboratory quadrupole instrument.
At high background-gas pressure the quadrupole may be poten-tially superior in resolution because collisions of ions with background gas in the magnetic filter disturb the orbits and
cause resolution degredation ("pressure broadening"). In the quadru-pole filter such collisions are less disturbing; an ion that should be rejected still has an unstable orbit after collision, and will be deflected to the side of the remaining length of the filter.6'7 )
A potential advantage of the quadrupole instrument in some applications is ease of resolution adjustment. In a magnetic filter a mechanical adjustment of the slit widths is required; in the quadru-pole filter onl a simple electrical adjustment. In fact, in the in-strument described in this thesis, it is possible to change resolu-tion systematically while sweeping a mass spectrum.
In this as in all other work at Bonn resolution is based on full line width at half maximum amplitude, which yields numerical values at least twice as high as from the more usual definitions based on line width near the base. For a better comparison with other instruments, all resolving powers reported by the Bonn group have been divided by 2 when used in this thesis. This has involved appropriate modification of a number of equations in the theory of the mass filter.
The quadrupole filter is extremely tolerant of the axial momentum of entering ions, requiring only that it be below some limiting value that ensures the ions stay in the filter long enough for mass selection. In a practical instrument this usual-ly means an axial momentum corresponding to 100 volts or less. The instrument is considerably more demanding with respect to transverse momentum (typical upper limit < 1 volt). However, in contrast to incorrect momenta in a magnetic filter, a transverse momentum even in excess of the limit degrades not the instrument resolution, but only the transmitted intensity. The quadrupole filter, in short, is more tolerant with respect to entrance con-ditions than the single-focussing magnetic instrument.
The absence of magnetic fields in the quadrupole filter permits greater freedom in source design, e.g., permits experi-ments with low-energy electrons, and makes it easier to use elec-tron multipliers as ion detectors.
The final test of the quadrupole mass spectrometer is the market place. The question is: Can a quadrupole instrument be manufactured with a resolution comparable to that of a large
single-focussing magnetic spectrometer (500 to 1000), but smaller and more convenient to use and not higher in cost? Results in the literature and in this thesis seem to give an affirmative answer to all but the last question. Cost comparison must await
-
7-analytical quality.
B, Ion Source
A conventional electron-bombardment source serves as ion source for the spectrometer. The material under study is vaporized in a Knudsen-cell oven and ionized by a transverse electron beam. Ions are extracted from the source region and injected into the mass filter.
8)
Much more elaborate sources have been built, but were not used in the work of this thesis.
C. Ion Collector
The ion current from the quadrupole filter could be collected by a Faraday cup at the exit and measured by an electrometer. In
that case instrument sensitivity and response speed are limited by the electrometer with its large time constant (order of seconds) given by input resistance and stray capacitance. The sensitivity
limitation is tolerable, but the response speed, since the instru-ment should allow sweeps of mass spectral lines in milliseconds, is not. The slow response can be overcome by use of an electron multi-plier as the ion collector. Its gain of more than 105 can yield an
output large enough to drive a recording device directly and its bandwidth of more than 100 Me is high enough for any response speed.
Unfortunately, the electron multiplier has its own drawbacks. The gain suffers slow degredation because of dynode surface
con-- 4
-tamination, and, even more serious, the yield of the first dynode depends on ion species, so apparent mass discrimination may be
introduced. These difficulties can be overcome, at least for the lower values of ion current, by using the multiplier not as a current amplifier but as a single-particle detector: Each ion
incident on the first dynode produces a pulse of output current that is amplified and either counted by digital devices or ardized in amplitude and width. The average current of the stand-ard pulses is a signal proportional to the input ion current.
The maximum ion current, or count rate, that can be handled by a particle-detecting electron-multiplier system is limited by
the response speed of the pulse-processing circuits. A major part of the work of this thesis was the development of an analog-output system handling rates up to 5 x 10⁶ ions/sec.
Because the ion currents detected by a particle-detector system are necessarily small, shot noise is a significant problem. It is therefore important to choose an output;system that will provide a maximum ratio of signal to noise. Work in this thesis
showed that the conventional resistance-capacitance low-pass
filter is the best practical output network, although idealized -some other linear systems provide slightly superior performance.
- Q
I
II. THEORY OF THE QUADRUPOLE MASS FILTER
A. Description of Operation
In principle, the mass filter operates as follows: Ions are injected -through an entrance aperture (Fig. 2.1) along the axis of a quadrupole lens (four parallel cylindrical electrodes; cf. Fig. 2.2) to which d-c and r-f voltages are applied. Ions with mass-to-charge ratios outside a passband determined by electric-field specifications have unstable orbits and are ejected from the sides of the filter.
Ions
with
masses
inside
the passband follow complicated but
bounded
trajectories through the quadrupole to an ion collector at the out-put (Fig. 2.1). The exact trajectory of an ion depends upon entrance conditions, but for a suitably limited entrance displacement and velocity, all trajectory envelopes lie within the quadrupole dimen-sions (y direction, Fig. 2.1). However, it is possible that some trajectories exceed filter dimensions, so that some ions of passband mass are lost by collision with the electrodes (x direction, Fig. 2.1).
Some of the theory necessary for the design of a quadrupole mass filter will be developed in this chapter.
B. Equations of Motion
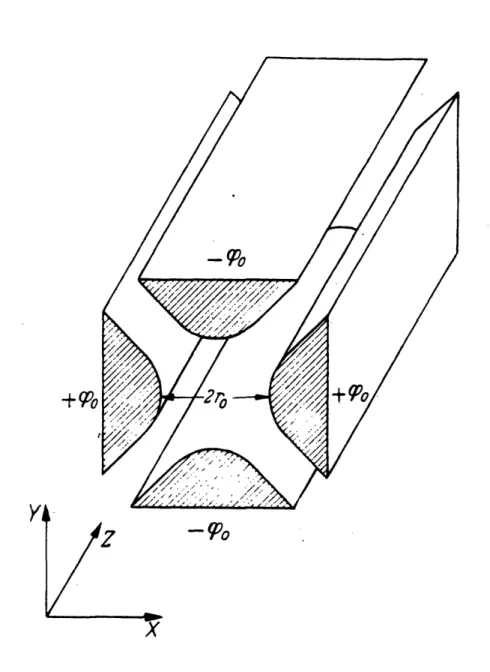
In idealized form the quadrupole mass filter consists of four parallel electrodes of hyperbolic cross section, to which voltages
-I
-uri
$
A C10 lo x-
L,,A-' ii i ::: ::::- :: : :: : : ;; ;; :: : ::~:;: :::: z :;:;; ; ; a-::: :::: ::: . .; : N~ m~; v;;: :: :: :::: ::· ::::: ::::: ; : :: ::: :: :: :- :: :- :: :: :: . . . ... I...I... iliiiiiil::i~ii ::ii ... ·.;:::,ii lii::i:-:::ijiiiil iil iiiiiiiiiiiiiiiii.I....I... : i:.. ... ...
iiiiiiijii iiijiiiiiiiii ii~~~ii~iiiiiiijiiiiiiiiiiiiiijiiiiiiii~~ii iiiiiii... 1- ... ...
y
i''''''''''''''''''''''"'''''"''''"'''''''''''''''
Fig. 2.1. Stable ion trajectories in the mass filter. Typical trajectories (for Bx = 0.9, y = 0.13) plotted
from the approximations of Eqs. 2.18 and 2.20, with the assumption of an abruptly terminated quadrupole field. Shaded areas indicate distribution of trajectory
envelopes for random input conditions.
-Uc
I t I~l~rmrmm
.,..~,,m~····R~n--·--·r·?.m:~l::... i ... " :::::: ::i;iz;:;;:;;::;;;;;;;::!::::!::::::::::::!:;;;;;;;;;::;:::::::::::::::;::: ... .... ... ·lc:l::: ::;;:;;;::iii:tiii:::::::: :::: ::: :;: 7:;" :; :: ; ; a :;:: ;;;:::: : :::: :: ; :: : w :: : :: : :::: : : ::;:::: :;;;;~~;~;;;;;:::.
:::.::: :.: ::::::7: ::: : ;; ;;; ;;: .t: ::.:::::.:: :::. .:;::;; :;;::":;; _Iiiit.~ t- ::~; ;~;t~j.:..~..: ... :: :: :: .... :iiti..:..i....:..:..:..:.:..!::!:::::;Ill: Bell··rlh .... ... .... ... ....::::::z
- l
-,#z
-
o
are applied (Fig. 2.2).
region I:s
The potential at any point in the field
2 2
=
-
(U+
Vcos(t),
2
r
o(2.2)
where r designates the inscribed radius of trodes. The equations of motion for an ion
are
.. 2ex mx + 2 0 my- 2ey r mt = 0. (U + V .os 'ti) = (U + V cos t) =the hyperbolic elec-of charge e, mass m
0,
(2.3)
o,
(2.4)
(2.5)
Mathieu's Equation
An ion injected along the z direction will continue with its velocity in that direction unchanged (Eq. 2.5). In the x-y plane, however, the ion trajectory is more complicated and described by Mathieu's equation: The transformations
Wt = 2 , 8eU
a=
22'
mr W o 4eVq=
2
2'
mr *(2.6)
(2.7)
(2.8)
Cf. Ref. 6. This entire chapter is basJ- extensively on this paper; hence statements made without proof refer to it.
reduce the x-y equations of motion to
dx2 + (a + 2q cos 2) x = O (2.9) and
y - (a+2q cos 2) y = , (2.1o)
dt
which correspond, except for signs, to the standard form of the Mathieu equation:9
d2x
2 + (a - 2q cos 2) x =- 0. (2.11)
dS
All solutions to any of the three preceding equations can be represented in the form
x = al'et Z c2me j 2m t + a"e' Ce 2m (2.12)
The solutions are stable (i.e., bounded) for all initial conditions only for -= JB (purely imaginary), with not an integer.
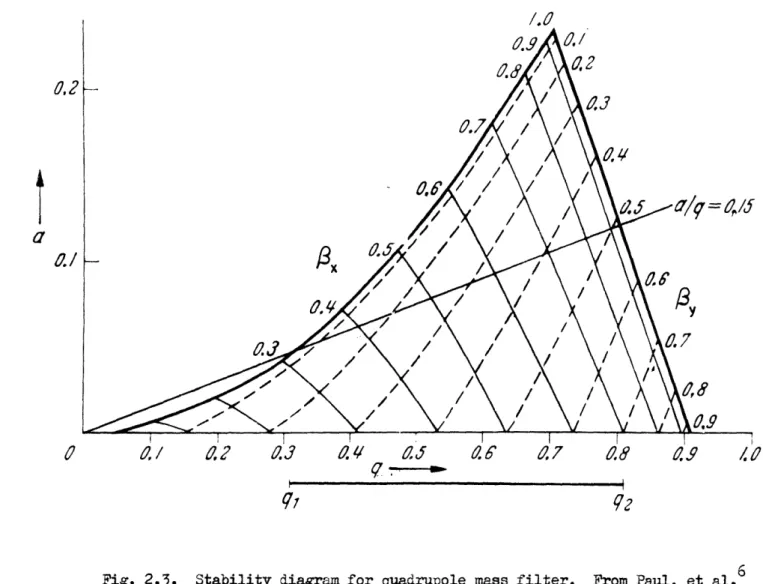
The characteristic exponent () depends only on a and q, i.e., is independent of initial conditions. The range of values for a and q for which the solution is stable for each of the Eqs. 2.9 and 2.10 can be plotted as a sequence of regions in the a-q plane; only the one closest to the origin is of interest for mass-filter operation. The operating point (a,q) must lie in a stable region of the a-q plane for both the x and y equations. The combined region of
O. O,6/
2
6. .a
B,
0y 60.7 0., I q 77 42Fig. 2.3. Stability diagram for quadrupole mass filter.
I'
0.2
I
0./
14 -9OZYq 7,
a-
.£6From
Paul, et a6
If the field specifications (r, ,7 U, and V) are held con-stant, the locus of operating points on the stability diagram as a function of mass is a straight line through the origin (cf. Fig. 2.3). The distance from the origin on this locus varies inversely with ion mass. The ion trajectories will be stable only for the range of masses with operating points lying within the stability region - the passband of the filter. As the ratio of d-c to r-f voltage, U/V, is increased, the slope of the a/q line increases, and the range of the stable interval is reduced, until finally ions of only one mass have stable trajectories; all others are ejected sidewise.
Particle Orbits
Within the stable region the solutions of the equations of motion have the form
x or y- = i c2m cos(m + )wt + i C2m sin(m +
)t
=A
c cos [(m
+)t
+,
(2.13)
where c, and aI or A and are determined by initial conditions and C2m and B by a and q, hence by ion mass and field conditions.
Some insight into the particle trajectories is gained by con-sidering the truncated form of the series Eq. 2.1l by convention
-
16-x or y = A cos ( t + 9) + c cos t cos [(1 +
Th
ot +e
+ .. } . (2.14)For y(t) a continued-fraction expansion of the coefficients (Appendix A) gives
c2 c2 - 2 (2.15)
(2+ ) + a
and Eq. 2.14 may be rewritten as
y(t) Ay cos (2 t + ay) [1 + 2c2 os wtj . (2.16) Near the vertex of the stability diagram of Fig. 2.3, y << 1,
a 0.23, or
2 - (2.17)
thus
i. .
v4~~~t)
- A cs(
t 4)
r
- nnowtI
.
(iF18
- -' --- '2 y'-
y
L 2 2This equation, also obtained from direct physical reasoning by
in
Brubaker,- predicts that the motion of the ion in the y direction will be a low-frequency sine wave to which the second term adds a moderate perturbation at the frequency of the quadrupole drive. This is precisely the form of solution shown in Fig. 2.4b obtained by numerical integration of the original force equation (Eq. 2.10).10
A somewhat different approach must be taken for the approxi-mate solution of the x equation because 1 - Bx is << 1 for
opera-tion near the vertex (cf. Fig. 2.3). Only the first two terms of
,,
5
Fig. 2.4. x and y trajectories for a = 0.231, q - 0.7038. After Brubaker.10 t 'Tr
x
(a)
Y
(b)
t
TT- 1J
-Eq. 2.14 are used because (as shown in Appendix A) c2 is small.
Thus
1 1 1 OX -
r
'x(t)--Ax cos 2 )wt + ex + c 2 cos [( 2 2
x(t) Ax (1 + c 2)cos
t
cos[t
-+ (1 - c 2) sin t sin i- 2
Wt
e
2.19)Because c 2 1 (Appendix A), the first term of Eq. 2.19 dominates:
x(t) - A' cos t cos .. t - . (2020)
x 2 2 x
The motion of the ion in the x direction is a sine wave at half the quadrupole drive frequency (a subharmonic oscillation) modulated by a low-frequency sinusoid. An exact numerical solution is shown in Fig. 2.4a.
For any individual ion the trajectory in the x-z or y-z plane has the same form as the trajectory plotted against time, because
z = (t - t), (2.21)
where is the z-direction velocity and t the entrance time. The description of all possible spatial trajectories for a given ion species and set of quadrupole voltages is difficult, bedause the
individual trajectories are a function of 5 random variables: two in-put displacements, two inin-put velocities, and the inin-put time. However,
-
19-if is constant, all will be contained within constant-wavelength sinusoidal envelopes. These envelopes can shift in position, but are constrained to low amplitude at the quadrupole entrance aper-ture and so at subsequent half wavelengths. For example, the in-put ensemble consisting of ions entering on the axis with finite velocity has a generalized x-z trajectory of the form
w z (1 - x)
x(z) A' x
cos
2(t
0 +)
sin
z , (2.22)(
which has envelope nodes at z =[2zi/(l - x)wn, where n is an integer. There exist, then, standing waves of ion-trajectory amplitudes. The range of possible envelopes for one particular set of operating conditions (i.e., one set of a, q values) is in-dicated by the shaded areas of Fig. 2.1.
C. Mass-Filter Operation Mass Spectra
A spectrum is swept,by variation of one or more electrical parameters. For example, with voltages U and V constant, change of frequency moves the operating point for any specific mass m along a straight line that passes through the origin and intercepts a section of the stability region (cf. Fig. 2.3). The distance from the origin varies inversely with frequency. Increase of frequency causes the operating points of a sequence of decreasing masses to traverse the stability region and the corresponding ions to pass through the filter.
r
20
-If frequency is held constant and the voltages U and V are varied simultaneously so that their ratio is constant (), a
straight line through the origin is again traversed, this time with the distance from the origin proportional to the voltage. Increase of voltage makes a sequence of increasing masses traverse the stable region and pass through the filter.
Fractional Transmission
In the discussion above it was assumed that all ions on "stable" orbits traverse the mass filter and are collected at the exit end, while those with "unstable" orbits are ejected. This is not precisely true; some ions may have orbits which, while
nominal-ly stable, are so large that they extend beyond the electrodes (cf. Fig. 2.1, xdirection trajectory). Such ions will be lost from the filter.
The exact ion trajectory depends both on the operating point in the a-q diagram and initial conditions. For suitably limited entrance conditions there will be a section well within the stability region for which all ions, regardless of individual entrance con-ditions, describe orbits in the confines of the mass filter (con-dition of "unity transmission"; Paul's Region I). In the remainder of the stability region ions will be either transmitted or lost, depending on the size of the initial-condition-determined orbit (condition of "fractional transmission"; Paul's Region II). If the mass-spectrum locus line traverses the inner section of the stability
_- 1
-region the resulting mass lines are trapezoidal in shape, the flat top corresponding to "unity transmission," the sloping sides to
"fractional transmission." However, if the locus line crosses the stability region near the vertex, above the inner section, opera-tion is always under condiopera-tions of "fracopera-tional transmission" and the mass lines are triangular in shape.
Resolution
If the sides of the stability region of Fig. 2.3 are regarded as straight lines, a simple relation can be found between the mass range for stable ion orbits, the passband In, and the mass m corresponding to the center of the stability region:
m 0.178 .2
kSm 0023699 - a0.706
ao706 is the ordinate of the mass line in the stability diagram for q = 0.706. In terms of mass-spectrometer operation this is a resolution equation, with line width Am measured at the base of the
*
mass line.
Maximum Orbit Size
For any given set of entrance conditions - displacement and velocity - the ion trajectory depends upon the phase of the r-f
quadrupole voltage at the instant of ion entrance. When all possible entrance phase angles are considered, the maximum x or y
- 22
-ment of the ion, x or ym, for either injection parallel to the m
axis at a fixed displacement x or yo, or injection at the axis with a radial velocity Xo or yo, varies inversely as 1 - ox or By,
respectively. If straight-line approximations are made for the constant-s lines in the stability diagram (Fig. 2.3), the maximum displacements can be expressed in terms of the resolving power of Eq. 2.23:
{or
i~
2.5
g
,
(2.24)
or
<r
25
9
(2.25)
m
o
Since for unity transmission all ions must have maximum amplitudes less than r, the inscribed radius of the hyperbolic electrodes, Eqs. 2.24 and 2.25 can be used to postulate maximum input displace-ment and velocity.
Transverse Exit Velocity
If the ion collector of the mass spectrometer is a sufficiently large Faraday cup placed near the end of the mass filter, it will collect almost all the ions cnnina out of the filter even if they have high transverse exit velocities. On the other hand, if the ion collector is the relatively small first dynode of a commercial
elec-tron multiplier placed some distance from the end of the filter, ions with high transverse exit velocities may not be collected. This lowers apparent mass-filter transmission, and, if the exit-velocity effect is mass selective, can produce false ion-abundance ratios. The transverse exit velocities are therefore of some interest.
The maximum exit transverse velocity is just the maximum transverse velocity of the ion within the mass filter and can be estimated from the approximate trajectories (Eqs. 2.18 and 2.20). These can be regarded as high-frequency ( or /2) sinusoids with slowly varying amplitudes. Differentiation of the high-frequency part of Eq. 2.18 gives for the velocity
y(t)
:.
Ay
2
cos ( CO t + By) sin wt
and if a displacement amplitude ym is assumed, the velocity ampli-tude is
-m -q (2.26)
m 2+q
Differentiation of Eq. 2.20 for the x direction similarly gives
X
~
m
~
(2.27)
Because q _ 0.7 (cf. Fig. 2.3), the velocity amplitude in the y direction is about half that in the x direction (under the assump-tion of the same displacement amplitude). For the most
the x-direction motion.
Maximum velocity amplitude occurs when displacement ampli-tude is a maximum. It must therefore be obtained separately for each of the three limiting values of displacement:
(1) In fractional-transmission operation ions with orbits larger than electrode boundaries are lost; the maximum displace-ment amplitude of those that remain is r . Thus the velocity amplitude of Eq. 2.27 can be squared and express as a transverse "voltage" (Utm): 22
mr 2 0
eUtm
* -...
Substitution from Eq. 2.8, which relates r and w to the radio-frequency voltage V, gives
V
Utm_
~
.
(2.28)
Since q -_0.7, the maximum transverse exit momentum, expressed as a voltage, is
Utm 0.7 V . (2.29)
(2) In unity-transmission operation the ion orbits are limited by entrance conditions. If the limit is given by input displacement confined to an aperture of diameter d, the maximum orbit amplitude is given by Eq. 2.24 and the maximum transverse exit momentum, expressed as a voltage, is
0.8 lr~ 2
tm q ) m V '
r2
tm
1.2 m V (2.30)(3) If, in unity-transmission operation, maximum displace-ment results from the transverse entrance modisplace-menta of the ions, the maximum orbit amplitude is given by Eq. 2.25 and the maximum
transverse exit momentum expressed as a voltage, is
Ut 18 m to (2.31)
t'm
-m
to'
where Uto is the voltage corresponding to the transverse entrance momentum. It is to be understood that Eqs. 2.30 and 2.31 apply only when they yield a voltage lower than that of Eq. 2.29.
Heretofore only the maximum velocity occurring along the filter has been discussed. The transverse exit velocity of a particular ion depends upon its individual entrance transverse velocity, displacement, and time, and upon its transit time in the filter. The entrance time is purely random, the entrance displace-ment and transverse velocity are widely distributed in some statis-tical fashion, and even the transit time has some statisstatis-tical
spread because of a slight variation in entrance longitudinal velocity. A statistical treatment is necessary to determine effective output momenta.
The standing-wave amplitudes along the filter are fairly deterministic, depending most strongly upon the precisely known for the ion species and upon longitudinal velocity. The transverse
:wo:~~~~~~~~~---- - i_ .:2, 4 ,Y fI 1__. .1a A E g velocliLe a ne
exit, nen,
COUIa e exipecceu o rise $ na i i&l- 26
-with change in
in the scan of a mass line, as the standing
wave-lenghts change and amplitude loops and nodes alternately
pass the
exit.
Any more precise treatment requires evaluation of probability distribution functions of all input variables. Because output placement and velocity are directly proportional to entrance dis-placement or velocity, an average over entrance conditions will give the mean output velocity with respect to those variables. For
example, if the input ion beam is either perfectly collimated and contained by a circular aperture, or perfectly focussed on the axis with velocities uniformly distributed to some upper limit, the mean magnitude in one direction is 4/3ir of the maximum. An average over entrance time (to) is more difficult; the approximate solutions for the equations of motion (Eqs. 2.18 and 2.20) are not suitable for such computation (e.g., they predict infinite amplitudes as a result of certain entrance times) while more exact solutions are so compli-cated as to require machine calculation. For lack of a better means, the effect of entrance time can be estimated from the approximate
solution for the special case of entrance on the axis (Eq. 2.22), which says output displacement (hence output velocity) is a sinusoidal
function of entrance time. The mean magnitude of output velocity is then 2/ of the maximum.
The overall mean magnitude of one component of the velocity is then, by crude estimate, 8/3n2 of the maximum at that point along
27
-the filter. If -the effects of simultaneous entrance velocity and displacement, and of y-axis motion as well as x-axis, were con-sidered, the mean would be higher.
To summarize: The absolute maximum transverse momentum of ions at the exit of the mass filter is given by whichever of
Eqs. 2.29 through 2.51 applies. The actual maximum is constrained by the relative amplitude of the standing wave of ion displacements
at the exit point. The mean transverse momentum must be obtained by an average over both directions of motion, all input times, and
all possible input conditions; it can be assumed to be more than
30% of the maximum.
An estimate of the actual effect of the transverse exit momentum can be made by assuming that the region between the mass filter and the collector has plane-parallel geometry, with a separation of distance between the collector, assumed to be at a voltage of magnitude Uc, and the mass-filter end plane. This is not a totally unrealistic assumption if shielding grids are placed over the output of the mass filter and input of the ion collector. The ion trajectory in the transition region is a parabola, and if the initial axial momentum is negligible, the additional transverse displacement of the ion at the collector will be
b =2 t . (2.32)
d 2.29, tUcan be in the low kilovolt
range, there is a need for a high collection voltage to keep the ions confined within a reasonable radius.
It should be noticed that because Ut varies with the selected
mass in a voltage-swept spectrometer (Eqs. 2.29 to 2.31), any loss of ions caused by b > collector radius will be mass discriminatory.
D. Design Considerations Basic Design Equations
For convenience, the most pertinent mass-filter design equa-tions are summarized here.
Consider a quadrupole mass filter with electrode voltage
0 = U + V cos 2vt, (2.53)
i where r is the inscribed radius of the electrode assembly and v=
0
w/2< is the r-f frequency.
The condition for transmission of a singly charged ion of mass m at infinite resolution, that is, at the peak of the stability
diagram, may be reduced to
V3 7.219 m (amu)v2 (Mc) r (cm) volts, (2.34) U = 1.212 m (amu)v2 (Mc) r2 (cm) [volts), (2.35) 0 and U i eU' U .95~ 1
~=
0.16784. (2.56)Equation 2.34 is also a ood approximation in the case of finite resolution. The idealized resolution, based on the width at the foot of the mass line, is approximately
. 29 -12-
rn 0.126 (2.37)
m O0.16784
-The maximum injection-aperture diameter, so that all ions in-jected with zero transverse momentum will be contained in a circle of radius r (the condition for unity transmission), is
d 0.8 -' ro (cm) [cm] . (2.38)
The maximum transverse injection momentum so that all ions in-jected on the axis of the quadrupole will be contained in a circle of radius r is, when squared and expressed as a voltage,
3t
_,V
6ifl
(volts]
.(2.39)
It is found experimentally that ions30 m
It is found experimentally that ions must remain in the mass
filter 5 Jm/!m' cycles to be mass selected; the maximum axial injection momentum to ensure this is, expressed as a voltage,
2A2 2 (2.40)
Ua
a "
2.1 x 10 v2 (Mc) L (m) m (amu) n volts] , (2.40)where L is the length of the quadrupole lens. The maximum trans-verse exit momentum, expressed as a voltage,is
Utm .- .7 V (volts) [volts . (2.41) For resolution m/Am, the required dimensional accuracy and r-f frequency stability are 1/4 (m/m); the required stability of the applied voltages is 1/2 (m/m).
The r-f voltage is almost invariably taken from a tank circuit; the r-f power required is that taken by losses in the
0
-tank, or
= (2V) 2vc
(2.42)
2Q 7
where C is the end-to-end capacitance of the tank circuit, in-cluding the mass-filter rods, and Q the "Q" associated with the tank. Substitution from the resonance condition (Eq. 2.534) gives
C (pf) m2 (amu)v5 (Me) r4 (cm)
P = 6.5 x 10O (c watts) .(2.43)
Momentum-Limited Transmission
The limit on transverse momentum (Eq. 2.39) is usually
the most restrictive entrance condition. If the limit is exceeded, transmission must be less than unity; if the limit is a function of the mass selected, transmission will also be a function of mass. Possible methods of elimination of mass-dependent transmission will be considered in this section.
I- Equation 2.39 with the r-f amplitude (V) eliminated by use of the resonance condition (Eq. 2.34) becomes
Uto 0.24v2 (Mc) r2 (cm)Lm (amu) volts) . (2.44)
to
0
The design problem is to make the right-hand side of either Eq. 2.39 or 2.44 independent of selected mass. One solution is constant V and constant m/t~m (Eq. 2.39), which in turn requires constant U/V (Eq. 2.37). Because both voltages must be held constant, operation in this manner requires the mass range to be swept by a change of frequency.
-3
1-An alternative solution, due to Professor C.K. Crawford, is constant v and constant 6m (Eq. 2.44). The mass range is then swept by change of voltage, with a relationship between the r-f and d-c voltages of the form
U = V - 8, (2.45)
where and 8 are constants. Substitution in the resolution equation (Eq. 2.37) yields a line width
1.10
Am %Ii 7.94 (0.16784 - 7)m + 2
(amu
. (2.46)v2 (Mc) r (cm)
0
If = 0.16784, m is independent of the selected mass.
Both the resolution equation (Eq. 2.37 or-Eq. 2.23) and the transverse-momentum equation (Eq. 2.39 or 2.25) are based on straight-line approximations to curves in the stability diagram. In addition, the latter equation is also based pon a further approximation of orbit amplitudes in terms of x and by. All these approximations fail at low values of m/6m, although the errors from the first two tend to cancel. It would therefore be expected that Eq. 2.46 would fail at low values of resolution and that line width would not remain constant, even with = 0.16784.
Two advantages accrue to the constant-Am mode of operation in aalition o ne eminatlon or transmmssion variation causea Dy n-put transverse ion momentum. First, it is possible to operate at
lower r-f voltages for a given selected mass without losing trans-mission at the low end of the mass range; this saving in r-f
volt--
52-age and power can be important at the high end. Second, the uni-form width of the mass lines makes comparison of peaks somewhat easier.
Operation at constant Am does introduce some complications, however. The maximum injection-aperture diameter for unity trans-mission is inversely proportional to the square root of the mass selected (Eq. 2.38). To avoid mass discrimination, the entrance aperture must be small enough so that no ions are lost because of input displacement even at the very highest resolution. This may impose a severe limit on aperture size.
Operation at constant nm also enhances mass discrimination in loss of ions by transverse exit momenta, for in Eqs. 2.29 through 2.31 the transverse "voltage" varies as a high power of selected mass with m constant than with m/lm constant.
Mass-Filter Design
The parameters of the mass filter incorporated in the quadrupole mass spectrometer were not chosen in one clear and decisive operation, but rather evolved historically, as various filter elements were modified to yield improvements in the most cnnnmieal faohin. The caiz o-f +.hp nArann -field was
nrri-al-ly determined primarinrri-al-ly by convenience of mechanical construction. Frequency-swept operation of the filter was considered, but.
abandoned because of formidable engineering difficulties.
A fixed-frequency, voltage-swept system was used instead, with a
choice of frequencies for different mass ranges and provision for introduction of an incremental d-c voltage 6 for operation at con-stant m. The r-f frequencies were chosen so that an early version of the quadrupole, using stainless-steel rods, could operate at unity transmission with An = 4 amu on an 0-400 amu mass range for ions with input transverse momenta corresponding to 0.9 volt, a value that encompasses 99% of Maxwellian-distributed ions of 2000OK.11
The stainless-steel quadrupole has been replaced by a metal-lized-ceramic one that has, for reasons of constructional simplicity, slightly different dimensions. The mass filter then no longer exact-ly complies with the original design requirements. The new quadru-pole has an inscribed radius r = 0.807 cm and a length L = 0.51 m.
The mass filter has four ranges, 0 to 50, 100, 200, and 400 amu. The r-f frequencies are given by
V=
g
x 3.2103
(megacycles)
,
(2.47)
where M is the upper mass of the range being used. The r-f voltage is
V 50 x 48.5 m (volts] , (2.48) for a maximum value of 2420 v on all ranges. The maximum transverse momentum for unity transmission, expressed as a voltage, is
IT 50 x 1.6 Am (voltsl . (2.4Q'
-to M - - ' '
The maximum axial injection momentum for mass selection, expressed as a voltage, is
r
50 x 560o m volts . (2.50)
The maximum transverse exit momentum is, expressed as a voltage,
III. MASS SPECTROMETER: CONSTRUCTION
Those arts -of the quadrulole mass spectrometer that lie in the realm of physical electronics were designed and constructed by Professor C. K. Craword., and so were not a art of the work of
this thesis per se: they are the quadrupole lens, the ion source, the electron multiplier, and the vacuum system.
A. Quadrupole Lens
The quadrupole lens consists of -four metal-coated-alumina rods, 0.760 inch in diameter and 22.5 inches long, ground after metallizing to be round to 0.0001 inch, and mounted in a titanium holder (Fig. .1). The nominal inscribed radius was 0.318 inch. Specifications called for the rods to be straight to within 0.0001
inch after grinding. nfortunately, because of an error in manufacture, the rods are actually uite crooked: deviations of more than 0.002 inch have been measured. The variation in inscribed radius (ro) produced by this crookedness held spectrometer resolution to low levels.
The original design of the lens called for slots to be cut in-to the metal surface of each rod in-to electrically isolate a 270°
sector 1.25 inches long on each end. The isolated sectors were to be gripped in two precision-bored end plates, while the remaining
*
b S ~ C 0. : < 1 S .0 c 0 a Iclw I I S
T,
ic a I _ __ A I 4 0 er C E .24
C h. S o o ; 3 4 oo 0 0 A~ id -I '-4 ! -- - · ! -Ilr7~~~~~~~~~~~~~~'i
;, - s- U ~ -·I u_,! P i _ i,p-~v
~ dl JJ D · v N-
37-90° sectors would extend the quadrupole field to the end of the rods. Because the 2700 sector would have been concentric with the main metal surface of the rod, mounting accuracy would have been high. Unfortunately, because of another error in manufacture,
the 270° and 90° sectors did not adhere to the ceramic. It was therefore necessary to grind the exposed ceramic end as accurately concentric with the electrode surface as possible, and mount the ceramic stubs in the end plates. This alternative arrangement lowered mounting accuracy, but errors were masked by the gross crookedness of the rods.
The major difficulty with the makeshift mount is that the auadrupole field ends !X inches inside the mechanical lens as-sembly. At the input end this could be described as annoying; it requires a strong-focussing lens to transport ions 1 inches from the source to the small injection channel (used to minimize end effects). At the output end it is almost catastrophic. If ions at the exit with transverse momenta given by Eq. 2.51 for a mass
i
at the upper limit of a range (Utm ' 1700 v) were to be ac-celerated in a uniform field by a typical accelerating voltage U =
c
10 kv, then (by Eq. 2.32) after traversing 1 inches they would be contained in a circle of radius 1.4 inches - well beyond the actual exit radius of 0.3 inch. This means that if no special precautions were taken, there would in fact be a large and mass-selective loss
of ions between the end of the electrodes and an ion collector ;
-
38-mounted beyond the end of the rods.
The most obvious cure for the exit problem, extra metal elec-trodes slipped over the ceramic rod ends to extend the field region,
is impractical because such electrodes can not be positioned with sufficient accuracy. Instead, the ion collector was extended inside the rod ends. A beryllium-copper-lined metal tube with a high-transmission grid on its input end was slipped into the end region almost up to the quadrupole electrodes, and the first electron-multiplier dynode mounted directly behind it. This extraction tube, which is maintained at the full ion-accelerating potential of the electron-multiplier ion detector, brings the collecting potential close to the end of the uadrupole to cut down the skew of the exit trajectories of the ions and increase the fraction that impinge upon the multiplier first dynode. It also serves as a "zeroth" multiplier dynode: Those ions that strike the inner walls of the tube release secondary electrons that are accelerated by a potential of a few hundred volts to the nominal multiplier first dynode.
The corrective measures for the mounting difficulty were an attempt to save time and money, although it was known that the
final arrangement would still be not as satisfactory as a large ion collector butted closely against the end of a correctly con-structed quadrupole. Unfortunately, the corrections themselves took enough time (most of an academic year) to prevent both thorough tests of other arts of' the spectrometer system and use of the
spec-trometer for a study of Jthermal decomposition of solids as a art of this thesis roject. (t as only at the end of this period that the crookedness of' the rods - the one obviously uncorrectible difficulty in the lens - was discovered.)
The use of circular rods to approximate the hyperbolic
electrodes of the ideal quadrupole leads to higher-order perturba-tion terms in the electric potential. Symmetry consideraperturba-tions show that the lowest of these is a -twelve-pole term, i.e., one varying as r cos 6 , where r and f are polar coordinates. Paul, et al. recommended a ratio of quadrlpole rod radius to inscribed radius of 1.16 to minimize this term.6 The quadrupole lens described above has a ratio of radii of 1.20, hence a non-minimal twelve-pole term that could conceivably introduce a fine structure into observed spectral lines, and possibly even cause multiple ttansmission
12
bands. However, no such line degredation has been observed in instruments with radii ratios of 1.00, so the much smaller deviation of this one is considered unimportant. 213
It should be pointed out that the radii ratio of 1.16 does not really apply to a structure of four circular cylinders. It was ob-tained by minimizing the twelve-pole term for a quadrupole magnet
14
that used as pole pieces sectors of circular cylinders. Calcula-tions for complete circular cylinders are yet to be done.
B. Ion Source
-4
-parts
8(Fig.
3.2), is shown schematically in Fig. 3.3.
Gas
mole-cules enter the grid-enclosed ionization chamber in
paths
perpen-dicular to the paper. It was intended that they come from a solid
vaporized in a Knudsen cell immediately
below the
ionization
chamber, but such operation was not achieved; only background gas
was analyzed.
Electrons from a tungsten-rhenium filament injected into the ionization chamber (by source Velect) ionize the gas molecules.
A small electric field (produced by Vchamber) accelerates the ions out of the chamber into a strong-focussing lens that conveys them to the injection canal. From the canal they are injected into the quadrupole lens, with a longitudinal momentum corresponding to the aceelerating potential Vio.n
The voltages (and even the circuit connections) on the diagram are only typical; they are set to optimum values for any particular experiment.
C. Electron Multiplier
The electron multiplier (Fig. 3.4) has 20 stages of beryllium-copper dynodes with a structure shown schematically in Fig. 3.5. The first dynode was made large (2.5 cm limiting aperture) with the intent that, when placed near the end of a quadrupole it would
accept ions with skew trajectories. The last 17 dynodes are identical with those used in the 14-stage RCA C-7187J electron mulitplier, which
- 41
-II
M.X - A.Ion source.
- E6-- . M a --j i i i I Ii~~~~~~~~~~~~~~~~~
I i I i I r i I o, i II fI t i I c i w IFig. 3.2.
~
~~---I
I~~~~~~~11
oE
C 0I
0
cu >u .C 0 N C 0 0 0 0 C 0 .C 'a C) o o +Io 1-0 E0
0
-D -, C 0 0c
D a2 Io
I II I I I II II - - - -1I l II- 43
-(a)
94be
, ~ ~ ~ ~ I =lit
jI i -II IIIjI
I
(Q
Fig. 3.4.
Electron multiplier:
(a) on mounting flange,
(b) partially disassembled.
(b)
-44-Entrance Grid
D
2Di,
P llMW
Fig. 3.5. Electron-multiplier structure. D1 through D20
r
45-in turn is identical -in structure to the multiplier -in the 6810A photomultiDlier tube. The second and third dynodes were designed to provide a transition between the large first dynode and the small RCA dynodes. The anode is a grid structure mounted between the 19th and 20 dynodes.
Not shown in either the photograph or the diagram is the "zeroth" dynode, the extraction tube slipped into the space between the ceramic quadrupole rod extensions. The entrance grid for the first dynode is placed within a centimeter of two of the output end of the tube, and a small wire (0.010-inch diameter) run axially up the tube to introduce an accelerating field.
The dynodes were given no sensitization treatment before use. Gain, originally 3 x 10 with 8 kv across 20 dynodes, dropped only
slightly over a period of several months. Then a number of internal arcs, brought about by an open connection, reduced it by several orders of magnitude, so sensitization was attempted. The arm of the vacuum system containing the mulitplier was baked for 24 hours at
temperatures of about 400°C and a pressure on the order of 10- 5 torr.
With temperature: held constant at 400°C, oxygen was admitted (at a pressure somewhat above 1 torr) for 20 minutes and the system
pumped down to about 10- 5 torr and cooled under vacuum. The result-ing multiplier gain was quite high - an estimated 10 at only 5 kv applied voltage - but one exposure to the atmosphere reduced it great-ly, e.g., to 2 x 10⁷ at 8 kv.
r
D. Vacuum System
The vacuum system was designed to avoid organic contaminants, which may degrade electron-multiplier gain, form insulating films that can cause erratic potentials on surfaces, and yield a con-tinuum background spectrum. The system is made of stainless steel, with copper-gasket seals at all demountable joints. Oil-free rough vacuum is provided by an alumina-trapped mechanical pump
and a zeolite absorption pump. The principal high-vacuum pump, a 90-liter/sec ion pump, was found inadequate to handle bursts of gas produced by evaporation of materials in Knudsen-cell sources, and was therefore augmented during such operation by a liquid-helium cryopunp.
The entire system was designed to be baked at temperatures up to 4000C, although this has not yet been done. The vacuum typically obtained in the unbaked system, without use of the cryopump, is about 10 torr.
- 1l7
-IV. ELECTRONIC DRIVE CIRCUITS FOR THE MASS FILTER
A. Circuit Requirements
The quadrupole mass filter requires for its two sets of rods a pair of voltages, balanced about ground, of the form
+ = U + V cos 2vt . (4.1)
--
o
The selected mass is proportional to the r-f amplitude, V. Since the range of masses should be swept over a time suitable for oscilloscopic presentation, starting at any arbitrary mass in the sweep range, the most general form for the r-f amplitude should be
= t + , (4.2)
where a may be adjustable to vary the sweep rate and may even be zero if the filter is to select a single mass line continuously, and is of course adjustable. The sweep may be either repetitive (a sawtooth) or single shot.
For a constant resolving power, m/nm, U should be a fixed fraction of V, but for constant line width, An, U should in addition contain a negative constant. The most general form required for the d-c voltage is therefore
U = yV- . (4.3)
The electronic drive circuitry that produces voltages
described by these equations can be broken into three major parts
i
~,..
1 -- .['Fig. .1): T''e llrst is the control generator, wnlcn produces a voltage of the form ot + 3. The second is the r-f rod driver, whose output, applied in balanced form to the mass filter, is proportional
rl
0
cI Io
I $4 .t-E I 4 0z
I c~0
io
-II II I I I I_ .a
.
.9 .11 .ll a a L I ~ _ rin amplitude to the input from the control generator. The third is the d-c rod driver, a balanced-output d-c amplifier for the control-generator signal, with provision for the addition of a resolution-co mpensation voltage.
B. Control Generator
A more complete block diagram of the control generator is shown in Fig. 4.2, and a schematic diagram in Fig. 4.3. The sweep source is a phantastron sweep generator that produces a voltage ramp on either a recurrent or a single-shot basis. This
is followed by a pair of operational amplifiers, the first of which inverts signal polarity, while the second provides an
ampli-tude control for the sweep. The sweep signal is then passed through a "sweep zero clamp" that holds the voltage at zero during non-sweep periods. Finally the non-sweep signal (proportional to at) is added to a d-c "zero offset" voltage (proportional to ) in a final operational-amplifier stage.
The phantastron sweep generator (tubes V1 and V2 and associated
circuitry) provides recurrent O.1- and -sec sweeps and manually triggered, single-shot 1- and lO0-second sweeps. In the single-shot mode the circuit is quite conventional,1 5 but the recurrent mode does have one unusual feature: the recovery delay is generated in-ternally by an R-C circuit involving a regenerative connection of the 6AS6 screen and suppressor.
-o, n
-o
o0
- o
0
o, c 0 o Cn 4 04
o r-I 4 0 0 F ' -l0 e O IE08SCSr 4' 0 (a
o
.4 e-I 0 Q) (D 0 0 '-0) . 4) 0 p 0I
c'J I-U' +1 4o
'-4 4)o
0 0 r-0 14o
c40
o 0 Cd trl 14T
.
- 52
-provides a synchronization signal for the oscilloscope used to dis-play the mass spectrum, and also drives the sweep zero clamp.
The free-running phantastron was chosen because it seemed to provide all the needed sweep services with only two tubes. An alternative sweep circuit considered at the time of the original design involved a transistor current source feeding a capacitor, a Schmitt trigger sweep-limit sensor, a one-shot-multivibrator recovery timer, and a "crowbar" circuit to short the sweep capacitor during the recovery period, for a total of at least 7 transistors. Despite this disparity in active devices it is now felt that the phantastron was a poor choice; it yields a signal with far too many spurious features.
The phantastron, like all Miller integrator circuits, has in-herent in its output signal a step preceding the ramp. If this function were applied to the r-f and d-c rod drivers it would excite serious transients in the mass-filter rod voltages at the start of the sweep.
A clamp (transistor Q3) was installed to short the sweep volt-age to zero during the non-sweep period; this did not completely
eliminate an initial transient because of a delay caused by difference in rise time of the plate and screen steps.
Another shortcoming of the phantastron sweep circuit lies in
. J_ -,
-voltage and tme
1nstalllles.
ne pnanmasron
generare
s
a
nlgnly
linear sweep with a rate accurately controlled by the supply
However, the voltage range over which the phantastron sweeps, and thus the sweep time, depends on less stable circuit elements. 'The
initial sweep voltage in the manual mode, in which plate current is truly zero until the start of the sweep, is not the same as in the
recurrent mode, in which there is finite plate current at the start. There is even some difference in starting voltage between different
sweep-time settings.
The rest of the control generator consists of operational-amplifier feedback operational-amplifiers. The phantastron ramp is inverted by a simple two-transistor amplifier. The next amplifier (a Phil-brick K2-XA) provides a highly linear sweep-amplitude control and adds a d-c component to remove the d-c offset of the phantastron signal. The last amplifier, also a K2-XA, adds the sweep voltage
(ot) and a zero-offset voltage (t). The output is calibrated at 50 volts full scale for either sweep amplitude or zero offset. The sum can go to 100 volts, but this overloads the r-f and d-c rod drivers. A neon warning lamp, not shown in the diagram, lights when the total output voltage exceeds 50 volts.
The unstabilized operational amplifiers suffer from appreci-able voltage drift. In one test the filament power was turned on for two minutes, plate power for another ten, and stability
observation begun. The output of the control generator drifted 55 mv in the first 7 minutes, 145 mv in the first 70 minutes.
After d-c power had been removed for 5 minutes (with filament power on) and then reapplied, the output shifted back 73 my but immediately
-Tesumed
a rift in teorigina-
._
resumed a drift in the original direction. A drift of 145 mv amounts to 0.145 amu on an 0-50 mass scale, 1.2 amu on an 0-400 scale;'-this cannot be tolerated in high-resolution operation.
The control generator therefore suffers from both voltage and time instability in the phantastron circuit and voltage instability arising in the operational amplifiers. For optimum performance it should be completely redesigned and rebuilt. The sweep generator could probably be based on a Miller integrator using one of the small low-drift, commercial transistor opera-tional amplifiers now available, with retrace and control func-tions handled by transistor multivibrators. Two operational ampli-fiers are necessary to control sweep amplitude and add zero offset. (A third one might be advisable to produce a zero offset signal that was a more linear fction of potentiometer setting.) The transis-tor operational amplifiers should be satisfactransis-tory for these applica-tions also, although it would be necessary to add an additional amplification stage on the output to achieve 50-volt signal levels. (Operation at lower voltage levels would not be satisfactory because a nonlinear network in the input of the r-f rod driver requires rather large voltages for proper operation.)
C. R-F Rod Driver
The r-f rod driver, shown in block-diagram form in Fig. 4.1, schematic-diagram form in Fig. 4.4, must produce rather large r-f voltages variable over an extremely wide amplitude range - at least
L
Ii