HAL Id: inserm-00381426
https://www.hal.inserm.fr/inserm-00381426
Submitted on 29 Apr 2011
HAL is a multi-disciplinary open access
archive for the deposit and dissemination of
sci-entific research documents, whether they are
pub-lished or not. The documents may come from
teaching and research institutions in France or
abroad, or from public or private research centers.
L’archive ouverte pluridisciplinaire HAL, est
destinée au dépôt et à la diffusion de documents
scientifiques de niveau recherche, publiés ou non,
émanant des établissements d’enseignement et de
recherche français ou étrangers, des laboratoires
publics ou privés.
microscopy: intraparenchymal imaging and
quantification of extravasation in mouse brain cortex.
Pascale Vérant, Raphaël Serduc, Boudewijn van der Sanden, Rémy Chantal,
Clément Ricard, Jonathan Coles, Jean-Claude Vial
To cite this version:
Pascale Vérant, Raphaël Serduc, Boudewijn van der Sanden, Rémy Chantal, Clément Ricard, et al..
Subtraction method for intravital two-photon microscopy: intraparenchymal imaging and
quantifica-tion of extravasaquantifica-tion in mouse brain cortex.. Journal of Biomedical Optics, Society of Photo-optical
Instrumentation Engineers, 2008, 13 (1), pp.011002. �10.1117/1.2870083�. �inserm-00381426�
Subtraction method for intravital two-photon
microscopy: intraparenchymal imaging and
quantification of extravasation in mouse brain cortex
Pascale VérantCNRS UMR 5588 Laboratoire Spectro
38402 Saint Martin d’Hères, France and
Campus Universitaire de Saint-Jérome Institut Fresnel
Marseille, France
Raphaël Serduc
Boudewijn van der Sanden Rémy Chantal
Clément Ricard Jonathan A. Coles INSERM, UMR-S 836
Grenoble Institut des Neurosciences Grenoble 38043, France
and
Université Joseph Fourier Grenoble, France
Jean-Claude Vial CNRS UMR 5588 Laboratoire Spectro
38402 Saint Martin d’Hères, France and
Université Joseph Fourier Grenoble, France
Abstract. Brain pathologies, including stroke and tumors, are associ-ated with a variable degree of breakdown of the blood-brain barrier 共BBB兲, which can usefully be studied in animal models. We describe a new optical technique for quantifying extravasation in the cortex of the living mouse and for imaging intraparenchymal tissue. Leakiness of the BBB was induced by microbeam x-irradiation. Two fluorescent dyes were simultaneously infused intravenously, one of high molecu-lar weight共fluorescein-labeled dextran, 70 kDa, green fluorescence兲 and one of low molecular weight 共sulforhodamine B, 559 Da, red fluorescence兲. A two-photon microscope, directed through a cranial window, obtained separate images of the two dyes in the cortex. The gains of the two channels were adjusted so that the signals coming from within the vessels were equal. Subtraction of the image of the fluorescein-dextran from that of the sulforhodamine B gave images in which the vasculature was invisible and the sulforhodamine B in the parenchyma could be imaged with high resolution. Algorithms are presented for rapidly quantifying the extravasation without the need for shape recognition and for calculating the permeability of the BBB. Sulforhodamine B labeled certain intraparenchymal cells; these cells, and other details, were best observed using the subtraction method.
© 2008 Society of Photo-Optical Instrumentation Engineers. 关DOI: 10.1117/1.2870083兴
Keywords: biomedical optics; microscopy; image processing; fluorescence. Paper 07189SSR received May 25, 2007; revised manuscript received Aug. 3, 2007; accepted for publication Aug. 30, 2007; published online Feb. 28, 2008.
1 Introduction
The endothelium of brain capillaries regulates the exchange of molecules between the blood and the parenchyma. The pas-sage of most molecules is hindered, although specific trans-port mechanisms exist for certain molecules, notably glucose. The blood brain barrier 共BBB兲 is of great importance clini-cally for two main reasons. First, many pathologies are asso-ciated with an increase in the permeability to large molecules. This leads to their entry, together with water, into the paren-chyma, leading to vasogenic edema and an increase in intrac-ranial pressure that has harmful, even fatal, consequences. Vasogenic edema is a major complication in brain pathologies including trauma, stroke, tumors, subarachnoid hemorrhage, and neuroinflammation.1
A second reason for clinical interest in the BBB is that it not only restricts access of systemically delivered drugs to the nerve cells, but also the capillary endothelium possesses transporters of the ABC family, called multi-drug-resistance transporters, that remove, via the cytoplasm of the endothelial cells, those drug molecules that do reach the parenchyma.2 The dominant transporter in the brain is the P-glycoprotein, or
Mdr1. Manipulation of the BBB so as to increase the entry of drugs and to reduce their evacuation is a major research goal for the treatment of several pathologies, including epilepsy and migraine.3–5
The capillary endothelium is known to respond to signals from surrounding cells, notably the astrocytes, and it is there-fore important to measure transport across the BBB in vivo.3,6
Post mortem imaging on brain sections of the distribution of
labeled molecules 共such as 14C sucrose兲 is still a common technique, but it gives a result for only one time-point per animal.7–9Magnetic resonance imaging共MRI兲 can follow ex-travasation of contrast agents, such as gadolinium complexes, that modify the magnetic susceptibility.9,10 However, only a few contrast agents are available, and in general, they are very different from biological molecules. Positron emission tomog-raphy共PET兲11allows a large range of molecules to be studied, but they must be labeled with positron-emitting isotopes. Also, these two techniques have poor spatial and temporal resolution.
In vivo optical imaging of extravasation of fluorescent
marker molecules offers promise of much better resolution in space 共⬍1m兲 and in time 共msec兲. Many different fluores-cent molecules are available, and fluorophores can be attached
1083-3668/2008/13共1兲/011002/11/$25.00 © 2008 SPIE Address all correspondence to: Jean-Claude Vial, CNRS UMR 5588 Laboratoire
Spectro 38402 Saint Martin d’Hères, France; Tel: 0476635866; Fax: 0476635495 Email: [email protected]
to other molecules of biological interest. With conventional light microscopy, it has been possible to image only vessels no deeper than tens of microns from the surface, as in skinfold tumor models12 or pial vessels on the brain surface,5,13 and also vessels in the retina.14However, the properties of these vessels differ from those of vessels within the brain itself.3 The advent of multiphoton microscopy, which uses excitation at near-infrared wavelengths,15makes possible in vivo imag-ing with submicron resolution at depths up to several hundred microns below the brain surface16and has allowed detection of localized extravasation of fluorescent dye in the mouse cortex in vivo.17However, one problem is that unless there is complete breakdown of the BBB, the concentration of dye within the vessels is vastly higher than in the extravascular tissue. In order to detect the extravascular dye, it is necessary to use a sensitivity so high that the fluorescence signal from the vessels themselves tends to contaminate, or even swamp, the true extravascular signal.
We show here that this problem can be avoided by simul-taneously infusing two fluorescent dyes, one with properties such that it does not cross the leaky BBB 共e.g., a high mo-lecular weight兲 and one that does. The two dyes both fluoresce when excited with intense near-infrared light, but they are chosen to emit at different wavelengths so that the distribu-tions of the two can be imaged separately. We increased the permeability of the BBB of mice by irradiating them with x-ray microbeams from a synchrotron.18We show that by bal-ancing the gains of the two image channels and subtracting the image of the nonextravasating dye from that of the ex-travasating dye, the distribution of extravascular dye can be imaged accurately. We derive a formula, which turns out to be very simple, for calculating the BBB permeability from the difference signal. The method could in principle be used with conventional epifluorescence microscopy of vessels close to the surface of the brain, but it offers more potential when two-photon microscopy is used to image deep into the cortex. In the course of this work, we found by serendipity that our extravasating dye, sulphorhodamine B, also strongly la-beled objects in the tissue. These too were best seen using the subtraction method. This observation raises the possibility that labeling of specific brain structures 共for example, astro-cytes兲 might be done in vivo via a vascular route. The identi-fication of the objects labeled by sulforhodamine B, and the conditions for labeling them, will be described elsewhere.19
2 Outline of the Theory
In this section, we outline the principle of the method and give the expressions necessary to calculate the specific perme-ability P of the BBB. A complete derivation is given in Sec. 7. 2.1 Qualitative Subtraction Imaging
A fluorescent marker dye is infused intravenously. A small fraction crosses the BBB and appears at a relatively low con-centration in the extravascular space. We want to image this low concentration in the presence of a much higher concen-tration in a dense network of capillaries. Although two-photon microscopy offers excellent spatial resolution by conventional criteria 共such as the Rayleigh criterion for the separation of two points兲, these criteria are not relevant to the present case in which the image of a fluorescent capillary extends, with a
low intensity, well beyond the geometrical limits of the cap-illary关solid lines in Figs. 1共a兲 and 1共b兲兴. Hence, a significant part of the acquired signal attributed to a point in the extravas-cular space comes, in practice, not from the extravasextravas-cular dye, but from the intense fluorescence of the much more concen-trated dye within the capillaries in the object plane关difference between solid and dashed lines in Fig. 1共b兲兴 or, in three-dimensional 共3-D兲 imaging, from blood vessels above or be-low the object plane. We overcome this problem by the use of a second dye that remains intravascular 共NP, for nonper-meant兲. The mouse is injected with a mixture of the two dyes, in our case, SRB共P, for permeant兲 and FITC-dextran 共NP兲. A region of the cortex is imaged using two-photon microscopy to give separate images of P and of NP. The essence of the method is to adjust the gains of the two detection chains so
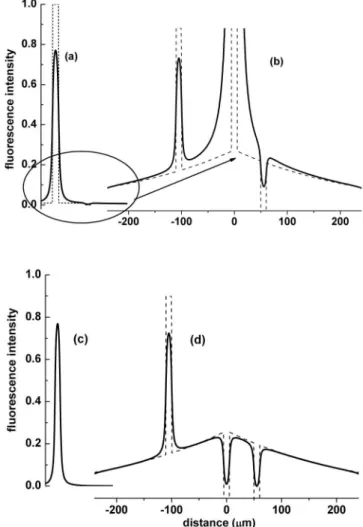
Fig. 1 Schematic numerical simulation of the differential imaging
method共a兲 represents a section of a capillary in the presence of dif-fusible dye 共dashed line兲 and its convolution with the laser point spread function共PSF, solid line兲. A small amount of dye has extrava-sated. The PSF was for the experimental conditions used: two-photon absorption of 800-nm light with a numerical aperture of 0.95. 共b兲 shows part of共a兲 on an expanded scale showing the dye extravasation and small hyperstained and unstained regions共dashed line兲 and their image共solid line兲. In this figure, it is difficult to separate the extrava-sation and PSF-induced broadening.共c兲 is equivalent to 共a兲, but for a dye that remains within the capillary.共d, solid line兲 is the numerical subtraction共a兲 to 共c兲, while the dashed line is the distribution of the extravasating dye.
that the two signals from the intravascular space are equal. When the NP signal in each pixel is subtracted from the P signal, the remaining signal in the extravascular space is al-most purely from the extravascular P molecules 关Fig. 1共d兲, Figs. 2共c兲 and 2共d兲兴.
2.2 Measurement of the Permeability of the BBB In the general problem of substance transfer, two main con-tributions should be considered: a diffusive component and a convective one. Bulk convective flow in the brain arises be-cause of communication between interstitial fluid and cere-brospinal fluid across the ependymal and pial surfaces.20The very low permeability of the blood vessel walls means that there is negligible bulk flow into or out of the interstitium in
other places. Because the extracellular spaces are narrow and filled with extracellular matrix, thermal convective flow can be neglected compared to diffusion.
The permeability coefficient, P, is defined by the equation7:
CeP共t兲 = P . .
冕
0
t
CiP共兲 d, 共1兲
where CeP共t兲 is the extravascular concentration of the
per-meant molecule P at time t, averaged over a region of interest 共ROI兲, and CiP共兲 is the plasma concentration at time, with
= 0 at the time of a bolus injection.is the ratio of capillary surface area to extravascular volume in the ROI. The
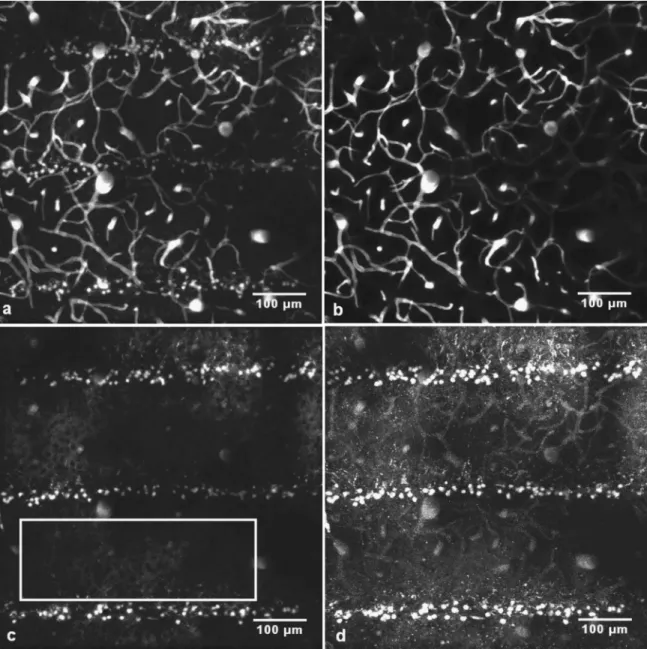
approxi-Fig. 2 共a兲 and 共b兲 z-projection 共maximum intensity兲 of stacks of images acquired in vivo from 150 to 300m below the dura共in steps of 2m兲 in the left parietal cortex of a nude mouse 48 h after microbeam irradiation. The mouse was injected with 100l of 100 mg ml−1FITC -dextran
solution and 50l of a 5 mg ml−1SRB solution. The observation was made 10 min after the dye injection.共a兲 is obtained from the emission of the
sulforhodamine B dye.共b兲 is obtained from the emission of the FITC-dextran dye. 共c兲 is the z-projection 共average intensity兲 of the difference stack. 共d兲 is the z-projection 共maximum intensity兲 of the difference stack. In images 共c兲 and 共d兲, the gain has been increased until the brightest pixels are just saturated.
mation has been made that CeP共t兲ⰆCiP共t兲. CiP共兲 is obtained
in parallel experiments by measurements in blood samples 共see Sec. 3.2兲. Hence P can be calculated if the ratio
CeP共t兲/CiP共t兲 and CiP共0兲 are known.
The voxelized images of the dyes P and NP are described by functions SP共i, j,k兲 and SNP共i, j,k兲, where the coordinates
共i, j,k兲 specify the voxel in the image space that corresponds to the point 共x,y,z兲 in the tissue. The photomultiplier gains are adjusted so that the signals SPand SNPfrom the two dyes
in the capillaries are equal:
SiP共i, j,k兲 = SiNP共i, j,k兲. 共2兲 SP and SNP are normalized so that the intensity of a pixel
corresponding to a signal coming entirely from within a blood vessel is set to2n− 1共Ref. 21兲, where n is the number of bits
of the analog to digital conversion. In the present experiment,
n = 8, giving a scale of 256 levels from 0 to 255.
We found experimentally that the two signals could indeed be matched in all the capillaries. With the intravascular sig-nals matched in this way, we define a difference signal:
Dif f共i, j,k兲 ⬅ SP共i, j,k兲 − SNP共i, j,k兲. 共3兲
Since SiP共i, j,k兲−SiNP共i, j,k兲=0, Dif f共i, j,k兲 is nonzero only
in the extravascular space and is uncontaminated by signal from the intravascular dyes. It is shown in Sec. 7.3, Eq.共24兲, that the ratio
CeP共t兲
CiP共t兲
⬅ Q共t兲 =
兺
Dif f共i, j,k,t兲N , 共4兲
where N is the number of pixels within the extravascular re-gion of interest.
2.3 Consequences of Bleed-Through Between the
Detection Channels
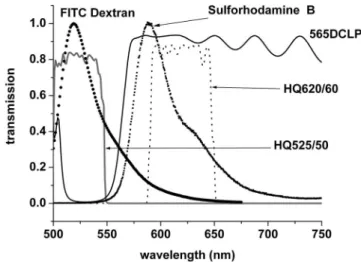
Equation 共4兲 assumed that each detection channel was per-fectly selective for the fluorescence from the corresponding dye. In practice, the separation was not perfect: as seen in Fig. 3, the fluorescence spectrum from FITC-dextran extended into the bandpass of the SRB channel. However, it is simple to show algebraically that this bleed-through cancels when the NP image is subtracted from the P image关Sec. 7.4, Eqs. 共25兲 and 共26兲兴. If there were significant leakage of fluorescence from SRB into the FITC-dextran channel, it would affect the calculation, but inspection of Fig. 3 shows that, with the filter used, the leak is very small.
3 Materials and Methods
All animal experiments were performed in accordance with the French Government guidelines for the care and use of laboratory animals共License Nos. 380321, A 3851610004, and B 3851610003兲.
3.1 Two-Photon Laser Scanning Microscopy
The microscope consisted of an MRC 1024 scanhead共Biorad United Kingdom兲, and a BX50WI upright microscope 共Olym-pus, Japan兲 fitted with a large, home-built, motorized stage 共see schematic in Vérant et al.21兲. The optics could be
switched between white light epi-illumination and observation and the multiphoton, laser scanning mode. An 800-nm exci-tation beam from a femtosecond Ti:Sapphire laser 共Tsunami pumped by a Millennia V; Spectra-Physics, Inc., Mountain View, California兲 was focused into the sample using a 20⫻water-immersion objective, numerical aperture 0.95, working distance of 2 mm 共Xlum Plan FI, Olympus兲. The beam was scanned in the x-y plane to acquire images 512 ⫻512 pixels 共598m⫻598m, 0.9 s/image兲. The obser-vation depth was changed between images using the motor drive of the objective to obtain a z-stack. The intensity of the incident laser beam was varied by rotating a half-wave plate in front of polarizers at Brewster’s angle so that the total average power delivered at the surface ranged from 10 to 200 mW. The confocal configuration was not used, the fluo-rescent light being diverted before reaching the scan head by a filter cube 共HQ525-50, 565DCLP, HQ620-60, Chroma Technology Corp., Rockingham, Vermont兲. This directed the red fluorescence of SRB and the green fluorescence of FITC-dextran separately onto two external photomultiplier tubes 共Fig. 3兲. Images were displayed, as acquired, by the Biorad operating system.
3.2 Fluorescent Probes
For the dye that remains in the intravascular space, we chose 70 kDa fluorescein isothiocyanate-dextran 共FITC-dextran; Sigma-Aldrich, St. Quentin Fallavier, France兲, which does not cross the normal BBB in significant quantities in the times we consider21 共⬍15 min兲. We studied the extravasation of the much smaller 共559 Da兲 sulforhodamine B 共Lambda Physik, Göttingen, Germany兲, a polar, hydrophilic molecule. Neither of these is toxic for small animals at doses used in this work 共see Material Safety Data Sheet22兲. Both dyes can be excited
with two-photon transitions with femtosecond pulses of light centered at800 nm.
Both dyes are efficiently excited by two-photon absorption within the spectral range of theTi: Sa laser, as shown on the Xu et al.23spectra.
Fig. 3 Fluorescence spectra of FITC-dextran and SRB and the
trans-mission curves of the interference filters used to select the fluores-cence. 565DCLP is the transmission of the dichroic mirror.
3.3 Microbeam Irradiation
Swiss Nude mice共Charles River, L’Arbresle, France兲 approxi-mately 5 weeks old, 14 to 24 g, were anesthetized with xylazine/ketamione共0.1%/1% in buffered saline, 10l per g body weight兲 and irradiated on the biomedical beamline ID17 of the European Synchrotron Radiation Facility, Grenoble, as described in Serduc et al.17Briefly, the upper part of the left cerebral hemisphere was irradiated in the anteroposterior di-rection by an array of 18, vertically orientated, parallel, 25-m-wide, microplanar beams; the distance between the cen-ters was211m. The entrance dose was 1000 Gy in a field 4 mm⫻4 mm.
3.4 Animal Preparation for Microscopy
About48 h after irradiation, the mice were anesthetized with isofluorane共5% for induction and 1.5% for maintenance兲, in a mixture of 70% N2O, 30% O2. A cranial window 3 mm in
diameter was made over the left parietal cortex, leaving the dura intact. The exposed brain surface was protected by a gel of 1% agarose in 0.9% saline solution. One hundredl of a solution of 100 mg ml−1 FITC-dextran in 0.9% saline was
added to 50l of 10 mg ml−1 SRB and injected in the tail
vein. The mouse was then placed on a stereotaxic frame modi-fied to permit rotation about the longitudinal axis; the cortical surface, where the laser light entered, could then be made horizontal. Imaging started within5 min of the dye injection. 3.5 Image Acquisition
To avoid the large blood vessels at the surface of the brain, imaging started at a depth from the surface of about150m. The offsets of the two photomultiplier tubes were first ad-justed to avoid any artifactual signal background. The power of the laser beam was set initially to about5 mW, and during continuous x, y scanning, the gains of the two detection chan-nels, monitored by the photomultiplier supply voltages, were increased so as to produce the highest fluorescence signals possible without saturation in the images of the large blood vessels. The BioRad software indicates saturation of the digi-tal signal in a voxel by a striking change of the false color, so this electronic matching of the images was readily performed. Planar scans of the fluorescent signals S共x,y,z兲 were then acquired at successive depths in the cortex with a z-step be-tween scans of 2 or1.5m. As the depth increased, absorp-tion and scattering of the exciting light and the emitted fluo-rescence reduced the image intensity. To compensate for this, the laser beam attenuation was reduced between scans, by manual control of the attenuator command, so as to keep the images of the large blood vessels close to saturated. The maximum power was about200 mW共unfocused at the brain surface兲. A stack 200m thick of 51 slices was acquired in 90 s.
3.6 Image Processing to Calculate Q
Most of the processing algorithms are available on ImageJ 共http://rsb.info.nih.gov/ij/兲.
1. Each image slice 共a planar scan of 512⫻512 pixels corresponding to 598⫻598m2兲 of both the SRB and the
FITC stacks 共n slices兲 was convolved with a Gaussian func-tion with a full width half maximum 共FWHM兲 of 2 pixels
corresponding to 2.3m. This step was necessary to elimi-nate isolated saturated pixels due to artifacts. Otherwise, such isolated intense pixels could have led to the normalization of step 2 failing to attribute the maximum intensity to large plunging vessels.
2. The pixel intensities for each slice were normalized on a scale from 0 to 1共in 255 steps for an 8-bit acquisition兲 using the “enhance contrast” command of ImageJ. The maximum is the signal entirely from within a large vessel.21This normal-ization automatically matches the intravascular signals
SiP共i, j,k兲 and SiNP共i, j,k兲.
3. Dif f共i, j,k兲⬅SP共i, j,k兲−SNP共i, j,k兲 关Sec. 7.2, Eq.
共14兲兴 was calculated for each pixel using homemade software written in Delphi-8共Borland Software Corp., Cupertino, Cali-fornia兲.
4. The parameter Q was then calculated from Eq.共4兲:
Q =
兺
Dif f N =兺
i,j,kDif f共i, j,k兲512⫻ 512 ⫻ n , 共5兲
for the case of n slices, each512⫻512 pixels. Note that this ratio is for the average intravascular and extravascular con-centrations, the intravascular concentration being for whole blood, not plasma.
3.7 Dye Clearance
Equation 共1兲, which defines the permeability coefficient P, requires knowledge of the concentration of SRB in the plasma
CiP共t兲 at all times from the time of injection to the time of
image acquisition. CiP共t兲 has been measured by Vérant et al.19
Briefly, a catheter was introduced in the jugular vein, and 100l of an SRB solution共5 mg ml−1兲 was injected. 共This is
the same quantity as for the imaging experiments.兲 At differ-ent times up to3 h after the injection, 40-l samples of blood were taken. The blood samples were diluted 41 times with heparinized physiological serum. One ml of each sample was centrifuged, and absorbance of the supernatant was measured at560 nm with a spectrophotometer; the reference was made on heparinized physiological serum. The concentration of SRB in the plasma of the blood sample taken at time t was calculated as:
CiP共t兲 = Cspect⫻共41 − H兲, 共6兲
where Cspectis the concentration measured in the supernatant
of the spectrometer sample and H 共⬵0.42; Ref. 24兲 is the hematocrit in the jugular vein.
4 Results
4.1 Subtraction Imaging of Extravasated Dye
Figures 2共a兲 and 2共b兲 show z-projected stacks of simulta-neously acquired images of SRB and FITC-dextran fluores-cence. The “maximum intensity” mode of ImageJ was used: this means that for any pixel of coordinate共im, jn兲 in the final
image, only the most intense pixel 共im, jn兲 in the z-stack is
displayed. This mode shows the three-dimensional 共3-D兲 or-ganization of the object. The electronic gains of the two chan-nels had been adjusted repeatedly during the acquisition of the stack so that the intensities of the blood vessels were the
same. The images of the blood vessels are almost identical, but in the SRB image, additional extravascular features can be made out in the form of three spotted stripes crossing the image horizontally. Each FITC-dextran slice image of the stack was then subtracted from the corresponding SRB slice image, and the resulting stack is displayed in two ways: in the “maximum intensity” mode 关Fig. 2共d兲兴, and in the “average intensity” mode关Fig. 2共c兲兴. In the “average intensity” mode, the intensities of each pixel共im, jn兲 in all slices were averaged
to give the intensity in the final image. With either mode of display, the subtraction imaging almost completely eliminated the blood vessels and allowed the stripes to be seen more clearly关Figure 2共c兲 and 2共d兲兴. Such stripes were never seen in nonirradiated mice. The plane of the irradiation microbeams was vertical 共in the x,z plane of the stack兲, so their narrow profiles are seen in the image. The width共about 30m兲 and separation 共about 200m兲 of the stripes clearly correspond
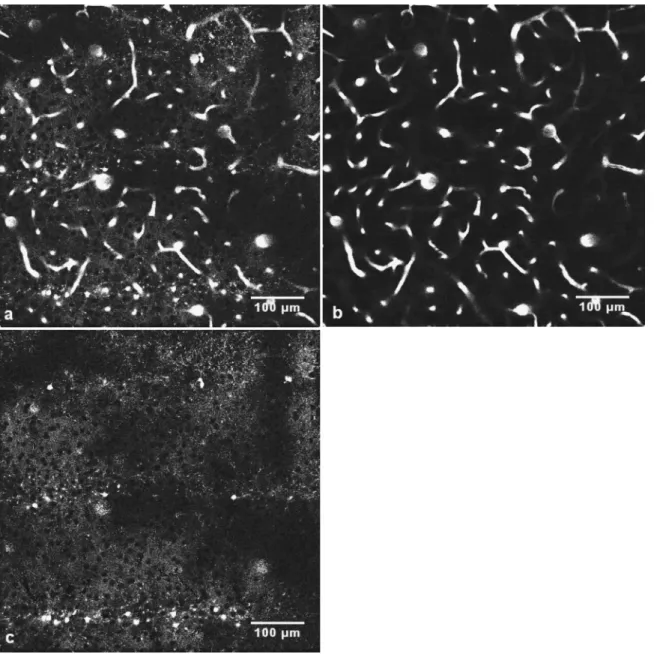
to the geometry of the microbeams.17The average diameter of the bright objects was 7.7m, SD= 0.4m. We have not carried out experiments to identify these objects共see Sec. 5兲. In subtraction images of pairs of single optical slices, it was seen that, between stripes, there weredark objects, diameter about10m, from which SRB was excluded关Fig. 4共c兲兴. The presence of these dark objects shows that the extravascular signal was not an artifact共due to an incorrectly set zero level, for example兲 and that SRB was indeed present in the extravas-cular tissue outside the bright 7.7m objects. Figure 4共c兲 also shows that much of the extravascular SRB was concen-trated in small granules, about 2m in diameter.
4.2 Measurement of the Ratio of Mean Extravascular
to Intravascular Concentrations
This is the first step toward determining a permeability coef-ficient, P, for SRB crossing the BBB. We are interested in the
Fig. 4 Images obtained from the stacks of Fig. 2. 共a兲 A slice image at a depth of z=150m below the dura for the SRB channel.共b兲 Same conditions, but for the FITC-dextran channel.共c兲 Image obtained by subtracting the FITC-dextran image from the SRB image.
total quantity of SRB in the extravascular space of the region of interest: the concentration of SRB in bright spots, and its exclusion from certain other volumes, will not change the estimation of P共provided all the extravascular dye molecules fluorescence with equal efficiency兲. In Fig. 2共c兲, a z-projection of 76 slices of the subtracted images, we find that the ratio Q of the mean extravascular to the intravascular concentration for the complete volume is关from Eq. 共4兲兴:
Q =
兺
i,j,kDif f共i, j,k兲
512⫻ 512 ⫻ 76 = 0.019, 共7兲
at time t= 10 min after the bolus infusion of dye.
When the stripes are excluded, for example, the rectangu-lar ROI shown in Fig. 2共c兲 is Q=0.017, which is only 10% less than the value for the whole volume.
4.3 Dye Clearance
We write CiP共t兲=CiP共0兲⫻ f共t兲, where CiP共0兲 is the plasma
concentration immediately after the dye injection. It was found experimentally that:
f共t兲 = 0.68 exp共− t/1兲 + 0.27 exp共− t/2兲 + 0.045, 共8兲
where 1= 0.36⫾0.4 min and 2= 30⫾7 min 共Vérant et al.19兲 The value of CiP共0兲, which is not necessary for the
calculation of P, was0.35 g/l 共0.63 mM兲. 4.4 Calculation of Permeability
P is calculated from the dye concentration in the plasma, not
in the whole blood.7 Therefore, CeP共t兲/CiP共t兲共plasma兲
= Q共t兲/共1−H兲, where H is the hematocrit in the mouse. Tak-ing H as 0.42 共Ref. 24兲 and Q共t兲=0.019 gives
CeP共t兲/CiP共t兲=0.033, for t=10 min. Using Eqs. 共1兲 and 共8兲,
we calculate P ·= 1.7⫻10−3min−1 关which is 1.7l 共min. g of brain兲−1兴.
The specific capillary surface is given by =共CBV兲·2/具r典, where 具r典 is the mean capillary radius, and
CBV is the cerebral blood volume of the capillaries in the
cortex. CBV in the mouse is 0.022共Ref. 21兲, and具r典 measured from Fig. 2共b兲 is 2.4m. With these values, = 183 cm−1,
and P= 10−6cm/s. Note that this is a mean value for all the
capillaries within the field of view.
5 Discussion
5.1 Subtraction Imaging of Extravascular Space Injection of dye into the blood, with the aim of labeling struc-tures within the parenchyma, has the advantage of being tech-nically relatively simple and of introducing dye throughout the brain. This approach has previously been used to label amyloid plaques,25 and it is the only way of using dye to measure the permeability of the BBB. An obstacle has been that the weak extravascular fluorescence is difficult to mea-sure in the presence of the intense fluorescence from the blood vessels. The subtraction method we have described here over-comes this difficulty.
As with sulforhodamine 101 applied to the cortex,26 we found that sulforhodamine B labeled specific objects 关Fig. 2共d兲兴. In our case, the labeled objects were in the tracks of the
x-ray microbeams, approximately 48 h after the irradiation. At this time, in brain sections stained with hematoxylin-eosin, nuclear condensation 共pyknosis兲 is observed, and five days later, almost all cell bodies have disappeared from the micro-beam tracks.17Sulforhodamine B stains fixed cells in vitro.27 It is therefore possible that the stained objects were dying cells.
In tissues other than the brain, intravascular dyes pass readily into the tissue,28 which is presumably why the SRB was cleared so rapidly from the blood in the present experi-ments. This property has previously been used to introduce specific fluorescent markers into the kidney.29In a brain with a normal BBB, entry of dyes into the parenchyma is much slower, but even here, there is some possibility of labeling from the blood.
5.2 Measurement of BBB Permeability
Our measurements gave a mean value of P in the ROI of 10−6cm/s. This is larger than the value of 0.5⫻10−6cm/s
for SRB obtained for pial venular capillaries in normal 共unir-radiated兲 rat brain by the single vessel occlusion technique5 but close to the value of2⫻10−6cm/s obtained under acute
bradykinin treatment.5As shown by Nicholson,30a molecule the size of SRB will diffuse about 1000m through brain interstitium in10 min, so with the present protocol, there was ample time for SRB to diffuse throughout the spaces between the irradiation tracks. Hence, the present results do not distin-guish between a uniform increase in P throughout the field of view and a localized increase only 共or mainly兲 within the microbeam irradiation tracks. In the latter case 共a local per-meability increase兲, the local value of P would be greater than the mean P by the fraction 共total volume/irradiated volume兲. This local P would be10−5cm/s. Dialysis experiments have
shown that part of the SRB in the blood is bound to albumin, so the values of P for free SRB are underestimated19 by a factor共total concentration/free concentration兲 of 1.5.
These permeability values should be considered as crude because the hematocrit in small vessels is not exactly known, but certainly smaller than the value used here. In addition, the force that drives the diffusion is the concentration gradient across the vessel wall—all in fluid. The dye is measured in the tissue as a whole, which is approximately 5 times the volume of the ECS alone. These two considerations work in opposite directions, but we can estimate that our calculated permeabil-ity is underestimated by another factor of 2
5.3 Advantages and Limitations of the Optical
Subtraction Method for Measuring BBB Permeability
Our preliminary measurement of the permeability of the BBB within the brain, at some depth from the surface, appears to be the first such measurement to use an optical technique in vivo. Unlike post mortem analysis of the distribution in sections of brain of a marked molecule 共such as 14C sucrose兲, the tech-nique opens the possibility of making repeated measurements in one animal. In principle, it should be possible to follow a rapid change in P, over a few minutes, such as that induced by bradykinin,5or to make repeated measurements at intervals of days or weeks, and follow slow changes, as has been done
using two-photon microscopy to follow changes in neuronal morphology.31
If the mean value of P for the blood vessels within the region of interest共ROI兲 were greater than the mean value of P outside the ROI, then there would be a net diffusional flux of dye out of the ROI, and this would lead to underestimation of
P. The method therefore requires that any heterogeneity of P
extends throughout a region several times larger than the ROI. In contrast, this increase need not be uniform over distances small compared to the ROI. Alternatively, a highly localized increase in P confined to a fewm2of capillary endothelium might be studied by measuring cePbefore significant
quanti-ties of the dye have diffused out of the ROI.
5.4 Uneven Concentration of Extravasated Dye SRB in the extravascular space was not uniformly distributed, being concentrated in small granules, excluded from other objects, and within the irradiation tracks, concentrated in ob-jects 7.7m in diameter 关Fig. 4共c兲兴. Provided the fluores-cence efficiency共two-photon absorption cross section⫻ fluo-rescence quantum efficiency兲 of the dye molecules remains the same as in the blood, this introduces no error in the mea-surement of P. SRB has been reported to bind to proteins in nonviable cells,27and such binding may occur in the heavily stained objects in the microbeam tracks. However, it has been shown that binding of the SRB to proteins does not change its fluorescence.27
6 Conclusion
Injection of a nonpermeant dye together with one that crosses the BBB opens new possibilities both for imaging intraparen-chymal features and for quantitative measurements of BBB permeability in vivo.
7 Supplementary Material: Theory of
Quantitative Subtraction Imaging
We consider one dye that crosses the BBB, which we denote P共for permeant; in our case, SRB兲, and one dye that remains intravascular and is denoted NP共in our case, FITC-dextran兲. 7.1 List of Symbols
• P 共subscript兲 denotes dye that can cross the BBB. P 共capital兲 is the permeability coefficient of the BBB.
• NP denotes dye that remains intravascular.
• Fi共x,y,z兲 is a structure function describing the vascular
space. Fi共x,y,z兲=1 in the vascular space, 0 elsewhere.
• Fe共x,y,z兲 describes the extravascular space. Fe共x,y,z兲
= 0 in the vascular space, 1 elsewhere.
• i共x,y,z兲,e共x,y,z兲 denote convolutions of the
struc-ture functions with the point spread function, PSF共x,y,z兲. It is not necessary to know the PSF.
• CiP共x,y,z,t兲 is the intravascular concentration of dye P.
• CiNP共x,y,z,t兲 is the intravascular concentration of dye
NP.
• CeP共x,y,z,t兲 is the extravascular concentration of dye P.
By definition, for the nonpermeant dye, CeNP共x,y,z,t兲=0.
• EP共x,y,z,t兲, ENP共x,y,z,t兲 denote intensities of light
emission of P and NP from point共x,y,z兲 in the tissue.
• SP共x
⬘
, y⬘
, z⬘
, t兲, SNP共x⬘
, y⬘
, z⬘
, t兲 denote correspondingsignals from point共x
⬘
, y⬘
, z⬘
兲 in the image space.• ␣ is a factor that accounts for bleed-through of light from the shorter wavelength dye 共FITC-dextran兲 into the longer wavelength channel.
•  is the corresponding factor that accounts for bleed-through of light from the longer wavelength dye共SRB兲 into the shorter wavelength channel.
• Q共R,t兲 denotes the ratio of extravascular to intravascular concentrations of the permeant dye P in the region of interest
R.
• Vi/Ve is the specific blood volume. 共Strictly, it is
Vi/共Ve+ Vi兲, but VeⰇVi.兲
7.2 Subtraction Imaging
The image of a fluorescent capillary extends, with a low in-tensity, well beyond the geometrical limits of the capillary 关Fig. 1共c兲兴. Hence, a significant part of the acquired signal attributed to a point in the extravascular space comes, in prac-tice, not from extravasated dye but from the much more in-tense fluorescence of the more concentrated dye within the capillaries关difference between solid and dashed lines in Fig. 1共b兲兴. This problem is overcome by using a second dye that remains intravascular.
In two-photon microscopy, the fraction of the incident light is small so that the fluorescence is proportional to the concen-tration of the dye, C, and also to its absorption coefficient, to the quantum efficiency of the fluorescence, and to the incident intensity of the exciting light. The latter factors are combined in a constant K for each dye. Hence, the intensity of emitted light for the permeant dye P is given by:
EP共x,y,z,t兲 = KPCeP共x,y,z,t兲Fe共x,y,z兲
+ KPCiP共x,y,z,t兲Fi共x,y,z兲, 共9a兲
where the structure functions, Feand Fi, which can have
val-ues of 0 or 1, describe the extravascular and intravascular spaces.
By definition, for the nonpermeant dye, CeNP= 0 and
ENP共x,y,z,t兲 = KNPCiNP共x,y,z,t兲Fi共x,y,z兲. 共9b兲
The distribution of the intensities of the pixels in the ac-quired image differs from E共x,y,z兲. The main reason is that the laser beam is not focused to a perfect point but excites fluorophores in a volume that can be described by a point spread function共see Vérant et al.21兲. For quantitative measure-ments of the extravascular concentration, CeP共x,y,z,t兲, it is
necessary that the detection chain be linear 共see below兲, but for qualitative detection of weak extravascular fluorescence, it is permissible to increase the gains of the two channels until the relatively intense fluorescence from the blood vessels starts to saturate the amplifiers. We denote the combined op-tical and electronic effects by a function PSF共x,y,z兲, which is assumed to be the same for both P and NP. We then show that the subtraction method makes it unnecessary to know
PSF共x,y,z兲. In the images, the structure functions F are
共x,y,z兲 =
冕
−⬁ ⬁冕
−⬁ ⬁冕
−⬁ ⬁ F共,,兲PSF共x − ,y −,z −兲 ddd. 共10兲We define the images by pixel intensities S共t兲 in an image space共x
⬘
, y⬘
, z⬘
, t兲:Sp共x⬘,y⬘,z⬘,t兲 ⇔ kpCeP共x,y,z,t兲e共x,y,z兲 + kpCiP共t兲i共x,y,z兲,
共11a兲
SNP共x⬘,y⬘,z⬘,t兲 = SiNP共x⬘,y⬘,z⬘,t兲 ⇔ kNPCiNP共t兲i共x,y,z兲,
共11b兲 where kPand kNPare new constants that include KPand KNP
and also take into account the properties of the detection chain.
These expressions suppose a moderate spatial variation of the extravascular dye concentration compared with the scale of the PSF.
We now adjust the gains of the two detection chains so that the signals from the vascular space are equal:
SiP共x⬘,y⬘,z⬘,t兲 = SiNP共x⬘,y⬘,z⬘,t兲共intravascular space兲. 共12兲 We found experimentally that the two signals could indeed be matched throughout the vascular space, as would be expected provided the two dyes are both excluded from the blood cells, as is the case for SRB and FITC-dextran. From Eqs.共11兲 and 共12兲:
kPCiP共x,y,z,t兲 = kNPCiNP共x,y,z,t兲. 共13兲
We define a difference signal Dif f共x
⬘
, y⬘
, z⬘
, t兲 obtained by subtracting Eq.共11b兲 from Eq. 共11a兲:Dif f共x⬘,y⬘,z⬘,t兲 ⬅ Sp共x⬘,y⬘,z⬘,t兲 − SNP共x⬘,y⬘,z⬘,t兲
⇔ kpCeP共x,y,z,t兲e共x,y,z兲. 共14兲
Hence, within the resolution of the two-photon microscopy,
Dif f共x
⬘
, y⬘
, z⬘
, t兲 is present only in the extravascular space and is uncontaminated by signals from the intravascular dyes. Provided the two intravascular signals are matched, the gain can be increased almost without limit to reveal extracellular features.7.3 Quantification of Dye Extravasation: Ratio of
Extravascular Concentration to Intravascular Concentration
Let Q共R,t兲 be the ratio between extravascular and intravas-cular concentrations of the permeant dye P in the region of interest R, at a given time t:
Q共R,t兲 =CeP共R,t兲
CiP共R,t兲, 共15兲
where CeP共R,t兲 is the average concentration of P in region R.
When the intravascular signals are matched 关Eqs. 共12兲 and 共13兲兴: CiP共R,t兲 = CiNP共R,t兲kNP/kP, 共16兲 Q共R,t兲 = CeP共R,t兲 CiNP共R,t兲 kP kNP . 共17兲
From Eq. 共11b兲, summating over the pixels in region R, at time t:
kNP. CINP=
兺
SNP
兺
i. 共18兲
Provided that R covers a large number of pixels, the sum of the convolution of the intravascular function equals the sum of the intravascular function itself:
兺
i=兺
Fi. 共19兲 So Eq.共18兲 becomes: kNP· CiNP=兺
SNP兺
Fi , 共20兲and similarly Eq.共14兲 gives:
kP· CeP=
兺
Dif f
兺
Fe. 共21兲
In Eqs.共20兲 and 共21兲, the summations over Fiand Fegive the
intravascular volume Vi and the extravascular volume Ve
within the region of interest. So the final expression for Q becomes: Q =
兺
Dif f兺
SNP Vi Ve . 共22兲The ratio Vi/Veis the specific blood volume, which as shown
by Vérant et al.21can also be calculated by summing over the same region of interest:
Vi
Ve
=
兺
SNP
N , 共23兲
where SNPhas been scaled共normalized兲 in each image slice
of the stack to be unity in pixels corresponding to fluores-cence that is entirely intravascular, and N is the total number of pixels within the region of interest.
We finally obtain:
Q =
兺
Dif fN , 共24兲
where the scale of Diff follows from the normalizations of
7.4 Consequences of Bleed-Through Between the
two Detection Channels
Eq.共9兲 assumed that each photomultiplier detected light emit-ted by only one dye. As seen in Fig. 3, the fluorescence spec-trum from FITC-dextran extends into the bandpass of the SRB channel and makes a contribution that we denote as frac-tion␣ of its detection in the FITC-dextran channel, and con-versely, a very small amount of fluorescence, , from SRB extends into the FITC-dextran bandpass. Adding terms to Eq. 共11兲 to account for this gives:
SP= kPCiP⌽i +␣kNPCiNP⌽i + kPCeP⌽e, 共25a兲
SNP= kNPCiNP⌽i +kPCiP⌽i +kPCeP⌽e. 共25b兲
The signals from intravascular space are adjusted to match:
kPCiP⌽i +␣kNPCiNP⌽i = kNPCiNP⌽i +kPCiP⌽I.
Hence:
Dif f共xyz兲 ⬅ SP− SNP=共1 −兲kPCeP⌽e. 共26兲
We see that the␣term is eliminated, leaving only, which by inspection of Fig. 3, is very small.
7.5 Measurement of the Permeability of the BBB The transport across the BBB of a substance that is not carried by transporter molecules follows from Fick’s Law7:
dCeP共t兲
dt =
P . S Ve
.关CiP共t兲 − CeP⬘ 共t兲兴, 共27兲
where S is the surface area of the blood vessels in the region of interest, Ve is the extravascular volume, the equation
de-fines a permeability constant P, and CeP
⬘
共t兲 is the concentra-tion immediately outside the BBB. However, molecules of MWt up to about 10,000 diffuse freely through the extracel-lular clefts of brain tissue, and Wu et al.12have estimated that provided the measurement is made at a time sufficiently short that mean CeP共t兲ⰆCiP共t兲, then CeP⬘
共t兲ⰆCiP共t兲. Hence:dCeP共t兲
dt ⬵P . CiP共t兲, 共28兲
where= S/Ve. We write:
CiP共t兲 ⬅ CiP共0兲 . f共t兲, 共29兲
where CiP共0兲 is the intravascular concentration just after the
injection, at t= 0, and f共t兲 is the time-course of the decline in
CiPas the dye is cleared from the blood. Integration gives:
CeP共t兲 = P . . CiP共0兲 .
冕
0
t
f共兲 d. 共30兲 From Eqs.共15兲 and 共29兲,
CeP共t兲 = Q共t兲 . CiP共0兲 . f共t兲. 共31兲 Hence: P = Q共t兲 . f共t兲
冕
0 t f共t兲 dt . 共32兲Inserting Eq. 共24兲 for Q共t兲:
P =
兺
Dif f共t兲 N . f共t兲 冕
0 t f共t兲dt . 共33兲f共t兲 is obtained from measurements of CP in the blood.
Acknowledgments
This work had been supported by grants from Ligue Contre le Cancer共Comité de l’Isère兲, Association pour la Recherche sur le Cancer, Programme Interdisciplinaire CNRS-INSERM-CEA«IPA», and Région Rhône-Alpes 共Appel d’Offre Thé-matique Cancer兲. Raphaël Serduc received a grant from La Ligue Contre le Cancer.
References
1. I. Klatzo, “Pathophysiological aspects of brain edema,” Acta
Neuro-pathol. (Berl) 72, 236–239共1987兲.
2. D. M. Hermann, E. Kilic, A. Spudich, S. D. Kramer, H. Wunderli-Allenspach, and C. L. Bassetti, “Role of drug efflux carriers in the healthy and diseased brain,” Ann. Neurol. 60, 489–498共2006兲. 3. W. M. Pardridge, “Blood-brain barrier biology and methodology,” J.
Neurovirol 5, 556–569共1999兲.
4. E. Oby and D. Janigro, “The blood-brain barrier and epilepsy,”
Epi-lepsia 47, 1761–1774共2006兲.
5. M. H. Sarker, D. E. Hu, and P. A. Fraser, “Acute effects of bradyki-nin on cerebral microvascular permeability in the anaesthetized rat,”
J. Physiol. (London) 528共1兲, 177–187 共2000兲.
6. M. A. Petty and E. H. Lo, “Junctional complexes of the blood-brain barrier: permeability changes in neuroinflammation,” Prog.
Neuro-biol. 68, 311–323共2002兲.
7. C. S. Patlak, R. G. Blasberg, and J. D. Fenstermacher, “Graphical evaluation of blood-to-brain transfer constants from multiple-time uptake data,” J. Cereb. Blood Flow Metab. 3, 1–7共1983兲. 8. B. T. Hawkins and R. D. Egleton, “Fluorescence imaging of
blood-brain barrier disruption,” J. Neurosci. Methods 151, 262–267共2006兲. 9. R. Sood, S. Taheri, E. Y. Estrada, and G. A. Rosenberg, “Quantitative evaluation of the effect of propylene glycol on BBB permeability,” J.
Magn. Reson Imaging 25, 39–47共2007兲.
10. S. Taheri and R. Sood, “Kalman filtering for reliable estimation of BBB permeability,” J. Magn. Reson Imaging 24, 1039–1049共2006兲. 11. S. Syvanen, G. Blomquist, L. Appel, M. Hammarlund-Udenaes, B. Langstrom, and M. Bergstrom, “Predicting brain concentrations of drug using positron emission tomography and venous input: model-ing of arterial-venous concentration differences,” Eur. J. Clin.
Phar-macol. 62, 839–848共2006兲.
12. N. Z. Wu, B. Klitzman, G. Rosner, D. Needham, and M. W. Dew-hirst, “Measurement of material extravasation in microvascular net-works using fluorescence video-microscopy,” Microvasc. Res. 46, 231–253共1993兲.
13. A. Bultmann, L. Schilling, A. Findling, and M. Wahl, “Investigation of blood-brain barrier permeability by means of computerized image analysis,” Vasa 23, 195–204共1994兲.
14. J. Takahashi, F. Mori, T. Hikichi, and A. Yoshida, “Effect of aceta-zolamide on outward permeability of blood-retina barrier using dif-ferential vitreous flyorophotometry,” Curr. Eye Res. 23, 166–170 共2001兲.
15. W. Denk, J. H. Strickler, and W. W. Webb, “Two-photon laser scan-ning fluorescence microscopy,” Science 248, 73–76共1990兲. 16. D. Kleinfeld, P. P. Mitra, F. Helmchen, and W. Denk, “Fluctuations
and stimulus-induced changes in blood flow observed in individual capillaries in layers 2 through 4 of rat neocortex,” Proc. Natl. Acad.
17. R. Serduc, P. Vérant, J. C. Vial, R. Farion, L. Rocas, C. Rémy, T. Fadlallah, E. Brauer, A. Bravin, J. Laissue, H. Blattmann, and B. van-der-Sanden, “In vivo two-photon microscopy study of short-term effects of microbeam irradiation on normal mouse brain microvascu-lature,” Int. J. Radiat. Oncol., Biol., Phys. 64, 1519–1527共2006兲. 18. J. A. Laissue, G. Geiser, P. O. Spanne, F. A. Dilmanian, J. O.
Geb-bers, M. Geiser, X. Y. Wu, M. S. Makar, P. L. Micca, M. M. Nawrocky, D. D. Joel, and D. N. Slatkin, “Neuropathology of abla-tion of rat gliosarcomas and contiguous brain tissues using a mi-croplanar beam of synchrotron-wiggler-generated x rays,” Int. J.
Cancer 78, 654–660共1998兲.
19. P. Vérant et al., to be published, and P. Vérant, Thesis in Physical Sciences, University Joseph Fourier, Grenoble, France共2006兲. 20. H. F. Cserr, M. Depasquale, C. S. Patlak, R. G. L. Pullen,
“Convec-tion of cerebral interstitial fluid and its role in brain volume regula-tion,” Ann. N.Y. Acad. Sci. 481, 123–133.共1987兲.
21. P. Vérant, R. Serduc, B. van-der-Sanden, C. Remy, and J. C. Vial, “A direct method for measuring mouse capillary cortical blood volume using multiphoton laser scanning microscopy,” J. Cereb. Blood Flow
Metab. 27, 1072–1081共2007兲.
22. http://www.sciencelab.com/msdsList.php.
23. C. Xu and W. W. Webb, “Measurement of two-photon excitation cross sections of molecular fluorophores with data from 690 to 1050 nm,” J. Opt. Soc. Am. B 13, 481–491共1996兲.
24. J. Vogel, I. Kiessling, K. Heinicke, T. Stallmach, P. Ossent, O. Vogel, M. Aulmann, T. Frietsch, H. Schmid-Schonbein, W. Kuschinsky, and
M. Gassmann, “Transgenic mice overexpressing erythropoietin adapt to excessive erythrocytosis by regulating blood viscosity,” Blood 102, 2278–2284共2003兲.
25. E. M. Robbins, R. A. Betensky, S. B. Domnitz, S. M. Purcell, M. Garcia Alloza, C. Greenberg, G. W. Rebeck, B. T. Hyman, S. M. Greenberg, M. P. Frosch, and B. J. Bacskai, “Kinetics of cerebral amyloid angiopathy progression in a transgenic mouse model of Alzheimer disease,” J. Neurosci. 26, 365–371共2006兲.
26. A. Nimmerjahn, F. Kirchhoff, J. N. Kerr, and F. Helmchen, “Sulfor-hodamine 101 as a specific marker of astroglia in the neocortex in
vivo,” Nat. Methods 1, 31–37共2004兲.
27. P. Skehan, R. Storeng, D. Scudiero, A. Monks, J. McMahon, D. Vis-tica, J. T. Warren, H. Bokesch, S. Kenney, and M. R. Boyd, “New colorimetric cytotoxicity assay for anticancer-drug screening,” J.
Natl. Cancer Inst. 82, 1107–1112共1990兲.
28. G. Bouffard, “Injection des couleurs de benzidine aux animaux nor-maux,” Ann. Inst. Pasteur (Paris) 20, 539共1906兲.
29. K. W. Dunn, R. M. Sandoval, K. J. Kelly, P. C. Dagher, G. A. Tanner, S. J. Atkinson, R. L. Bacallao, and B. A. Molitoris, “Functional stud-ies of the kidney of living animals using multicolor two-photon mi-croscopy,” Am. J. Physiol.: Cell Physiol. 283, 905–916共2002兲. 30. C. Nicholson, “Diffusion and related transport mechanisms in brain
tissue,” Reports on Progress in Physics 64, 815–884共2001兲. 31. A. K. Majewska, J. R. Newton, and M. Sur, “Remodeling of synaptic
structure in sensory cortical areas in vivo,” J. Neurosci. 26, 3021– 3029共2006兲.