Development of semi-solid alkaline flow battery
by
Thaneer Malai Narayanan
B. Eng. Mechanical Engineering
Keio University, 2016
SUBMITTED TO THE DEPARTMENT OF MECHANICAL ENGINEERING IN PARTIAL
FULFILLMENT OF THE REQUIREMENTS FOR THE DEGREE OF
MASTER OF SCIENCE IN MECHANICAL ENGINEERING
AT THE
MASSACHUSETTS INSTITUTE OF TECHNLOGY
SEPTEMBER 2018
C 2018 Massachusetts Institute of Technology. All rights reserved.
Signature of Author:...
Certified by:...
Signature redacted
...
. . .
Department of Mechanical Engineering
August 10, 2018
Signature redacted
Yang Shao-Horn
W.M. Keck Professor of Energy
Department of Mechanical Engineering
Development of semi-solid alkaline flow battery
by
Thaneer Malai Narayanan
Submitted to Department of Mechanical Engineering on August 10, 2018 in Partial Fulfilment of the Requirements for the Degree of Master of Science in Mechanical Engineering
ABSTRACT
Flow battery is an attractive energy storage system due to its ability to decouple power and energy outputs, and its less stringent geometric requirement. However, commercial flow battery technology suffers from low energy density (-40 Wh/Lcatholyte), high membrane cost (-$ 500/M2
)
and species crossover. One elegant method to overcome all this problems is utilize flowable semi-solid electrode. Although there have been several reports in the literature regarding performance of various semi-solid flow batteries, there is still lack of understanding on how to design the suspension electrode and its impact on flow cell design and performance. In this thesis, we emphasize on three main properties, namely stability, conductivity and flowability for high performing suspension electrode for Zn-Ni alkaline battery chemistry.
Firstly, we recognized interplay of forces acting on particles in a suspension electrode and
designed suspending medium with jammed Carbopol microgel structures to prevent
sedimentation of the large particles. Secondly, we determined percolation threshold of conductive additive and investigated its effect on electrochemical performance of the semi-solid electrodes in a closed static cell. We found that conductive additive concentration should be well above percolation threshold to obtain maximum discharge capacity of Ni(OH)2. Thirdly, based on the understanding from conductivity and stability of the suspension, we designed catholyte (- 5 M Ni(OH)2) and tested its electrochemical performance in a static cell. We were able to achieve energy density of 137 Wh/Latholyte, about 3 times of commercial flow battery. We then assessed flowability of the suspensions. Catholyte and anolyte had yield stress of 204 Pa and 447 Pa respectively. We found that by choosing appropriate flow cell stack design energy loss due to pumping can be minimized to < 1% for continuous flow. Finally, flow cells were designed to test the electrochemical performance of these suspensions in an open system.
Thesis Supervisor: Yang Shao-Horn Title: W.M. Keck Professor of Energy Thesis Supervisor: Gareth McKinley
Acknowledgment
Both electrochemistry and rheology were a new experience for me. I would not have been able to complete this interdisciplinary work without the support of Professor Yang Shao-Horn and Professor Gareth McKinley. I would like to thank them not only for their technically expertise but also for their guidance on how to approach a new research topic and how to be a better researcher in general. I am also truly indebted to Yunguang and Michal, who have I have worked closely in this project. Their wide experience, intuition and know-hows were truly essential in shaping up this interdisciplinary project. My thanks also goes to EEL lab members, who have maintained very energetic and joyful lab culture. This work would also not been possible without the help of graduate students from HML in using the rheometer and in rheology in general. I also would like to take this opportunity to thank ENI for their sponsorship and continued interest and confidence in this project. Special thanks goes to my friends here in US, back home in Malaysia and in Japan for their unwavering emotional support throughout this two years. Finally, to my mother, father, sisters and their families, none of this would not have been possible without all your encouragement and love.
Table of Contents
List of Figures...6
1. Introduction...12
1.1 Electrochem ical energy storage system s for the grid ... 12
1.2 Suspension electrode for sem i-solid flow battery ... 18
1.3 Yield stress fluids ... 23
1.4 N i-Zn alkaline battery... 27
1.5 Scope of study ... 32
1.5.1 Objective of this study ... 32
1.5.2 Choice of battery chemistry... 32
1.5.3 Stability, conductivity and flowability ... 33
2. Experim ental procedures... 35
2 .1 M ateria ls ... 3 5 2.2 Preparation of suspensions... 35
2.2.1 Catholyte preparations ... 35
2.2.2 Anolyte preparations... 36
2.3 Electrochem ical m easurem ents... 36
2.3.1 Conductivity measurements... 36
2.3.2 Electrochemical performance of suspension in static closed cell... 37
2.4 Rheological m easurem ents ... 38
3.1 Developing yield stress in continuous medium to design stable suspension...39
3.2 Percolation of conductive additive and its effect on electrochemical performance...46
3.3 Semi-solid battery in static closed cell with high energy and power densities...53
3.4 Flowability of catholyte and anolyte ... 56
3.4.1 Flow curves for catholyte and anolyte... 56
3.4.2 Energy loss calculations for wide and multichannel flow battery stack... 58
3.4.3 Bingham number and plug flow visualization...61
3.5 Flow cell design and performance...64
4. Conclusions...67
5. Future work and open questions... 70
List of Figures
Figure 1: (left axis) Growth in renewable energy capacity addition for various renewable energy technology in global market. (right axis) Percentage of energy capacity addition from wind and solar P V .5 . . . . .
.... .. ... . . . ... 14 Figure 2: Conceptual positioning of various grid scale energy storage technologies with respect to their storage power and storage time2 . . . .14 Figure 3: Conventional Li-ion battery architectures7... . . . .. . . .. . . 15 Figure 4: Architecture of flow battery, with two (left) or four (right) tanks as described by Thaller 1 9 7 5 .10 ... 1 6 Figure 5: Cost comparison between Li-ion battery and flow batteries. At long discharge hours, the cost ( $/kWh) reduces to cost of the active materials."... . .. . . .. . . 16 Figure 6: Schematic of suspension electrode used in semi-solid flow battery...18 Figure 7: (left) 3D synchrotron X-ray tomography images of activated carbon (YP-50, particle size 1-10 micron) suspended in Na2SO4. (right) Above percolation threshold 10 w%, an "infinitely" large cluster is form ed. ... 2 1 Figure 8: Relationship between yield stress of the KB in 2.5 M Li-PS in triglyme suspension with its co n d u ctiv ity 34 ... 2 4 Figure 9: Jam m ing transition of soft particles37 ... . . . .. .. . . 24 Figure 10: Flow curves for yield stress fluid (left) and Newtonian fluid (right).36 ... . . . . 26 Figure 11: Flow profile for Newtonian fluid and Bingham fluid. At regions where the stress experienced is below the yield stress, the fluid will be unyielded (solid-like)40
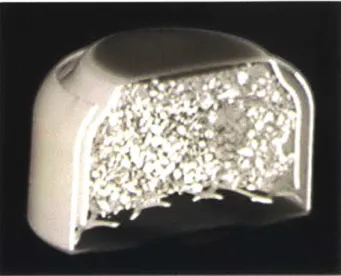
... . . . .. . . . 26 Figure 12: 3D X-ray tomography of Zn suspension in Zn-air button cell.4 7
Figure 13: Bode diagram explains structural changes to Ni compound during charge and d isch arge4849.... . ... ... ...
2 9 Figure 14: Relationship chart between suspension components, suspension properties, suspension performance and system performance. This relationship is just summary based on literature review done in sections 1.2 and 1.3. Obvious relationship such as choice of active material affecting the suspension and system performance is not shown here...33 Figure 15: Static closed cell used to determine intrinsic electrochemical performance of the su sp e n sio n s ... 3 7 Figure 16: Photographs of stable and unstable catholyte suspension. Suspensions are stabilized by adding Carbopol , which creates stress-bearing microgel structures in the electrolyte. Composition of suspension on the right is (in w/wwater%) carbon black : Ni(OH)2 : Carbopolc =
14 .0 : 3 9 .8 : 1.4 )...3 9 Figure 17: SEM images of particles required to make composition of catholyte and anolyte used in th is stu d y ... 4 0 Figure 18: a) Schematic of fluid and solid region around sphere suspended in continuous medium filled with stress-bearing network (yield stress fluid) (figure from 63); b) Schematic of stress-bearing network made up of percolated carbon black colloids (left) and jammed Carbopol microgels (right). Carbon black colloid exists as fractal like network in suspension 27 and Carbopol
Figure 20 3-D tomography of anolyte (composition in W/Wwater% Zn : ZnO : Carbopolc = 71.1 : 42.1 : 1.8) and catholyte (composition in W/Wwater% carbon black : Ni(OH)2 : Carbopolc = 14.0:
39.8: 1.4) measured using X-ray CT-scan. Samples were measured over a month after preparation ... 4 5 Figure 21: (left) Linear viscoelastic (LVE) region is determined from storage modulus vs strain measured under 1 Hz oscillation at gaps between 1300 to 1400 micron. (right) Elastic modulus in LVE region for carbon black suspension with different concentration of carbon black in 1.4
w /w water% Carbopol + 7 M K O H ... 46
Figure 22: Conductivity of suspensions with different amount of conductive additive a) carbon for catholyte (in mS/cm) and b) Zn for anolyte (in S/cm). Conductivity percolation threshold is about
6 w/wwater% carbon and 49.8 w/wwater% Zn respectively. Conductivity was calculated from linear
scan voltammetry technique. The scan rate is 0.1 mV/s. The voltage range is 0 to 30 mV for carbon suspension and 0 to 10 m V for Zn suspension. ... 48 Figure 23: Galvanostatic (2.0 mA/cm2
) charge-discharge curves for catholyte with different carbon concentrations (composition in w/wwater% carbon black : Ni(OH)2 : Carbopol = 6 to 14: 3 : 1.4) in static closed cell. Anolyte composition (in w/wwater% Zn : ZnO : Carbopol = 71.1 : 21.4 or 31.3 : 1.8) was fixed at Zn concentration above percolation threshold to minimize ohmic polarization. All samples were charged to 80% SOC of Ni(OH)2 and discharged to cut-off potential of 0.8 V. X-axis refers to capacity normalized to charge capacity. (Data for 10, 12, 14 w/wwater% carbon black courtesy of Yunguang Zhu) ... 49 Figure 24: Faradaic efficiency for catholytes from Figure 23 in static closed cell. Two different discharge plateaus refers to two different discharge regimes: 1) till 1.1 V and 2) between 1.1 to 0.8 V76. Y-axis refers to capacity normalized to charge capacity (Couloumbic efficiency). ... 50
Figure 25: Proposed mechanism on how poor connectivity between Ni(OH)2 and current collector can cause occurrence of second plateau in Ni(OH)2 electrode by Delmas et al. 76...52
Figure 26: Galvanostatic charge-discharge curves at various current densities in static closed cell. Catholyte composition (in W/Wwater% carbon black : Ni(OH)2 : Carbopol = 14 : 39.8 : 1.4).
Anolyte composition (in W/Wwater% Zn : ZnO : Carbopol = 71.1 : 31.3 : 1.8). All samples were
charged to 40% SOC of Ni(OH)2 and discharged to cut-off potential of 0.8 V. Energy density was obtained by integrating voltage profile with respect to capacity and dividing with volume of catholyte used (0.22 cm3). (Courtesy of Yunguang Zhu) ...
53 Figure 27: Modified Ragone plot to compare performance of other static semi-solid battery and VRFB reported in literature on modified Ragone plot. Higher power density on Y-axis minimizes stack cost, and higher energy density on X-axis minimizes battery suspension tank size. Catholyte composition (in w/wwater% carbon black : Ni(OH)2 : Carbopol = 14 : 39.8 : 1.4). Anolyte composition (in w/wwater% Zn : ZnO : Carbopol = 71.1 : 31.3: 1.8). Only systems with flowable electrode for anolyte and catholyte is compared. ... 54 Figure 28: Flow curve of catholyte (in w/wwater% carbon black : Ni(OH)2 : Carbopolc= 14: 39.8: 1.4). Parameters fitted using Bingham model for high shear rate > 45 s1
is given by yIp = 0.2 Pa. s, Ty = 204 Pa at R2
= 0.97. Parameters for same catholyte without addition of any Ni(OH)2 (in
w/wwater% carbon black : CarbopolC = 14 : 1.4) is given by yip = 0.2 Pa. s, ry = 210 Pa at R2
=
Figure 30: (top) Estimated efficiency loss due to pumping; (bottom) Length per channel needed to pump catholyte (in W/Wwater% carbon black: Ni(OH)2 : CarbopolC = 14 : 39.8 : 1.4).The contour represents order of magnitude of efficiency lost due to pumping and length per channel (in m) respectively. The stack dimensions were assumed to have 1 kW output. Energy density of the catholyte (85 Wh/Latholyte) and power density (30 mW/cm2) were taken from Figure 27. ... 60
Figure 31: Bingham number (Bn) of flows calculated in Figure 30. The contour represents order of m agn itude of B n ... 62 Figure 32: Flow profile for catholyte (composition in w/wwater% carbon black: Carbopol = 14: 1.4) at a) 0.5 mL/min (Bn ~ 2700), b) 4.0 mL/min (Bn ~ 600) and c) water at 4.0 mL/min (Bn =
0). Thickness of the channel is 1.5 mm. Flow profile for water is highlighted with red line. Uniform flow profile is observed for the catholyte with yield stress and parabolic flow profile observed for w a te r ... 6 3 Figure 33: Flow cell design 1 with conductive frame and narrow channel and its electrochemical performance. Both anolyte and catholyte channels were 3 mm wide, 1.5 mm thick and 3 cm long. Impervious graphite (Fuel Cell Store, USA) was used as current collector on both sides. Catholyte composition (in w/wwater% carbon black : Ni(OH)2 : Carbopolc = 14 : 39.8 : 1.4). Anolyte composition (in w/wwater% Zn : ZnO : Carbopol = 71.1 : 31.3 : 1.8). Charge-discharge was perform ed at 2 m A /cm 2 ... 65
Figure 34: Flow cell design 2 with non-conductive frame and wide channel and its electrochemical performance. Both anolyte and catholyte channels were 9 mm wide and 4 cm long. Anolyte and catholyte channels had 3.0 and 1.5 mm thickness respectively. Impervious graphite (Fuel Cell Store, USA) was used as current collector for catholyte and brass plate (McMaster Carr, USA) was used as current collector for anolyte. The current collectors were inserted in between the gasket
and frame. Catholyte composition (in w/wwater% carbon black: Ni(OH)2 : Carbopolc = 14: 39.8: 1.4). Anolyte composition (in w/Wwater% Zn : ZnO : Carbopol = 71.1 : 31.3 : 1.8). Charge-discharge w as perform ed at 2 m A/cm 2 ... . . . . .. .. . . .. . . .
1. Introduction
1.1 Electrochemical energy storage systems for the grid
In the recent years, penetration of renewable energy sources in global market has been constantly increasing.
Figure 1 shows growth in renewable energy capacity addition for various technologies in the global market. Between the years 2017-2022, it is expected that capacity additions from energy sources such as wind and sunlight to occupy 82% of the new market. Renewable energy sources are attractive not only for its ability to reduce greenhouse gas emissions, but also to reduce dependency of remote areas on fossil fuels and promote their growth through microgrids. One important aspect of electricity generation from renewable energy sources such as wind and sunlight is that, it requires energy storage systems due to its intermittent nature.
Selection of energy storage systems typically depend on their required storage time, required storage power2
. Figure 2 shows conceptual positioning of various energy storage technologies according to their storage power and storage time. Technologies such as pumped hydro and compressed air energy storage system are more suited for high power (- GW scale) and long storage time applications, due to their geographically restrictions. Both technologies require large reservoir to store pumped water and compressed air respectively. On the other hand, electrochemical energy-based energy storage systems are more compact and suited smaller power and shorter discharge time applications.
There are three types of electrochemical energy storage systems: battery, fuel cells and supercapacitors3. In this chapter, only battery will be focused as it is more relevant to the scope of
study of this thesis. A battery converts electrical energy to/from chemical energy through redox reactions. During discharge the negative electrode undergoes oxidation, the positive electrode
undergoes reduction, and vice-versa during charge. And these two electrodes are separated by a
separator which allows transport of ion from one electrode to the other to maintain electroneutrality,
while preventing self-discharge or short-circuiting between the two electrodes. Energy storage
capabilities of a particular electrochemical couple is determined by difference in Gibbs free energy
of the electrochemical reaction AG as following equation.
AG = -nFE (1)
where n the number of electrons transferred per mole of reactants, F is the Faraday's constant
equivalent to charge per mole of electron, and E is the electromotive force that drives the electric
current
4.
1200 90% 900 60% 30% 3000
0%Figure 1: (left axis) Growth in renewable energy capacity addition for various renewable energy technology in global market. (right axis) Percentage of energy capacity addition from wind and
solar PV.5
UPS Power Quality
T&D
Grid Support Load Shifting
I
Bulk Power Mgt
Flow
Sattries
ALead-Add 90ya LiIon
BattLead-Acd Batte
MiCA-I-SMES
1kW
10kW
100kW
1 MW
10MW
System Power Ratings, Module Size
100MW
1GW
Figure 2: Conceptual positioning of various grid scale energy storage technologies with respect to their storage power and storage time2
Of all battery chemistries out in the market, probably, Li-ion battery is the most popular and most commonly used type, due to its high energy density and high specific energy (large difference in AG per volume and mass of the reactants respectively). Conventional architecture of Li-ion battery is shown in Figure 3. In this architecture all the active materials are enclosed in a case. Although this is simple and compact, they have poor scalability. Poor scalability of this
i
I
NaS Battery
I
CAES
WW~Ic Battery
architecture is due the fixed ratio of mass of inactive components of the battery (case, separator,
current collector etc.) to mass of active components. For example, in a typical Li-ion battery system,
the inactive components compose ~ 30 to 50 % of the total mass of the battery
6. Hence, if one is
to double the energy or power output of the battery, the cost of these inactive materials will double
too.
a Cyndrcal b Prkmadc c Pouch
Extenr
Separators oE
Anode Thicknes
Pouch - 01
Sop stockso
rotor
~
anode--pafatoi (athodeCAode
Nature Review I Materists
Figure 3: Conventional Li-ion battery architectures
7On the other hand, if the battery architecture is open and the active material is transported
into the stack to be charged or discharged, as shown in Figure 4, the ratio of mass of inactive
components of the battery (case, separator, current collector etc.) to mass of active components
can be decoupled. This type of battery is called flow battery, derived from the fact that the active
material is flowed into the stack. Hence, the battery's energy output, power output and cost can be
scaled independently
89. Energy output of the battery is dependent on the size of the tank and power
output is dependent on the area of the flow stack. And, cost of the battery per kWh decreases with
increasing time of battery discharge or energy output of the battery. This is because cost of inactive
22-I -30 INTERMITTEXT 3 ELECTRICAL SOURCE 31 CIRCUIT 26 LOAD ANODECAT FLUID I FLUID 1+ 23
1-2
526 11 , 16Figure 4: Architecture of flow battery, with two (left) or four (right) tanks as described by Thaller
1975.10 104 6. U0 0 103 102 10 1 I 10 102 103 104
Duration E/P (hours)
Figure
5:
Cost comparison between Li-ion battery and flow batteries. At long discharge hours, the
cost
(
$/kWh) reduces to cost of the active materials."
. A A Existing HS I V New Greenfield PHS I Undergrobnd CAES I
chemical cost (Li) Na
chemical cost (Nai*)
.3 .~ .1 ~. .1
(30 N TNT
$WW IG 33 5 291 CIRCUIT
MODE! LOAD CAT
FLI LI
swu P 1 7 S
IsC 23
First practical all-liquid flow battery was introduced by researchers at NASA in 1970's using Fe(II)/Fe(III) and Cr(II)/Cr(III) chemistry10
. However, the kinetics of positive electrode reaction is sluggish, and required introduction of catalysts such as bismuth8. In 1986, Skyllas-Kazacos reported first vanadium redox flow battery (VRFB)"2
. The anodic half reaction is V2+
v V3+ + e (2)
with a potential of -0.255 vs SHE13
. And the cathodic half reaction is
VO2
+ +H20 7 VO+ + 2 H+ + e- (3)
with a potential of -1.004 vs SHE13
. The battery uses concentrated H2SO4 as electrolyte to increase
the conductivity. One of the two most common problems still faced by VRFB is low solubility of the vanadium species in the sulfuric acid electrolyte and its requirement for narrow range of temperature to prevent precipitation8"14. The state-of-the-art electrolyte uses mixed H2SO4 and HCl electrolyte, which increases solubility of V(V) species up-to 2.5 M and widens the operational range to -5 to + 50 C.1 3 Even with mixed H
2SO4 and HCl electrolyte, the energy density of flowable
catholyte is only ~40 Wh/Latholyte. 13,15
Low energy density leads to increased capital cost for storage and also narrowed application space, as it won't be able to overcome energy density of conventional Li-ion battery (> 250 Wh/Lboth electrodes).8
Another problem with all liquid flow battery such as VRFB is the cross-over of the soluble species. Strategies like, using ion-exchange membrane and periodic electrolyte reconstitution are used to overcome this issue. However, this leads to other practical problems such as increased cost
1.2 Suspension electrode for semi-solid flow battery
One method to overcome low energy density and species cross-over problem in conventional flow battery vanadium is to utilize flowable solid electrodes. This type of battery is known as semi-solid flow battery, proposed by Chiang and co-workers in 2011 ". As shown in Figure 6, suspension electrode in semi-solid flow battery is consists of conductive additive (typically carbon black), electrolyte, and solid active material. Now, the active material is not limited by the solubility of the active material in the electrolyte as all-liquid flow battery, but limited by packing of solid in the electrolyte. For a spherical particle, maximum packing density is about 60 - 70 vol%. Even if only 40 vol% is filled with active material particles, the molarity could reach upto -17.7 M for a suspension with Ni(OH)2 particles. This is -7.2 times larger than molarity of VRFB catholyte. But, obviously, as more particles are added to the suspension, the resistance to flow increases too. This will be discussed in more detailed in the next chapter. Another advantage of using flowable suspension electrode is that, it eliminates cross-over of active species problem. Hence, this eliminates the need for expansive ion-exchange membrane. It is worth to note that prior to work by Duduta et al. suspension electrodes have already been used in commercial alkaline batteries such as Zn-MnO2 and Zn-air batteries1 8.
Electrolyte
Carbon black
Active material
Several batteries battery chemistries have been tested for semi-solid flow batteries. A summary of some milestones in using new chemistries for semi-solid flow batteries is shown in Table 1. Almost all of them have been largely limited to Li-ion or Li-S based chemistries and organic electrolytes. It is worth to note this summary omits reports on semi-solid electrochemical flow capacitors. Readers are suggested to refer to following reference for further studies on different types of semi-solid electrochemical energy storage systems1 9
.
Complex composition of suspension electrode makes it hard to distinguish how each component of the suspension affects the overall property. As mentioned previously, there are three main components in this flowable suspension, namely electrolyte, conductive additive, and active material. The role of electrolyte is to serve as ion conducting agent for the redox reaction and also to induce surface charge on the surface of carbon black particles. Presence of surface charge on carbon black particles will help to strengthen the attractive interactions among them to form a percolating conducting network2O. When carbon black is dispersed in organic solvent with high dielectric constant such as mixture of ethylene carbonate and propylene carbonate (1:1), the KB was found to show negative surface charge. As salts LiTFSI or LiPF6 is added (3 to 30 mM), the double layer is neutralized and zeta potential of the KB particles approached zero. This leads to flocculation and hence unstable suspension. When more salt is added the adsorption of Li' ion on the surface of carbon black inverts the surface potential to a positive value21
. However, dispersing KB in aqueous electrolyte can be less straightforward due to hydrophobicity of carbon black
able to create stable suspensions using KB. However, in the same study by Parant et al. different type of carbon black such as acetylene black (AB) was unable to disperse at any given pH2 7. This shows the importance of understanding the compatibility of carbon black and the electrolyte to ensure stable dispersion of solid particles in the suspension.28
Concentration of carbon black can also affect the properties of the suspension. When carbon black particles are able to achieve stable dispersion in the electrolyte, it will form multiple clusters. This network acts as a flexible wire between the active material and the current collector29. According to percolation theory, as the concentration of carbon black is increased, the size of the cluster gets larger. When one particular cluster gets infinitely large, the suspension is said to have reached percolation threshold.30
Figure 7 shows the images of "infinitely" large cluster above the percolation threshold 10 w% 31. This 3-D percolating network then gives rise to bulk properties such as conductivity and elastic modulus.3 2
,3 3 For KB suspensions in 2.5 M Li-PS in triglyme, percolation threshold is reached at concentrations < 0.5 v% when investigated using conductivity31. This is surprising because percolation threshold for micrometer carbon black particles in organic solvent investigated using elastic modulus is about 5 v%.3 5 Similar trend was observed by Richards et al. KB and
Vulcan carbon black in propylene carbonate solvent.33 It has been suggested this observation could be due to difference in nature of mechanical percolation and electrical percolation, where possibly there could be hopping of electrons from one cluster to the other without intimate mechanical contact.3 3 Electrical percolation is favorable for suspension electrodes, as continuous carbon network is needed to transport electron to and from the active material at any given instant. However, mechanical percolation may not. This will be discussed in detail, in the next chapter.
5 wt%/7 v01% 4 () (f)
A 'g
a
~10
0 *M 36 v%I0,
20 0 1 104 1l ' $ 101 1t 10CasUMW Vowme OMI)
(g)
Figure 7: (left) 3D synchrotron X-ray tomography images of activated carbon (YP-50, particle size 1-10 micron) suspended in Na2SO4. (right) Above percolation threshold 10 w%, an "infinitely" large cluster is formed.3'
Table 1: Summary of some milestones in chemistries used for semi-solid flow batteries
Negative Conductive Positive Conductive Electrolyte Notes Reference
electrode additive electrode additive
Li4Ti5O5 KB LiCoO2 KB 1.3 M LiPF6 in First suspension Duduta et al.
proprietary alkyl electrode for battery (2011) Adv.
carbonate concept since Zn Energy Mater.
suspension for alkaline battery (refer 1.4)
Li2Ti2(PO4)3 KB LiFePO4 KB 1 M LiNO3 Used aqueous Li et al. (2013)
electrolyte Phys. Chem.
Chem. Phys.
Li foil - Si KB 1 M LiPF6 in Possibility of using Hamelet (2013) J.
EC:DMC (1:1) electrode with high Electrochem. Soc volume change
Li foil - S KB 0.5 M LiTFSI in Introduced soluble Fan et al. (2014)
TEGDME species for SSFB Nano letters
Li foil - S KB 0.2 M LiClO4 + 0.1 KB impregnated Chen et al. (2015)
LiNO3 in DOL: with sulfur produces Nat. Comms.
DME (1:1) suspension with
lower viscosity
ZnO KB Ni(OH)2 KB + Ni 6 M KOH Alkaline electrolyte Liu & Wang
powder (2015) J. Power
Sources
Li foil - LiI + S KB 0.2 M LiClO4 + 0.1 Soluble LiI gives Chen et al. (2016) LiNO3 in DOL: additional capacity Adv. Energy
DME (1:1) Mater.
Li foil - S KB 0.5w% LiNO3 + GIF cell was Chen & Hopkins
0.5 M LiTFSI in introduced et al. (2016)
triglyme Energy &
Environ. Sci. KB: Ketjen black
1.3 Yield stressfluids
In the previous sub-chapter, effect of carbon black concentration on mechanical and electrical percolation has discussed. While electrical percolation is favorable for suspension electrode, mechanical percolation may not. Presence of mechanical percolation indicates presence of stress bearing network within the suspension. Such fluids are known as viscoplastic fluids or yield stress fluids.
Yield stress fluids are commonly available around us. Toothpaste, peanut butter, ketchup, lotion and mud are examples of yield stress fluids we see every day. Yield stress stays are solid below at rest and starts flowing above a critical stress. Interactions between microstructures in the fluid gives rise to this behavior. Typically, three main types of microstructure are said to give rise to yield stress behavior: 1) attractive colloids, 2) jammed soft particles, 3) soft glassy hard spheres36. Only the first two behavior will be explained here as they are more relevant to the context of this thesis. Microstructure of carbon black particles in the suspension refers to the first type. Attractive forces between carbon black clusters that can be confirmed from zeta potential measurements, helps to create stress bearing percolating network as mentioned in the previous paragraph and as shown in Figure 7. If the percolated network is dense enough (i.e. above percolation threshold), it can give rise to macroscopic elasticity to the system, hence yield stress36. Figure 8 shows relationship between yield stress and conductivity of KB in 2.5 M Li-PS in triglyme suspension determined from experiments.
(d)
101 (L ID 10 100 2x100 5x100 101Electronic conductivity (mS/cm)
Figure 8: Relationship between yield stress of the KB in 2.5 M Li-PS in triglyme suspension with its conductivity34
)O+,q
0C
*
_il
Figure 9: Jamming transition of soft particles3 7
On the other hand, yield stress can also be developed using compressing soft particles against each other as shown in Figure 9. Critical concentration at which this transition occurs is known as jamming transition36. Yield stress developed from emulsions and dispersion of microgels (such as CarbopolC and PNIPAM) are due to jamming transition38. As will be shown further in detail in
1.00% KB 0.75% KB A
0.50% KB
2.5M Li-PS in trigyme/ H=1.6 mm/nQ slip
the discussion chapter, both type of microstructure can detrimental and at the same time useful to design suspension electrodes.
Flow behavior of a suspension is usually represented in the form of flow curve. Shear rate j [s'] refers to rate of shear deformation experienced by a fluid element. A flow curve shows
amount of stress T needed to shear a fluid element at a given shear rate. Figure 10 shows flow curve for Newtonian fluid and yield stress fluid For a Newtonian fluid, the shear stress T [Pa] is directly proportional to the shear rate ?. This relationship is given by the following equation,
T = y (4)
where i [Pa.s] is the dynamic viscosity. However, for yield stress fluid, one has to consider presence of a critical stress at which the fluid starts flowing. Simplest model to describe flow of yield stress fluid is Bingham model. Bingham model is described as
k= 0 Ifr <rY (5)
C=Ty+ Ip If->ry
where Ty is the yield stress and pp is plastic viscosity. In practical fluids, although simple Bingham model does not provide prefect fit with the data, but it is powerful enough to be able to estimate values for engineering applications analytically. For example, pressure drop calculation, determining yield stress, or even crude flow profiles as shown in Figure I1.3
50
40 F
20-
101-'
0
400800
shear rate
(sI)
50 40 30
j20
1
00
BF-(-7
Ix-+ W. Cream[/1
2
4
6
8
10
shear rate (s')
Figure 10: Flow curves for yield stress fluid (left) and Newtonian fluid (right).36
Newtonian
Sol
naI
Bngham
Plastic
Shear Stress
Distribution
jvz
I rzso
Or 4MA M *~ U ~ Ills -Itin-I
Figure 11: Flow profile for Newtonian fluid and Bingham fluid. At regions where the stress experienced is below the yield stress, the fluid will be unyielded (solid-like)40
dOt A x x
Bingham model
xwhipped cream
4%0
,
,
,
,
,
,
I3 . I1.4 Ni-Zn alkaline battery
In this section, a short review will be given on electrodes relevant to this study. Alkaline batteries are one of the earliest commercial batteries. Several battery chemistries have used alkaline electrolyte. For example, Ni-Cd, Ni-Zn, Ni-metal hydride (MIH), Ni-Fe, Zn-MnO2 and Zn-air41
. Excluding its corrosiveness, alkaline electrolyte is inherently more environmentally-friendly because they not flammable and non-volatile compared to organic electrolyte used Li-ion battery. Also, these active materials are also more cheaply and abundantly available compared to cobalt which is commonly used in Li-ion battery42. It is also worth to note that early EV used alkaline battery such as Ni-MH before Li-ion batteries.
Suspension electrode is common in alkaline battery such Zn-MnO2 and Zn-air. Figure 12 shows Zn electrode is suspended in gelled electrolyte. It was first introduced by Lewis Urry in
1950s". Redox reaction for Zn electrode is shown in the following equations.
ZnO + H20 + 20H - Zn(OH)- (6)
Zn(OH)2~ + 2e- Zn +
40H-with reduction potential at -1.2 vs SHE. Zn is oxidized (or ZnO is reduced) through intermediate product zincate ion Zn(OH)42-. This type of redox reaction is called dissolution and precipitation
43
reaction
Although zinc has high specific capacity among metal electrodes as it gives out 2 electrons and has low discharge voltage, there are several issues in using Zn as rechargeable electrode. One
This could cause 1) anodic dissolution of Zn to form Zn(OH)'- with simultaneous hydrogen evolution and 2) cathodic hydrogen evolution during Zn reduction. These could reduce coulombic efficiency of the battery. One method to prevent hydrogen evolution is to alloy Zn with metals with lower hydrogen evolution overpotential such as Hg, Pb or In44. Another problem with rechargeability of Zn is the shape change of the electrode due to migration of soluble Zn(OH)'-species4 4. This can be prevented by using additives that can decrease Zn(OH)'- solubility in KOH such as Ca(OH)245
, KF or K2CO3
46
Figure 12: 3D X-ray tomography of Zn suspension in Zn-air button cell.4 7
P-Ni(OH)z Red. Ox. p-NiOOH; --NI00H 100 MV politivow Umwondlung in KOM Dehydration Overcharge a-3NI(OH).2H20 Ox, Red. -NMOOH y-NIOOH 60 my 11000t+1"r I WJ Nj * - OM N~ -*OH Na -00(H)0)X N~ 0
Figure 13: Bode diagram explains structural discharge4849
changes to Ni compound during charge and
On the other hand, Ni(OH)2 undergoes proton intercalation and deintercalation during redox reactions. Redox reaction of Ni(OH)2 was found to be complex due to presence of multiple structures and oxidation states of nickel48 50. Bode diagram (Figure 13) explains structural changes of nickel compounds during charge and discharge. When
p-Ni(OH)2
is charged (oxidized) proton deintercalation happens to formP-NiOOH
as shown in the following equation.fl - Ni(OH)2 - f - NiOOH + H' + e- (8)
Although layered structure is still maintained (Figure 13), DFT calculations suggests this is a 2-phase reaction, as it involves restructuring of oxygen layer during proton intercalation49. When
P-NiOOH is overcharged (oxidized further), large energy barrier to remove proton the layered
Ni(OH)2 is assumed to form y-NiOOH 2. This has also been observed experimentally, where
in-situ EQCM of a-Ni(OH)2 during oxidation causes increase in mass which is probably due to incorporation of potassium ions from the electrolyte 3
. When dehydrated under high temperature and concentrated alkaline electrolyte, cx-Ni(OH)2 often ages to form
p-Ni(OH)2
50,54
. Reversible redox reactions of ac/y and
P/P
structures are suggested to occur at 0.39 - 0.44 V and 0.44 - 0.47 V vs Hg/HgO respectively50.Although there are experimental proofs (as written in previous paragraph) for reversible structural changes of u/y and
p/P
structures as suggested by Bode (1966), there have also been several other observations. For example, presence of two plateaus during reduction of Ni compounds at potentials about +0.3 V and 0 to -0.4 V vs Hg/HgO 50.51,5456. The origin of reaction at lower potential or more commonly known as second discharge plateau is intriguing because they are not at potentials of reversible /y andP/p
redox reactions5 0,53,
57. Initially there have been
suggestions that the presence of second discharge plateau could be due to presence of less active compounds such as Ni302(OH)4 or Ni304.xH2, although none of those compounds been observed during electrochemical reduction 1. Currently, the general consensus is that second plateau could originate from presence of poorly conducting phase within the active material 154-56. This is possible because Ni(OH)2 is an poor electrical conductor' 5 .5456. Hence, it was postulated that during discharge, as Ni(OH)2 starts forming till it covers the current collector. Poor conductivity of Ni(OH)2 causes ohmic drop, hence lower discharge plateau54,55,58. This could also be related to positive correlation observed between relative amount of y-NiOOH in the sample and relative capacity from the second discharge plateau5 6 because of overcharge during oxidation of Ni(OH)2 only near the current collector. Some studies have suggested coating the Ni(OH)2 particle with CoO could prevent the observation of second discharge plateau due its high electrical
conductivity55. Nevertheless, these observations point the importance of understanding the coverage of Ni(OH)2 with conductive particle.
Generally, Ni(OH)2 has good rechargeability. However, high oxidation potential of Ni(OH)2 ~0.47 V vs Hg/HgO is higher than the thermodynamic potential for oxygen evolution. Oxygen evolution reaction as shown in the following equation occurs at ~ 0.3 V vs Hg/HgO at pH 14.
02 + H20 + 4e -* 40H- (9)
1.5 Scope of study
1.5.1 Objective of this study
This study aims to find an appropriate framework to design high performing suspension for semi-solid flow battery. High performing suspension is defined as suspension with high energy density to minimize volume of the tank, suspension with high power density to minimize area of stack, suspension with high stability to prevent sedimentation and suspension with good flowability to minimize energy loss due to pumping. Tools to test the properties of the suspension relevant to above performance parameters will be developed or adapted to meet the requirements of concentrated alkaline electrolyte. A flow cell will then be designed and fabricated to test the performance of the suspension in an open cell system as a first step to device SSFB.
1.5.2 Choice of battery chemistry
Most studies till now have focused on Li-ion or Li-S battery chemistries (Table 1). Considering alkaline electrolyte is more environmentally-friendly, Zn-Ni battery chemistry is chosen. Zn-Ni battery has one the highest potential for aqueous battery. For suspension with 40 vol% Ni(OH)2 active material particles, the molarity could reach up to -17.7 M. This is about 7 times larger than maximum solubility of VOSO4 in water.
Although there has been prior report by Liu and Wang (2015) on Zn-Ni SSFB, they have reported several problems such phase separation of the suspension, which then affected electrochemical performance of the battery59. Hence, this highlights the importance of fundamental understanding of how to design a high performing SSFB suspension.
1.5.3 Stability, conductivity and flowability
Sections 1.2 and 1.3 show the complexity in designing suspension electrode for semi-solid
flow battery. Suspension composition affects suspension properties, suspension properties affect
suspension and system performances (Figure 14). Here, suspension performance is defined as
performance that can be evaluated without knowledge of the opposite suspension electrode (i.e.
with reference electrode). This shows that knowledge required to design a suspension with high
performing suspension (i.e. high energy density and power density capabilities, minimum energy
loss due to pumping, while maintaining stability over long period of time) are interdisciplinary.
Systematic approach has to be taken to design these suspensions can serve as a model framework
to design high-performing suspension for any battery chemistries.
Suspension Suspension Suspension System
composition properties performance performance
Electrolyte Stabilit
Electronic resistance Power density
Conductive Conductivity &
additive Percolation
<~Discharge capacity Energy density
Active material y --- NI Flow profile Energy efficiency
Figure 14: Relationship chart between suspension components, suspension properties, suspension
Only three main suspension properties will be focused in this study: stability, conductivity and flowability. Firstly, high stability of the suspension can extend cycle life of the suspension. Secondly, suffice conductivity and good electrical percolation can ensure minimum internal resistance of the battery and also improve the discharge capacity of the battery. Thirdly, finding the flowability of the suspension (i.e. yield stress) can help to estimate energy loss due to pumping
2. Experimental procedures
2.1 MaterialsPotassium hydroxide (KOH, 99%, VRM) was used for electrolyte preparation. Carbopol (CarbopolC 940 NF polymer, Lubrizol, USA) was used as gelling agent. Zinc oxide (ZnO, 99%, Sigma-Aldrich) and alloyed zinc powder (EverZinc, Belgium) were used for anolyte preparation, where Zn served as conductive additive. Nickel hydroxide (Ni(OH)2, 98%, Pred Materials, USA and Kansai Catalyst Co. Ltd., Japan) and carbon black (acetylene black, Chevron, USA) were used for catholyte preparation, where carbon black served as condutive additive. Cobalt oxide (CoO, 99.995%, Fisher Scientific) was as conductive additive to further enhance conductivity of Ni(OH)2 as suggested by Leger et al (1999).15
2.2 Preparation of suspensions 2.2.1 Catholyte preparations
30 w% KOH solution (7 M KOH solution) was prepared by dissolving 5.36 g of KOH pellets in 12.5 ml deionized water. Then, 0.18 g of CarbopolC was added to above solution and mixed with planetary mixer. The electrolyte gel was kept at rest for 12 hours to allow swelling of CarbopolC microgels. The electrolyte gel was then remixed before adding carbon black at amounts as described in the text, and mixed again after. For preparation of active suspension, Ni(OH)2 +
2.2.2 Anolyte preparations
30 w% KOH solution (7 M KOH solution) was prepared by dissolving 5.36 g of KOH pellets in 12.5 ml deionized water. Then, 0.57 g of ZnO was added to above solution and stirred using magnetic stirrer for 5 hours to saturate the solution with zincate ions. After that, 0.18 g of CarbopolC was added to above solution and mixed with planetary mixer. The electrolyte gel was kept at rest for 12 hours to allow swelling of Carbopol microgels. The electrolyte gel was then remixed before adding ZnO at amounts as described in the text, and mixed again after. Finally, Zn was added to the suspension and mixed at 2000 rpm for 6 minutes. All other mixing was performed at 2000 rpm and 12 minutes unless stated otherwise. Composition of the suspension in the text is described in w% with respect to water. For example, composition in w/wwater% Zn : ZnO : CarbopolC = 71.1 : 42.1 : 1.8, would mean 9.12 g of ZnO, 30.8 g of Zn and 0.23 g of CarbopolC.
2.3 Electrochemical measurements 2.3.1 Conductivity measurements
Conductivity of the suspensions were measured using in-house conductivity cells. The suspensions were filled in rubber gasket separated by two blocking electrodes. For catholyte, impervious graphite plates (Fuel Cell Store, USA) were used as electrode. For anolyte, brass plates (McMaster, USA) were used as electrode. The geometrical area was 0.79 cm2
and thickness of the gasket was 0.17 cm for both cells. Resistance of the suspension was determined by sweeping potential across the electrode as described in the text. Conductivity was calculated based on following equation.
1(t (10)
where t is the thickness of the gasket and A is the geometrical area of the cell.
2.3.2 Electrochemical performance of suspension in static closed cell
To determine intrinsic electrochemical performance of the suspension, the active suspensions were charged and discharged in a closed cell and static mode. This is important because it has been shown that, in an open cell, electroactive zone extension can occur due to conductive nature of the suspension60. Design of the suspension cell is shown in Figure 15. Depth of the graphite well for catholyte and thickness rubber gasket for anolyte was 2 mm and 1.7 mm. Effective geometrical area the suspensions were 1.11 cm2. Charge-discharge were performed as described in the text.
The discharge capacity will gradual increase with cycle as result of transition from W/y and
P/P
redox reactions in positive electrode.5 3 Hence, only the cycle with highest capacity is reported here (~3rd cycle).e
-~ Endplate + Brass spring * Brass electrode Rubber spacer - --* Celgard 3501 Teflon SpacerQ-
2.4 Rheological measurements
Rheological measurements of the suspensions were performed on AR-G2 rheometer (TA Instruments) using 40 mm plate-plate geometry. To prevent wall slip36 and avoid contact of the suspension with the stainless steel rheometer plates, the plates were covered with adhesive-back lapping film with 30 tm diamond abrasive (3M Corp.) for catholyte suspension and adhesive-back sandpaper with 100 ptm silicon carbide abrasive (McMaster-Carr, USA) for anolyte suspension. The abrasive particle sizes were chosen to match the average size of Ni(OH)2 and Zn particles respectively. 1200 Jim gap was used for all measurements unless stated otherwise. Decreasing step shear rate controlled viscometry was performed to measure the flow curve. Each shear rate was held constant for 30 s before measuring the stress. Same procedure was repeated three times with fresh samples to obtain average stress at a given shear rate.
3. Results and discussion
3.1 Developing yield stress in continuous medium to design stable suspension
Figure 16 shows pictures of stable and unstable suspensions in 7 M KOH electrolyte with and without addition of polymer-based microgel (Carbopol ) respectively. Unlike carbon and active material suspensions in organic electrolytes used in the literature, these particles do not readily suspend in the electrolyte14,29
. Difference in stabilization mechanism is described as follows.
IL
Carbon black particles 7 M KOH -Ni(OH)2 particlesSuspension without Suspension with
CarbopolC CarbopolC
Figure 16: Photographs of stable and unstable catholyte suspension. Suspensions are stabilized by adding CarbopolC, which creates stress-bearing microgel structures in the electrolyte. Composition of suspension on the right is (in w/wwater%) carbon black : Ni(OH)
continuous phase (electrolyte) 61. When Brownian force is dominant, these particles are usually referred as colloids and they also experience interparticle colloidal forces such as attraction or repulsion due to their surface charge 62. Here, it is worth noting that surface charge is dependent
on the functional groups on the surface of the particle, type of solvent and salt concentration. If
FG IFB is more than unity, the particles tend to undergo sedimentation. The particle size magnitude
limit for dominant Brownian and colloidal force is about -1 Pm. Figure 17 shows SEM images of particles used to compose the catholyte and anolyte suspensions used in this study. Hence, one can expect carbon particles (-100 nm) to be dominated by Brownian and colloidal forces, and Zn (-100 pm), ZnO (-30 pm), Ni(OH)2 (-12 jim), LFP (-4 jm) 29, LCO (-3 jm) 14, LTO (-3 jm) 14 by
gravitational force.
a
Figure 17: SEM images of particles required to make composition of catholyte and anolyte used in this study
~wId
twvtasg
I.
/
V~1ud
ti.
Percolated carbon black colloids Jammed Carbopol microgels
Figure 18: a) Schematic of fluid and solid region around sphere suspended in continuous medium filled with stress-bearing network (yield stress fluid) (figure from 63); b) Schematic of stress-bearing network made up of percolated carbon black colloids (left) and jammed Carbopol microgels (right). Carbon black colloid exists as fractal like network in suspension 27 and Carbopol microgels exists as swollen sponge 64
In order to suspend these "large" particles that are dominated by gravitational force, a stress bearing continuous medium is needed 63. As discussed in the introduction, this stress bearing continuous medium, or yield stress fluid, is a fluid that starts above a critical stress and stays solid below the critical stress. The presence of critical stress is due to presence of stress bearing microstructures within the continuous medium 65. Figure 18 shows predicted shape of fluid and
solid regions when a spherical particle is placed in an ideal yield stress fluid (also known as Bingham fluid) 63. As shown in Equation 11, whether or not if the yield stress of the continuous
Here, rY is yield stress of the continuous medium, Ap is the density difference between continuous medium and the sphere, a is the diameter of the sphere. This parameter is the ratio of reaction force from yield stress of the continuous medium (mra2 ry/2) and gravitational force (ra3Apg/6). If the continuous medium is ideal Bingham fluid, as Yg - Yg,crit = 0.14, the fluid region shrinks, and Yg
-+ 0 (Stokes flow in Newtonian continuous medium), the fluid region grows infinitely 63. However,
unlike ideal Bingham fluid where the yield stress where the yield stress homogeneous throughout the continuous medium and is independent on the microstructure that causes the yield stress, in a practical scenario, the yield stress will depend on microstructure in the yield stress fluid 66. For example, Yg,crit 0.3 for neutralized Carbopol microgel and ~ 0.05 for cellulose fiber colloidal
66
As shown in Figure 18, when the "large" active material particles is dispersed in organic electrolyte, colloidal forces due to charge adsorption 21 on the surface of hydrophobic carbon black particles helps to create a percolated mechanical network within the suspension. This network develops yield stress within the continuous phase, which is enough to "trap" larger active material particle preventing sedimentation as discussed above. Hence, in this case, the carbon black particles work as both conductive additive and also as suspension stabilizing agent.
On the other hand, in 7 M KOH aqueous electrolyte used in this study, since hydrophobicity of carbon black surface prevents dispersion and formation of percolated network by the particle, stable suspension cannot be achieved. Traditionally, as demonstrated by Parant et al. (2017), early calligraphists added polysaccharide-based polymer such as gum Arabic to the aqueous solvent to functionalize carbon black surface and stabilize the ink suspension 27. However, such technique
may not work for this instance as polysaccharides undergo hydrolysis in concentrated alkaline environment67. Therefore, we introduce polymer-based microgel (Carbopol ) structure in the
electrolyte to "trap" both carbon particles and Ni(OH)2 for cathoyte, Zn and ZnO for anolyte. Similar technique has been used to stabilize Zn suspension in commercial alkaline primary battery.6 8
Microgel refers to intramolecularly cross-linked polymer swollen in the solvent. At high concentrations, microgels form a jammed, continuous and elastic network 69. This method is commonly used in complex formulations of food and pharmaceutical products. We have used commercially available poly(acrylic) acid-based Carbopolc in this study. In neutral pH, CarbopolC undergoes jamming transition at about ~ 0.1 w/wwater% 70. We have used 1.4 w/wwater% and 1.8 w/wwater% for catholyte and anolyte respectively. As shown in Figure 19, the electrolyte gel had yield stress of 0.7 Pa and 7 Pa, suffice to suspend largest particle in the composition from Equation 11. Stability of both catholyte and anolyte is evident from tomography measurements shown in Figure 20.
100 ,, ,, ,, ,, ,, ,,
-0 1.8 w/w,,,% Carbopol --. 41w/wws,,,,% Carbopol_
o."10
--.1
0.1 ""15 ' ' """aa ' ' ""'aa ' ' "apa " "" ' u 'a "" a 'ss a """ia
0.001 0.01 0A 1 10 100 1000 Shear rate, /
s-Figure 19: Flow curve of Carbopol only suspensions in 7 M KOH which are used as suspending medium for catholyte (1.4 w%/wwater% Carbopol ) and anolyte (1.8 w%/wwater% Carbopol). The yield stress is 0.7 Pa and 7 Pa respectively.
Figure 20 3-D tomography of anolyte (composition in w/Wwater% Zn : ZnO: Carbopol = 71.1 : 42.1 : 1.8) and catholyte (composition in W/Wwater% carbon black : Ni(OH)2 : CarbopolC = 14.0:
3.2 Percolation of conductive additive and its effect on electrochemical performance
Conductive additive creates space-spanning network within the suspension. This network behaves like flexible wire that bridges the current collector and the active material 71. The cluster
size of the space spanning network grows with concentration of the conductive additive and reaches an infinitely large size at the percolation threshold (Pc 24,72. Determination of percolation threshold of conductive additive is important to ensure there is continuous pathway for electron conduction. There are two commonly used methods to find percolation of conductive additive, by measuring elastic modulus Go' of the suspension or by measuring conductivity ae of the suspension 71,74. As shown in equation 12 and 13, both properties show power-law increase above
the percolation threshold. Here, v and s are rigidity percolation index and conductivity percolation index respectively 32
Go'~(# - #c)v (12)
ae-(q - Pc) (13)
1000ny
/0
[[It
1n00000tleI
#me
low=000 i~o0 AAAAAAAAAAAAAAA i 100 A0 100 0.1 110 M6 2 4 6 6 11214 16
Stem, Y /- CWbon bl" M0OSI I/WW %
Figure 21: (left) Linear viscoelastic (LVE) region is determined from storage modulus vs strain measured under 1 Hz oscillation at gaps between 1300 to 1400 micron. (right) Elastic modulus in LVE region for carbon black suspension with different concentration of carbon black in 1.4 w/wwater% Carbopol + 7 M KOH.
Figure 21 shows elastic modulus measured for different concentration of carbon black in
1.4 W/Wwater% Carbopol + 7 M KOH. There is no obvious sharp increase in elastic modulus with
different concentration of carbon black, due to the contribution of elasticity from continuous medium itself. Hence, conductivity method was used to determine the percolation threshold as there will be no contribution from the continuous medium.
Figure 22 shows electronic conductivity of suspensions at different amount of carbon black for catholyte and Zn for anolyte. Percolation threshold is about 6 w/wwater% (~3 V/Vtotal%) for carbon black and 48 w/wwater% (~10.5 v/vtotai%) for Zn. These numbers are much lower than theoretical percolation threshold for spherical particle which is 28 V/Vtotal% 7 5.This deviation can be explained from fractal like shape of carbon particles and highly anisometric shape of Zn particles shown in Figure 17. It is worth to note that conductivity of the conductive suspension is still nearly maintained upon addition of high amount of active material: 4.12 1.09 mS/cm for
carbon black + Ni(OH)2 suspension (composition in w/wwater% carbon black : Ni(OH)2 :
CarbopolC = 14.0 : 39.8 : 1.4) and 67 7 mS/cm for Zn + ZnO suspension(composition in
w/wwater% Zn : ZnO : Carbopol = 71.1 : 42.1 : 1.8). This suggests that theoretically we will be
able to achieve catholyte with 5.4 M active material concentration and energy density of 240
Wh/Latholyte (-6 times of catholyte for vanadium flow battery). Also, having high conductivity