HAL Id: ird-00780451
https://hal.ird.fr/ird-00780451
Submitted on 24 Jan 2013
HAL is a multi-disciplinary open access archive for the deposit and dissemination of sci-entific research documents, whether they are pub-lished or not. The documents may come from
L’archive ouverte pluridisciplinaire HAL, est destinée au dépôt et à la diffusion de documents scientifiques de niveau recherche, publiés ou non, émanant des établissements d’enseignement et de
Statistics of the French purse seine fishing fleet targeting
tropical tunas in the Indian Ocean (1981-2011)
Emmanuel Chassot, Laurent Floch, Patrice Dewals, Isabelle Terrier, Pierre
Chavance
To cite this version:
Emmanuel Chassot, Laurent Floch, Patrice Dewals, Isabelle Terrier, Pierre Chavance. Statistics of the French purse seine fishing fleet targeting tropical tunas in the Indian Ocean (1981-2011). IOTC Working Party on Tropical Tunas, Oct 2012, Grand-Baie, Mauritius. 29 p. multigr. �ird-00780451�
Statistics of the French purse seine fishing fleet targeting tropical
tunas in the Indian Ocean (1981-2011)
Chassot E.a, L. Flocha,∗, P. Dewalsb, I. Terriera, P. Chavancea
a
Institut de Recherche pour le D´eveloppement, UMR 212 EME (IRD/Ifremer/Universit´e de Montpellier 2), Avenue Jean Monnet, BP 171, 34 203 S`ete Cedex, FRANCE
b
Institut de Recherche pour le D´eveloppement, Seychelles Fishing Authority, BP 570, Victoria, SEYCHELLES
Abstract
In 2011, the French purse seine fishing fleet of the Indian Ocean was composed of 8 large size vessels that represented a total carrying capacity of about 8,000 t. Catches reached a total of 43,000 t and were composed of 50%, 42%, and 8% of yellowfin, skipjack, and bigeye, respectively. After a period of increase during 2006-2008, the fishing effort of the fleet has been decreasing to reach a minimum of 1,800 searching days in 2011. The decrease in effort was associated with a contraction of the fleet fishing grounds in the recent years and mainly characterized by a strong decrease in the number of sets made on free-swimming schools; a total of 1,800 fishing sets being made in 2011 compared to about 4,200 y−1 in the
mid-2000s. Hence, the percentage of sets made on FAD-associated schools steadily increased since 2004 to reach more than 65% in 2010-2011, FAD-fishing resulting in 75% of the total catch of the French purse seine fishing fleet in 2011. Species-specific catch rates (in t per searching day) on FAD-associated schools reveal increasing trends over 1981-2011 with high interannual variability while no clear trend is apparent in the time series of catch rates on free-swimming schools. The year 2011 is characterized by a large proportion of yellowfin in the catch on FAD-associated schools that might indicate a good recruitment. For both fishing modes, the mean weight in the catch of the 3 tropical tunas has decreased since the mid-2000s with values in 2011 equal to 7.1 kg, 2.4 kg, and 5.4 kg for yellowfin, skipjack, and bigeye, respectively.
Keywords: fish aggregating device, free-swimming school, Katsuwonus pelamis, purse seine fishing, Thunnus albacares, Thunnus obesus
∗Corresponding author
Contents
1 Introduction 2
2 Fishing capacity and effort 3
2.1 Fishing fleet . . . 3
2.2 Carrying capacity . . . 3
2.3 Fishing and searching days . . . 4
2.4 Fishing grounds . . . 5
2.5 Fishing activities . . . 6
3 Fisheries production 9 3.1 Catch levels . . . 9
3.2 Spatial distribution of the catch . . . 9
3.3 Catch rates . . . 11
3.4 Size structure of the catch . . . 16
3.5 Mean weight in the catch . . . 17
4 References 21
5 Appendix tables 22
1. Introduction
Statistical data for the French purse seine fishing fleet have been collected by the “Institut de Recherche pour le D´eveloppement” (IRD; ex-ORSTOM) since the arrival of the first purse seiners in the early 1980s. French purse seiners target yellowfin (Thunnus albacares), skipjack (Katsuwonus pelamis), and bigeye tuna (Thunnus obesus) through two major fishing modes that result in different species and size composition of the catch: log/FAD-associated (FAD) and free-swimming schools (FSC). The acronym ”FAD”, which stands for drifting fish aggregating device, is used here to describe any type of floating object used for increasing tuna catchability. This includes natural objects (e.g. logs, palm branches) and anthropogenic floating objects, such as man-made bamboo rafts equipped with radio-range beacons, satellite transmitters or scanning sonars. Fishing sets made on whales were classified as free-swimming school sets whereas sets made on whale sharks (Rhincodon
typus) were classified as FAD sets (Pallar´es and Hallier 1997). The fleet activities are described through a suite of fisheries indicators that provide information on fishing effort, catch, catch rates, size structure and mean weights for the 3 principal market tropical tunas, with a particular focus on the year 2011.
2. Fishing capacity and effort
2.1. Fishing fleet
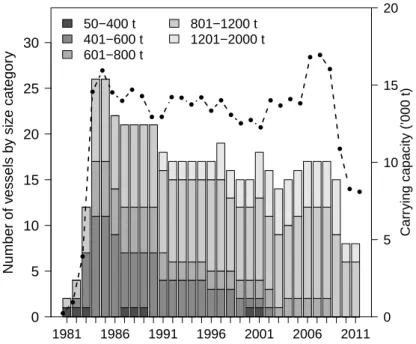
The number of vessels of the French purse seine fishing fleet in the Indian Ocean rapidly increased from 2 in 1981 to a maximum of 26 during 1984-1985 with the arrival of vessels from the Atlantic Ocean. Since then, the number of vessels steadily decreased to reach a minimum of 8 in 2010-2011 (Fig. 1 and Table 1). The size of the vessels progressively increased in the French purse seine fishery over the last 30 years. The number of small-size vessels (capacity < 600 t) decreased throughout the 1980s and 1990s to become 0 in the mid-2000s while medium-size vessels (capacity between 601-800 t) disappeared from the fishery in the late 2000s (Fig. 1).
Number of v essels b y siz e categor y 0 5 10 15 20 25 30 1981 1986 1991 1996 2001 2006 2011 50−400 t 401−600 t 601−800 t 801−1200 t 1201−2000 t 0 5 10 15 20 Carr ying capacity (’000 t)
Figure 1: Fishing capacity of the French purse seine fleet in the Indian Ocean. Annual changes in the number of purse seiners by size category (barplots) and total carrying capacity (solid line with circles) during 1981-2011. Capacity was weighted by the vessel-specific proportion of the year at sea (in months). The vessel
size category (t) was computed as 0.7 times the capacity expressed in m3
2.2. Carrying capacity
The total carrying capacity expressed in tonnage strongly increased from the arrival of the first purse seiner in 1981 to about 14,000 t in the mid-1980s. Despite the steady decrease in the total number of vessels, the capacity remained stable through the 1990s and 2000s
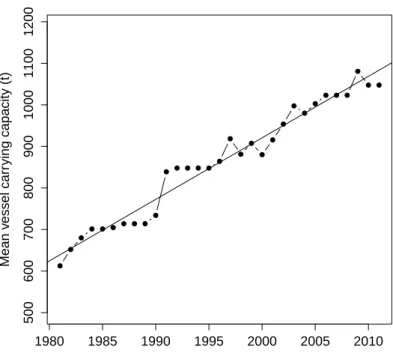
1980 1985 1990 1995 2000 2005 2010 500 600 700 800 900 1000 1100 1200 Mean v essel carr ying capacity (t)
Figure 2: Changes in mean vessel carrying capacity for the French purse seine fishing fleet in the Indian Ocean, 1981-2011. The vessel-specific carrying capacity was weighted by the relative annual catch of each purse seiner. Solid line indicates mean linear regression
and increased to a maximum of 17,000 t in 2007 (Fig. 1). Indeed, the mean vessel-specific carrying capacity of the French purse seiners increased from about 600 t in the early 1980s to more than 1,000 t from the mid-2000s (Fig. 2; slope = +13 t−1, p-value < 0.001). In
the recent years, the capacity of the French fleet decreased to reach about 8,000 t during 2010-2011. Meanwhile, the capacity of the French overseas territories increased from less than 500 t in 2006 to more than 5,000 t in 2011 due to the construction of new purse seiners (Chassot et al. 2012).
2.3. Fishing and searching days
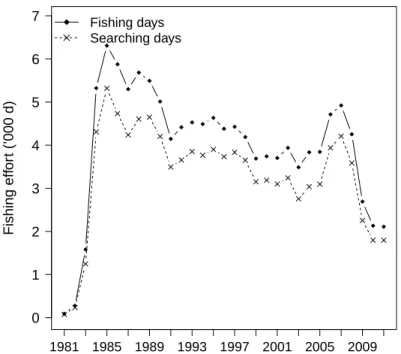
Fishing effort expressed in searching time (days) was computed by subtracting the time spent setting the gear from the fishing time. The time spent setting the gear was esti-mated by regressions linking duration and size of sets, from at-sea measurements made by scientific observers. The total number of fishing and searching days showed similar patterns over 1981-2011 with a major increase in the mid-1980s and a steady decrease until 2005 thereafter (Fig. 3). An increase in effort to a value of almost 5,000 fishing days was then observed due to the increase in the number of purse seiners from 14 in 2003 to 17 during 2006-2008. Since then, the nominal fishing effort strongly decreased and
reached in 2011 values of about 2,110 and 1,800 fishing days and searching days, respectively. 0 1 2 3 4 5 6 7 Fishing eff or t (’000 d) 1981 1985 1989 1993 1997 2001 2005 2009 Fishing days Searching days
Figure 3: Changes in nominal effort over time. Annual total number of fishing and searching days for the French purse seine fishing fleet in the Indian Ocean during 1981-2011
2.4. Fishing grounds
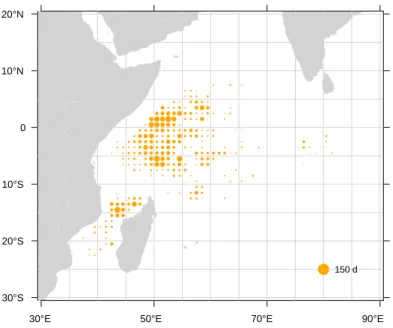
The major fishing grounds of the French purse seine fishing fleet in 2011 were located in the north of the Mozambique Channel, west of the Seychelles, and along the Somali EEZ boundary (Fig. 4). A few fishing activities took place south of the Seychelles at longitude between 55◦ and 60◦E and in the east of the Chagos EEZ.
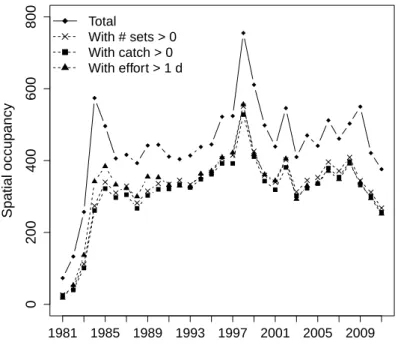
After a major expansion of the fishing grounds during the early 1980s, the spatial extent of the fishery steadily increased over time from a total of about 400 squares in the mid-1980s to a mean value of 490 squares in the late 2000s (Fig. 5). The peak observed in 1998 corresponded to a particular climatic event that has been described elsewhere (Murtuggude 1999, Murtugudde et al. 2000) and led the purse seiners to explore the eastern part of the Indian ocean for fishing (M´enard et al. 2006). The different selection criteria, i.e. minimum catch, effort, or sets, did not modify the temporal patterns in the spatial extent of the fishery (Fig. 5).
30°E 50°E 70°E 90°E 30°S 20°S 10°S 0 10°N 20°N 150 d
Figure 4: Fishing grounds. Spatial distribution of fishing effort (in searching days) of the French purse seine fishing fleet in 2011
2.5. Fishing activities
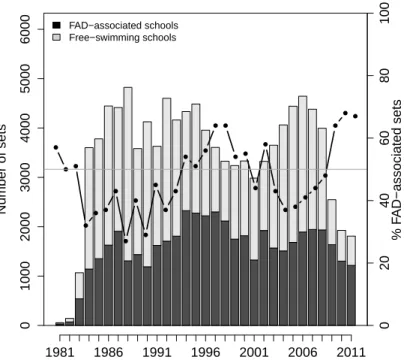
The total annual number of fishing sets made by the French purse seine fleet showed a general pattern consistent with the annual variations in carrying capacity and fishing effort of the fleet (Fig. 6 and Table 4). The fleet showed a strong decrease in the number of sets from more than 4,300 in the mid-2000s to less than 2,000 in 2010-2011. The total number of sets showed a pattern very similar to the annual changes in the number of sets made on free-swimming schools (Fig. 6). The annual number of sets made on FAD-associated schools was more stable over time (around 1,700 y−1) and in opposite phase compared to sets made
on free-swimming schools. The percentage of FAD-associated over free-swimming schools varied around a mean of 47% (SD = 10%) with FAD-associated fishing predominating from the mid-1990s to the early 2000s while sets made on free-swimming schools were more frequent during 2003-2008. The percentage of sets made on FAD-associated schools steadily increased from 37% in 2004 to reach more than 65% in 2010-2011.
The percentage of successful sets (i.e. positive tuna catch) made on FAD-associated schools has been high over the period 1981-2011, the mean annual value varying between a minimum of 85% in 1984 and a maximum of 95% in 1991. After a decrease during the development of the fishery, the percentage of successful sets on free-swimming schools steadily increased from a mean value of 37% in 1986 to an average of 54% during 2007-2011 (slope = +0.5% y−1, p-value < 0.001). By contrast, the high success of sets on FAD-associated schools does
0 200 400 600 800 Spatial occupancy 1981 1985 1989 1993 1997 2001 2005 2009 Total With # sets > 0 With catch > 0 With effort > 1 d
Figure 5: Changes in spatial extent of the fishery over time. Annual number of 1-degree squares explored by the French purse seine fishing fleet during 1981-2011
Number of sets 0 1000 2000 3000 4000 5000 6000 1981 1986 1991 1996 2001 2006 2011 FAD−associated schools Free−swimming schools 0 20 40 60 80 100 % F AD−associated sets
Figure 6: Fishing activities. Annual number of fishing sets in the French purse seine fishery on FAD-associated and free-swimming schools during 1981-2011. Line with solid circles indicates the percentage of sets made on FAD-associated schools over free-swimming schools. Grey solid line indicates the 50% value
not show any clear temporal pattern over the period. In the recent years, the success rate for FAD-associated schools seems to show an increasing trend that could be related to the improvement and increasing use of lateral echo sounders.
3. Fisheries production
3.1. Catch levels
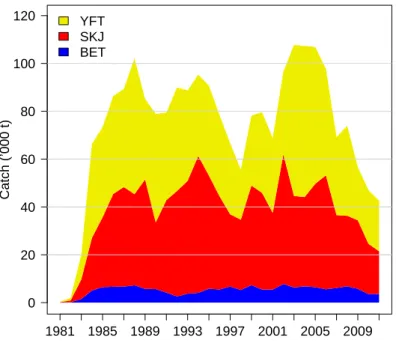
The French purse seine fishery showed strong interannual variations in the catch over 1987-2008 with a minimum of 56,000 t in 1998 and a maximum of 108,000 t during 2003-2004 (Fig. 7). Since then, the total catch of the fleet strongly declined in relation with the decrease in the number of vessels and reached 43,000 t in 2011. Catches on FAD-associated schools represented on average 60% (SD = 8%) of the total fleet catch over 1981-2011. Following the large catch of tunas on free-swimming schools during 2003-2005, the percentage of FAD-associated catch steadily increased (slope = +4.3%, p-value < 0.001) to reach more than 70% during 2009-2011. Catches on FAD-associated schools appeared more stable than catches on free-swimming schools during 1981-2011 (Fig. 8). They were largely dominated by skipjack that represented an annual mean of 62% (SD = 6.5%) of all species caught, varying from 53% in 1997 to more than 75% in 1991 (Fig. 8a). Catches of bigeye, re-estimated from multispecies sampling operations conducting at unloading (Pallar´es and Hallier 1997), varied between 3.7% and 13% of the total of catch on FAD-associated schools during 1981-2011. Catches of yellowfin on FAD-associated schools were stable over the period representing on average 27% (SD = 5.2%) of the catch.
Catches made on free-swimming schools showed strong internannual variations in the last two decades from a maximum of 50,000 t in 2004 to a minimum of 8,000 t in 2011 (Fig. 8b). The changes over time in free-swimming schools catches drove the trends in the total catch of the fishery. The catches were largely dominated by yellowfin that represented an annual average of 74% (SD = 9%) of the FSC catch during 1981-2010, and a similar value of 74% in 2011. However, while free-swimming schools represented more than 60% of the total catch of yellowfin during 1981-2010, it only represented 38% of the total yellowfin catch in 2011. The predominance of yellowfin in the French purse seine catch from FAD-associated fishing (> 50% of the catch) had only been observed during 1997-1999 during the strong El-Ni˜no event. In the recent period, this pattern stems from the strong decrease in the number of sets made on free-swimming schools which might reveal a change in purse seine fishing strategy due to a decrease in tuna free-swimming schools in conjunction with the Somali piracy threat (Chassot et al. 2010), the implementation of the BIOT marine protected area that decreased purse seine fishing grounds as well as to the high sale price of skipjack (Table 4). In addition, the proportion of yellowfin in FAD-associated catch reached more than 40% in 2011 while it represented an average of 28% (SD = 5%) during 1982-2010 (see below).
3.2. Spatial distribution of the catch
The French purse seine fleet fishing grounds in 2011 were concentrated in the north of the Mozambique Channel and the Somali area where FAD-fishing predominated while
0 20 40 60 80 100 120 Catch (’000 t) 1981 1985 1989 1993 1997 2001 2005 2009 YFT SKJ BET
Figure 7: Total fishery production. Catch by species of the French purse seine fishing fleet during 1981-2011
0 20 40 60 Catch (’000 t) 1981 1987 1993 1999 2005 2011 YFT SKJ BET (a) FAD−associated schools
0 20 40 60 Catch (’000 t) 1981 1987 1993 1999 2005 2011 YFT SKJ BET (b) Free−swimming schools
Figure 8: Fishery production by major fishing mode. Catch by species of the French purse seine fishing fleet on (a) FAD-associated and (b) free-swimming schools during 1981-2011
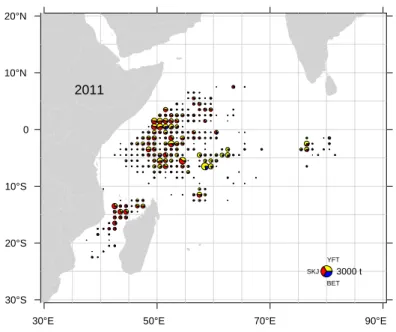
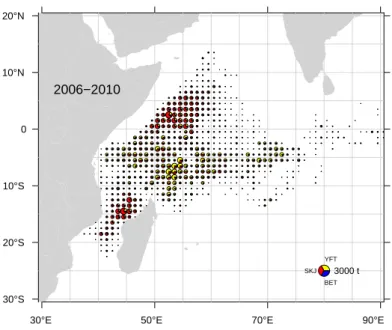
fishing on free-swimming schools mainly occurred around and south-east of the Seychelles islands, and in the Mozambique to a lesser extent (Fig. 9). As compared to previous years (2006-2010), the composition of the catch on FAD-associated schools in the Somali area was described by an important part of yellowfin that represented more than 50% of the catch in most of the 1x1 degree squares west of 55◦E and north of 10◦S (Figs. 11-12). This might
result from a good recruitment of yellowfin in 2011 as suggested by the size structure of the catch (see Section 3.4).
30°E 50°E 70°E 90°E
30°S 20°S 10°S 0 10°N 20°N YFT SKJ BET 3000 t 2011
Figure 9: Spatial distribution of tuna catches of the French purse seine fishing fleet in 2011
Besides, catches on free-swimming schools in 2011 were predominated by skipjack in the Mozambique Channel (Fig. 13), as generally observed in this area, while the remaining of the catch was scattered along latitude 5◦S and predominated by yellowfin, with a few
squares characterized by 15-20% of bigeye (Fig. 13).
3.3. Catch rates
Raw catch rates expressed in tonnes per searching day (t d−1) for the principal market
tunas exhibit an increasing trend over 1981-2011, in particular from the early 1980s to the mid-1990s (Fig. 15). While skipjack and yellowfin are mainly caught in different fishing modes, their respective CPUEs were in the same order of magnitude, i.e. a mean value of 10.3 and 10 t per searching day for yellowfin and skipjack, respectively. Also, the CPUE time series showed very similar trends over time, with the notable exception of 2003-2005
30°E 50°E 70°E 90°E 30°S 20°S 10°S 0 10°N 20°N YFT SKJ BET 3000 t 2006−2010
Figure 10: Spatial distribution of tuna catches of the French purse seine fishing fleet in 2006-2010
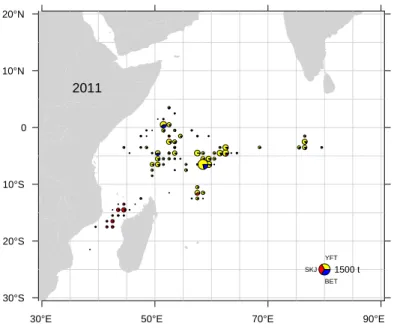
30°E 50°E 70°E 90°E
30°S 20°S 10°S 0 10°N 20°N YFT SKJ BET 1500 t 2011
Figure 11: Spatial distribution of tuna catches of the French purse seine fishing fleet made on FAD-associated schools in 2011
30°E 50°E 70°E 90°E 30°S 20°S 10°S 0 10°N 20°N YFT SKJ BET 1500 t 2006−2010
Figure 12: Spatial distribution of tuna catches of the French purse seine fishing fleet made on FAD-associated schools in 2006-2010
30°E 50°E 70°E 90°E
30°S 20°S 10°S 0 10°N 20°N YFT SKJ BET 1500 t 2011
Figure 13: Spatial distribution of tuna catches of the French purse seine fishing fleet made on free-swimming schools in 2011
30°E 50°E 70°E 90°E 30°S 20°S 10°S 0 10°N 20°N YFT SKJ BET 1500 t 2006−2010
Figure 14: Spatial distribution of tuna catches of the French purse seine fishing fleet made on free-swimming schools in 2006-2010
described by abnormally high catch rates for yellowfin on free-swimming schools (Fig. 16b). Raw catch rates of bigeye also showed an increasing trend during 1981-2011 (slope = +4.4%, p-value <0.001) with an average of 1.88 t d−1 (SD = 0.4 t d−1).
Skipjack catch rates predominated on FAD-associated schools during 1981-2011 and increased quickly through the 1980s while stabilising around 10 t searching d−1 (SD = 2.3
t d−1) since the early 1990s (Fig. 16a). Yellowfin catch rates have shown an increasing
trend since the early 1980s with some interannual variability. The maximum catch rates for yellowfin on FAD-associated schools have been observed in 2011, i.e. an annual value of 7.3 t d−1. Bigeye raw catch rates on FAD-associated schools have remained stable around
a mean value of 1.4 t d−1 since the late 1990s (Fig. 16a).
Yellowfin catch rates predominated for sets made on free-swimming schools and remained quite stable over time (mean of 7 t d−1 during 1984-2011), with abnormally high values
during 2003-2005 > 13.5 t d−1 (Fig. 16b). In 2011, the catch rate of yellowfin in
free-swimming schools was less than 4.5 t d−1. Catch rates for skipjack have shown high
interannual variability during 1986-2011 (mean = 2 t d−1, SD = 1 t d−1) and a decreasing
trend in the recent years, with catch rates < 1 t d−1 during 2009-2011. Catch rates for
dur-1980 1985 1990 1995 2000 2005 2010 0 10 20 30 40
Catch per unit eff
or t (t d − 1 ) Total Skipjack Yellowfin Bigeye
Figure 15: Annual catch rates (in t per searching day) of the French purse seine fishing fleet in the Indian Ocean during 1981-2011
ing the mid-1980s to the mid-1990s to a mean annual value of 0.6 t d−1throughout the 2000s. 0 5 10 15 20
Catch per unit eff
or t (t d − 1 ) 1981 1987 1993 1999 2005 2011 Total Skipjack Yellowfin Bigeye (a) 0 5 10 15 20 25
Catch per unit eff
or t (t d − 1 ) 1981 1987 1993 1999 2005 2011 Total Yellowfin Skipjack Bigeye (b)
Figure 16: Annual catch rates (in t per searching day) of the French purse seine fishing fleet on (a) FAD-associated and (b) free-swimming schools in the Indian Ocean during 1981-2011
3.4. Size structure of the catch
The size structure of the catch (expressed in number) in 2011 appeared similar for the 3 tuna species to the average year representing the period 2006-2010, with the exception of skipjack caught on free-swimming schools that were smaller (Fig. 17). The sizes of yellowfin caught on FAD-associated schools were described by 2 modes for small (46 cm) and intermediate sizes (56 cm) while larger individuals (> 80 cm) were also caught but more seldomly. The year 2011 was characterized by a high peak of small yellowfin (size range of 42-48 cm fork length) which might indicate a good recruitment. Bigeye caught on FAD-associated schools in 2011 were only juvenile fishes of median size of 52 cm (sd = 9 cm). Skipjack showed a unique size mode described by a median of 46 cm (min = 31 cm and max = 69 cm) similar to 2006-2010 during which the median size of skipjack was 47 cm.
Similarly, the biomass of fish caught by size class showed overall similar patterns between 2011 and 2006-2010 except for skipjack caught smaller on free-swimming schools in 2011 (Fig. 18). For yellowfin caught on FAD-associated schools, the year 2011 was described by larger biomass of fishes comprised between 60-100 cm. In relation with the decrease in activities on free-swimming schools, the biomass of large yellowfin and bigeye (> 100 cm) caught was lower in 2011 than for the average year 2006-2010. The biomass of skipjack 44-50 cm long caught on FAD-associated schools, which represent the bulk of skipjack catch, was very similar in 2011 than during 2006-2010 while there was a strong decrease in
skipjack catch on free-swimming schools (Table 5-7).
3.5. Mean weight in the catch
Time series of the mean weight in the catch for the principal market tropical tunas were computed as the species-specific annual biomass over the total number of fishes caught. The sampling design used to collect size-frequency data aboard French purse seiners thoughout the 1980s varied over time (Pianet 1999) therefore the mean weight was computed from 1991 for data consistency. The mean weight highly differed between fishing modes and showed strong interannual variations during 1991-2011 (Fig. 19). The mean weight of yellowfin caught on free-swimming schools decreased from more than 37 kg in 1991 to a minimum of about 15 kg in 1998-1999, before progressively increasing thereafter to reach about 38 kg in 2004-2005. Since then, the mean weight decreased to about 28 kg during 2009-2011 (Fig. 19a). It is noteworthy that the yellowfin mean weight showed an increase from 25 kg in 2010 to 29 kg in 2011. After an initial decrease from about 10 kg in the early 1990s, the mean weight of yellowfin in the catch made on FAD-associated schools stabilised at around 5.7 kg (SD = ± 1.1 kg) from the mid-1990s to the late 2000s. In 2011, the mean weight of yellowfin caught on FAD-associated schools was less than 5 kg. Overall, the mean weight of yellowfin caught in the French purse seine fleet has shown a strong decrease from about 18 kg during 2003-2005 to about 7 kg in 2011 (slope = -1.4 kg −1; p-value < 0.001) due to
increasing proportion of FAD-fishing in the fishery over the last decade (Fig. 6 – dotted line). The overall mean weight of skipjack was more stable than yellowfin during 1991-2011 and driven by the mean weight of skipjack caught on FAD-associated schools. It varied between a maximum of 3 in 1992 and a minimum of 2 kg in 2008 for fishes caught on FAD-associated schools (Fig. 19b). After a decrease during 2007-2008, the mean weight remained stable at about 2.3 kg during 2009-2011. The mean weight of skipjack caught on free-swimming schools has shown a strong and significant decrease from more than 4.2 kg in 2003-2004 to 2.4 kg in 2009-2011 (slope = -0.3 kg −1, p-value < 0.001).
The mean weight of bigeye varied around 5.8 kg (SD ± 1 kg) during 1991-2011 for the whole fishery (Fig. 19c). It showed strong interannual variations for individuals caught on free-swimming schools with a pattern very similar to yellowfin tuna (Pearson’s r = 0.77; p-value < 0.001). The mean weight of bigeye caught on FAD-associated schools showed a significant decreasing trend during 1991-2011 (slope = -0.06 kg −1, p-value < 0.01) with
high interannual variations. In 2011, the mean weight of bigeye caught on free-swimming schools and FAD-associated schools was 18.3 kg and 3.8 kg, respectively.
Acknowledgments. We thank ORTHONGEL, Pascal Cauquil, C´eline Rodriguez, Julien Barde and all past and current personnel for helpful assistance in data collection and management. We are particularly grateful to Renaud Pianet, Viveca Nordstrøm and Alain Fonteneau for their dedication to the monitoring of tropical tuna fisheries and their support to the Observatoire Thonier. The collaboration with Alicia Delgado de Molina (IEO) and
0 50 100 150 0 2000 4000 Size class (cm) Numbers (’000) 2011 2006−2010
F
AD
YFT
0 50 100 150 0 100 300 Size class (cm) Numbers (’000) 2011 2006−2010FSC
0 50 100 150 0 2000 4000 Size class (cm) Numbers (’000) 2011 2006−2010ALL
0 50 100 150 0 400 800 Size class (cm) Numbers (’000) 2011 2006−2010BET
0 50 100 150 0 10 20 30 40 Size class (cm) Numbers (’000) 2011 2006−2010 0 50 100 150 0 400 800 Size class (cm) Numbers (’000) 2011 2006−2010 0 20 60 100 0 4000 8000 Size class (cm) Numbers (’000) 2011 2006−2010SKJ
0 20 60 100 0 500 1000 1500 Size class (cm) Numbers (’000) 2011 2006−2010 0 20 60 100 0 4000 10000 Size class (cm) Numbers (’000) 2011 2006−2010Figure 17: Size structure of the catch. Size distribution (in numbers) of the species-specific catch for the French purse seine fishing fleet in 2011 (red line) and for an average year representing the period 2006-2010 (black line)
0 50 100 150 0 2000 6000 Size class (cm) Biomass (t) 2011 2006−2010
F
AD
YFT
0 50 100 150 0 5000 15000 Size class (cm) Biomass (t) 2011 2006−2010FSC
0 50 100 150 0 5000 15000 Size class (cm) Biomass (t) 2011 2006−2010ALL
0 50 100 150 0 1000 3000 Size class (cm) Biomass (t) 2011 2006−2010BET
0 50 100 150 0 400 800 1200 Size class (cm) Biomass (t) 2011 2006−2010 0 50 100 150 0 1000 3000 Size class (cm) Biomass (t) 2011 2006−2010 0 20 60 100 0 10000 20000 Size class (cm) Biomass (t) 2011 2006−2010SKJ
0 20 60 100 0 1000 3000 Size class (cm) Biomass (t) 2011 2006−2010 0 20 60 100 0 10000 20000 Size class (cm) Biomass (t) 2011 2006−2010Figure 18: Size structure of the catch. Size distribution (in weight) of the French purse seine fishing fleet in 2011 (red line) and for an average year representing the period 2006-2010 (black line)
0 1000 2000 3000 4000 Mean w eight (kg) 1991 1995 1999 2003 2007 2011 FSC All FAD (a) YFT 0 100 200 300 400 Mean w eight (kg) 1991 1995 1999 2003 2007 2011 FSC All FAD (b) SKJ 0 1000 2000 3000 4000 Mean w eight (kg) 1991 1995 1999 2003 2007 2011 FSC All FAD (c) BET
Cindy Assan (SFA) was instrumental in data processing. This work was financed by the European Data Collection Framework (DCF, Reg 199/2008 and 665/2008) and supported by the Direction des Pˆeches Maritimes et de l’Aquaculture (DPMA).
4. References
Chassot, E., P. Dewals, L. Floch, V. Lucas, M. Morales-Vargas, and D.M. Kaplan. 2010. Analysis of the effects of Somali piracy on the European tuna purse seine fisheries of the Indian Ocean. Proceedings of the
13th
Session of the IOTC Scientific Committee. IOTC-2010-SC-09, 26p.
Chassot, E., Floch, L., P. Dewals, I. Terrier, and P. Chavance. 2012. Statistics of the purse seine fleet of the French overseas territories targeting tropical tunas in the Indian Ocean (2001-2011). Proceedings of the
14th
Session of the IOTC Working Party on Tropical Tunas, IOTC-2012-WPTT14-21, 27p.
M´enard, F., F. Marsac, E. Bellier, and B. Cazelles. 2007. Climatic oscillations and tuna catch rates in the Indian Ocean: a wavelet approach to time series analysis. Fisheries Oceanography 16: 95–104.
Murtuggude, R. G., S. R. Signorini, J. R. Christian, A. J. Busalacchi, C. R. McClain, and J. Picaut. 1999. Ocean color variability of the tropical Indo-Pacific basin observed by SeaWiFS during 1997–1998. Journal of Geophysical Research 104: 18351–18351.
Murtuggude, R. G., J. P. McCreary, and A. J. Busalacchi. 2000. Oceanic processes associated with anomalous events in the Indian Ocean with relevance to 1997-1998. Journal of Geophysical Research 105: 3295–3306.
Pallar´es, P & J.P. Hallier. 1997. Analyse du sch´ema d’´echantillonnage multisp´ecifique des thonid´es
tropicaux (Programme n◦ 95/37), Technical report, IEO/ORSTOM
Pianet, R. 1999. ´Evolution du syst`eme de collecte et de traitement des donn´ees de la pˆeche thoni`ere des
senneurs europ´eens et assimil´es de 1981 `a 1998. IOTC Working Party on Data Collection and Statistics,
Table 1: Annual number of purse seiners by size category and total carrying capacity of the French tropical tuna purse seine fishing fleet of the Indian Ocean during 1981-2011. Total carrying capacity (CC) was weighted by the proportion of the year at sea (in months)
Year 50-400 401-600 601-800 801-1200 1201-2000 >2000 Total CC 1981 1 0 0 1 0 0 2 233 1982 1 1 0 2 0 0 4 945 1983 1 6 0 5 0 0 12 3907 1984 0 11 6 9 0 0 26 14566 1985 0 11 6 9 0 0 26 15945 1986 0 9 5 8 0 0 22 14526 1987 1 6 5 9 0 0 21 13983 1988 1 6 5 9 0 0 21 14699 1989 1 6 5 9 0 0 21 14285 1990 0 7 5 9 0 0 21 12939 1991 0 4 3 9 2 0 18 12943 1992 0 4 2 9 2 0 17 14220 1993 0 4 2 9 2 0 17 14180 1994 0 4 2 9 2 0 17 13743 1995 0 4 2 9 2 0 17 14199 1996 0 3 2 10 2 0 17 13341 1997 0 3 2 10 4 0 19 14013 1998 0 3 2 8 3 0 16 13074 1999 0 2 2 8 3 0 15 12523 2000 1 1 2 8 3 0 15 12736 2001 1 1 2 9 5 0 18 12261 2002 0 1 2 8 5 0 16 14011 2003 0 0 1 8 5 0 14 13676 2004 0 0 2 8 5 0 15 14090 2005 0 0 2 9 5 0 16 13818 2006 0 0 2 10 5 0 17 16805 2007 0 0 2 10 5 0 17 16949 2008 0 0 2 10 5 0 17 16035 2009 0 0 0 9 6 0 15 10878 2010 0 0 0 6 2 0 8 8275 2011 0 0 0 6 2 0 8 8093
Table 2: Annual nominal fishing effort of the French purse seine fleet expressed in fishing and searching days during 1981-2011. Searching days was derived from the total time spent at sea corrected for periods of damage, route towards port, and purse seine operation
Year Fishing days Searching days
1981 91 75 1982 277 235 1983 1582 1247 1984 5323 4310 1985 6308 5319 1986 5876 4732 1987 5300 4240 1988 5683 4606 1989 5492 4649 1990 5013 4202 1991 4146 3496 1992 4417 3656 1993 4528 3853 1994 4490 3766 1995 4633 3901 1996 4381 3734 1997 4427 3835 1998 4189 3651 1999 3690 3152 2000 3742 3187 2001 3703 3101 2002 3938 3242 2003 3488 2756 2004 3836 3039 2005 3845 3096 2006 4714 3940 2007 4921 4208 2008 4254 3589 2009 2692 2253 2010 2132 1797 2011 2109 1796
Table 3: Annual number of 1-degree squares explored by the French purse seine fishing fleet during 1981-2011
Year TOTAL #sets>0 Catch>0 Effort>1 d Effort>5 d
1981 73 26 25 18 1982 133 47 40 53 10 1983 257 112 101 137 60 1984 574 274 261 342 182 1985 496 340 322 384 267 1986 406 310 297 333 223 1987 416 329 305 323 206 1988 393 282 267 300 210 1989 442 315 303 355 229 1990 444 336 320 353 215 1991 411 334 321 332 200 1992 404 345 333 330 196 1993 414 333 325 328 217 1994 438 356 348 363 228 1995 445 367 362 371 229 1996 522 405 392 409 243 1997 524 415 392 422 257 1998 755 551 528 556 243 1999 611 426 411 418 195 2000 498 359 343 361 196 2001 439 340 319 344 203 2002 546 402 381 405 233 2003 410 313 302 293 186 2004 470 345 323 330 171 2005 441 353 336 337 198 2006 512 396 379 371 218 2007 461 371 354 348 222 2008 503 409 397 391 230 2009 550 344 332 339 163 2010 421 312 301 295 136 2011 376 268 256 252 123
Table 4: Number of positive and null sets by fishing mode made by the French purse seine fishing fleet of the Indian ocean during 1981-2011. FAD = Fish Aggregating Device; FSC = Free-Swimming School
ALL FAD FSC
Total Positive Null Total Positive Null Total Positive Null
1981 56 44 12 32 29 3 24 15 9 1982 143 105 38 72 63 9 71 42 29 1983 1068 766 302 540 470 70 528 296 232 1984 3601 2211 1390 1143 971 172 2458 1240 1218 1985 3780 2274 1506 1353 1210 143 2427 1064 1363 1986 4446 2429 2017 1628 1393 235 2818 1036 1782 1987 4414 2813 1601 1908 1676 232 2506 1137 1369 1988 4824 2823 2001 1309 1177 132 3515 1646 1869 1989 3583 2243 1340 1436 1310 126 2147 933 1214 1990 4126 2527 1599 1189 1093 96 2937 1434 1503 1991 3630 2448 1182 1622 1538 84 2008 910 1098 1992 4602 2980 1622 1708 1569 139 2894 1411 1483 1993 4163 2763 1400 1810 1611 199 2353 1152 1201 1994 4332 3099 1233 2326 2068 258 2006 1031 975 1995 4486 3066 1420 2276 2052 224 2210 1014 1196 1996 3956 2883 1073 2221 1956 265 1735 927 808 1997 3607 2714 893 2301 2035 266 1306 679 627 1998 3328 2454 874 2117 1828 289 1211 626 585 1999 3238 2369 869 1750 1553 197 1488 816 672 2000 3333 2475 858 1818 1555 263 1515 920 595 2001 2984 2175 809 1327 1223 104 1657 952 705 2002 3325 2597 728 1924 1822 102 1401 775 626 2003 3651 2464 1187 1570 1405 165 2081 1059 1022 2004 4062 2580 1482 1511 1378 133 2551 1202 1349 2005 4442 3051 1391 1683 1532 151 2759 1519 1240 2006 4644 3148 1496 1893 1743 150 2751 1405 1346 2007 4381 2932 1449 1944 1747 197 2437 1185 1252 2008 3995 2874 1121 1936 1760 176 2059 1114 945 2009 2548 2060 488 1636 1502 134 912 558 354 2010 1927 1554 373 1304 1212 92 623 342 281 2011 1810 1446 364 1217 1132 85 593 314 279
Table 5: Catch by species for the French purse seine fishing fleet of the Indian ocean during 1981-2011
Year YFT SKJ BET ALB OTH TOTAL
1981 188 158 23 0 56 425 1982 1081 792 145 0 0 2018 1983 10400 8153 1536 0 136 20225 1984 39268 21979 5081 224 228 66781 1985 37706 29183 6477 445 483 74293 1986 40911 38786 6636 200 693 87227 1987 41012 41620 6701 217 43 89593 1988 56766 38094 7251 177 732 103020 1989 33548 45750 5764 6 0 85068 1990 45351 27873 5663 36 31 78954 1991 36597 38630 4217 848 0 80292 1992 43287 44081 2580 1344 0 91292 1993 37792 47155 3773 292 0 89012 1994 34025 57209 4101 282 0 95617 1995 37573 47365 5781 336 0 91055 1996 33861 38958 5500 377 0 78696 1997 29661 30222 6706 514 0 67103 1998 20892 29370 5305 446 0 56013 1999 29289 41619 7326 150 0 78384 2000 33696 40407 5464 309 122 79998 2001 31253 32074 5452 645 174 69599 2002 34568 54204 7802 194 195 96963 2003 63101 38258 6334 608 368 108670 2004 63174 37323 6798 77 649 108021 2005 57198 43220 6453 86 184 107140 2006 44495 47640 5573 850 233 98791 2007 32660 30438 6132 305 3 69539 2008 37642 29520 6794 952 10 74919 2009 22195 28690 5761 295 3 56944 2010 22490 20985 3584 29 16 47103 2011 21192 17871 3593 238 0 42894
Table 6: Catch by species made on FAD-associated schools for the French purse seine fishing fleet of the Indian ocean during 1981-2011
Year YFT SKJ BET ALB OTH TOTAL
1981 37 128 20 0 56 240 1982 442 709 131 0 0 1282 1983 3959 6637 1381 0 136 12114 1984 10692 17600 3762 0 191 32244 1985 14623 26582 4993 14 459 46671 1986 15353 31040 4953 0 693 52038 1987 17926 30205 4937 0 20 53089 1988 12763 28633 4675 0 602 46673 1989 13769 26850 4499 0 0 45118 1990 10312 21046 3513 0 31 34902 1991 7895 36252 3048 0 0 47195 1992 11877 38559 2261 8 0 52705 1993 10982 39820 1958 5 0 52765 1994 12122 44944 3329 22 0 60417 1995 17561 38428 4720 16 0 60725 1996 15698 32902 4863 69 0 53532 1997 16963 25966 6406 65 0 49400 1998 11568 24810 4328 12 0 40718 1999 16449 31024 5831 103 0 53407 2000 16050 31939 4150 41 122 52302 2001 8844 26273 3884 108 174 39283 2002 13654 47378 6337 0 171 67540 2003 16810 33837 3429 0 134 54209 2004 13959 31473 4882 0 339 50653 2005 15399 31270 3667 0 184 50520 2006 14074 36207 4042 0 185 54507 2007 11986 23001 4127 3 3 39119 2008 11476 25446 3901 2 10 40835 2009 9936 26710 4226 10 3 40884 2010 10925 19827 2443 4 16 33216 2011 13153 16536 2277 30 0 31997
Table 7: Catch by species made on free-swimming schools for the French purse seine fishing fleet of the Indian ocean during 1981-2011
Year YFT SKJ BET ALB OTH TOTAL
1981 151 31 4 0 0 185 1982 638 83 14 0 0 736 1983 6441 1516 155 0 0 8111 1984 28576 4380 1319 224 37 34537 1985 23083 2601 1484 432 24 27623 1986 25558 7747 1683 200 0 35189 1987 23086 11415 1764 217 23 36505 1988 44003 9461 2575 177 130 56347 1989 19779 18900 1265 6 0 39951 1990 35039 6827 2150 36 0 44052 1991 28702 2378 1169 848 0 33097 1992 31410 5522 319 1336 0 38587 1993 26810 7335 1815 287 0 36247 1994 21903 12265 772 260 0 35200 1995 20012 8937 1061 320 0 30330 1996 18163 6056 637 308 0 25164 1997 12698 4256 300 449 0 17703 1998 9324 4560 977 434 0 15295 1999 12840 10595 1495 47 0 24977 2000 17646 8468 1314 268 0 27696 2001 22409 5801 1568 538 0 30316 2002 20913 6826 1465 194 24 29422 2003 46291 4422 2906 608 235 54461 2004 49215 5850 1916 77 310 57368 2005 41799 11950 2786 86 0 56620 2006 30421 11433 1531 850 48 44283 2007 20675 7438 2005 302 0 30420 2008 26166 4074 2893 950 0 34084 2009 12259 1980 1535 285 0 16059 2010 11565 1157 1140 25 0 13888 2011 8039 1335 1316 208 0 10897