HAL Id: hal-03070723
https://hal.archives-ouvertes.fr/hal-03070723
Submitted on 15 Dec 2020HAL is a multi-disciplinary open access
archive for the deposit and dissemination of sci-entific research documents, whether they are pub-lished or not. The documents may come from teaching and research institutions in France or abroad, or from public or private research centers.
L’archive ouverte pluridisciplinaire HAL, est destinée au dépôt et à la diffusion de documents scientifiques de niveau recherche, publiés ou non, émanant des établissements d’enseignement et de recherche français ou étrangers, des laboratoires publics ou privés.
Depositional environments and historical contamination
as a framework to reconstruct fluvial sedimentary
evolution
Sophia Vauclin, Brice Mourier, André-Marie Dendievel, Nicolas Noclin, Hervé
Piégay, Philippe Marchand, Anaïs Vénisseau, Anne de Vismes, Irène Lefèvre,
Thierry Winiarski
To cite this version:
Sophia Vauclin, Brice Mourier, André-Marie Dendievel, Nicolas Noclin, Hervé Piégay, et al.. Depositional environments and historical contamination as a framework to reconstruct flu-vial sedimentary evolution. Science of the Total Environment, Elsevier, 2021, pp.142900. �10.1016/j.scitotenv.2020.142900�. �hal-03070723�
1
DISCLAIMER : This is a preprint of the paper, i.e. the original version initially submitted to the journal. 1
The final version can be found by following this link : https://doi.org/10.1016/j.scitotenv.2020.142900
2 3
Depositional environments and historical contamination as a
4
framework to reconstruct fluvial sedimentary evolution
5 6
Sophia Vauclin1*, Brice Mourier1, André-Marie Dendievel1, Nicolas Noclin1, Hervé Piégay2, Philippe
7
Marchand3, Anaïs Vénisseau3, Anne de Vismes4, Irène Lefèvre5,& Thierry Winiarski1
8 9
1Univ Lyon, Université Claude Bernard Lyon 1, CNRS, ENTPE, UMR 5023, LEHNA, F-69518, Vaulx-en-Velin,
10
France
11
2Univ Lyon, Université Jean Moulin Lyon 3, CNRS, ENS Lyon, UMR 5600 EVS, F-69342, Lyon Cedex 7, France
12
3ONIRIS, INRAE, LABERCA Route de Gachet-Site de la Chantrerie-CS 50707, Nantes, F-44307, France
13
4LMRE, IRSN, PRP-ENV/STEME/LMRE, F-91400, Orsay, France
14
5LSCE, CEA, UMR8212, F-91198, Gif-sur-Yvette, France
15 16
*Corresponding author: [email protected] 17
Abstract:
18In this study, we explore the variability of sedimentation conditions (grain-size, accumulation rate, 19
contamination, etc.) according to fluvial depositional environments. Indeed, sediment cores are 20
commonly used as archives of natural and anthropogenic activities in hydrosystems, but their 21
interpretation is often complex, especially in a fluvial context where many factors may affect the 22
quality, continuity, and resolution of the record. It is therefore critical to thoroughly understand the 23
nature and dynamics of an environment in which a sediment core is sampled to be able to interpret it. 24
To that end, four depositional environments from a bypassed reach of the Rhône River were 25
comparatively investigated through geophysical methods in order to assess the range of sedimentation 26
2
conditions: a floodplain, a semi-active secondary channel, an active secondary channel, and a dam 27
reservoir. Sediment cores were retrieved from each environment and thoroughly characterized (grain-28
size, Total Organic Carbon, organic contaminants, etc.). Robust age-depth models were elaborated for 29
each of them based on 137Cs, 210Pb, and Persistent Organic Pollutants (POPs) trends. The results show
30
that each depositional environment recorded a different time-period, and therefore different 31
contamination levels and trends. In particular, a shift from polychlorinated biphenyls (PCBs) to 32
polybrominated diphenyl ethers (PBDEs) as the predominant POP in the sediments can be observed, 33
the tipping point being set in the 1970s. Two types of infrastructure-induced legacy sediments related 34
to two periods of river engineering in the reach were also identified using grain-size analysis. The 35
combination of geophysical methods and sediment cores is therefore confirmed as a relevant 36
methodology that should be promoted in fluvial contexts in order to reconstruct the sedimentary 37
evolution of fluvial corridors. The study also highlights the challenges of dating recent fluvial sediments 38
and proposes a multi-proxy dating methodology using POPs contamination trends. 39
Keywords:
Age-depth model; depositional environment; natural archive; polybrominated 40diphenyl ethers; polychlorinated biphenyls; sediment core. 41
1. Introduction
42Monitoring the signals -anthropogenic or natural – that sediments record may provide invaluable 43
information to understand the long and short-term evolution of a hydrosystem. Indeed, numerous 44
studies have shown that sediments may be used as archives of meteorological events (e.g. storms: 45
Vliet-Lanoe et al., 2014; Pouzet and Maanan, 2020, floods: Jones et al., 2012; Toonen et al., 2015), 46
historical contamination (e.g. Bigus et al., 2014, Dendievel et al., 2020) or other anthropogenic impacts 47
such as pre-historic gullying (Dotterweich, 2005; Vanwalleghem et al., 2006), agriculture intensification 48
(Brooks and Brierley, 1997; Fuller et al., 2015) or river manipulations (Surian and Rinaldi, 2003; Vauclin 49
et al., 2019). The diversity of anthropogenic disturbances potentially recorded in sediments even led 50
3
to the establishment of the term “legacy sediments” to refer to sediments resulting from past or 51
contemporary human activities such as land-use, contamination (Walter and Merritts, 2008; James, 52
2013; Wohl, 2015) or river engineering (Vauclin et al., 2020). However, in order to use wisely the 53
information contained in sediment deposits, it is critical to understand their recording ability 54
depending on their geographical and geomorphological context. Factors such as connectivity of the 55
environment and sediment accumulation rate, for example, will affect the continuity and precision of 56
the record, while sediment characteristics such as grain-size or organic carbon content will specifically 57
affect contamination chronicles (Karickhoff et al., 1979). Some environments such as lakes allow 58
continuous and regular sedimentation. Sediments deposited in such contexts are therefore reliable 59
and lasting archives that tend to be preferentially used to study local or atmospheric contamination 60
trends, anthropogenic activities in the upstream catchment (Guzzella et al., 2008; Guédron et al., 2016) 61
or long-term climatic or environmental changes (Simonneau et al., 2013; Zolitschka et al., 2013). In 62
contrast, there is usually a large diversity of depositional environments in fluvial contexts (e.g. 63
floodplains, oxbow lakes, secondary channels, paleochannels, weir ponds, groyne fields, locks, etc.). 64
Those environments may have various levels of connectivity and therefore various recording capacities 65
(Dhivert et al., 2015) and temporalities, making the interpretation of sedimentary archives challenging. 66
When implemented, river engineering may also profoundly reshape the natural depositional 67
environments and alter their sedimentation processes. Additionally, sediment accumulation rates in a 68
fluvial context are often dependent on hydrological events: sustained low-water conditions might 69
result in a decreased or non-existent sedimentation, while a flood might bring a dozen centimetres of 70
sediments in the span of a few hours or remobilize previously settled sediments, generating 71
discontinuous archives. The dating of fluvial sediments is therefore key for a relevant interpretation of 72
a sedimentary sequence, but might also prove challenging, as classic methods such as 210Pb or 137Cs
73
might not give satisfying results due to the continuity issues previously mentioned. 74
In that light, investigating the various fluvial compartments appears as essential for any retrospective 75
approach implemented from fluvial sediments. It is the only way to potentially reconstruct the entire 76
4
timeline of a river, where individual sediment sequences are inherently incomplete due to the 77
changing nature of fluvial systems. It might also allow to establish links between sediments and their 78
deposition processes, and identify sediment sequences resulting from changes in fluvial systems. It is 79
especially important as rivers are characterized by complex sedimentary dynamics that are often 80
further segmented by anthropogenic modification of their morphology and functioning. However, 81
when suitably interpreted, sedimentary sequences may allow to reconstruct the evolution of a river 82
corridor in correlation with the anthropogenic pressures it was subject to throughout time. Such an 83
understanding is essential to implement relevant restoration measures and mitigate further 84
anthropogenic impact on the river system (Wohl et al., 2005; Arnaud et al., 2015; Słowik, 2015; 85
Eschbach et al., 2018). 86
The aims of this study are: 87
- to highlight the temporal and qualitative variability of fluvial sediment records –especially 88
regarding contaminant chronicles– depending on their depositional environment, 89
- to use these findings to reconstruct the sedimentary evolution of a large river, 90
- overall, to propose a robust methodology for the use of fluvial sediment deposits as records 91
of natural or anthropogenic disturbances in an actively changing fluvial system. 92
To this end, four distinct depositional environments from a 12km-long heavily anthropized reach of 93
the Rhône River (France) are investigated in a comparative approach. Their dynamics and the 94
chronology of their records are assessed and compared through a combination of geophysical surveys 95
5
and dated sediment cores in order to describe the diversity of sedimentary records and reconstitute 96
the trajectory of this actively adjusting fluvial area. 97
2. Material and methods
982.1.
Study area
99The Rhône River is an 812 km-long river that flows from the Furka Glacier in Switzerland to the 100
Mediterranean Sea in France (Fig. 1.a.). Its catchment covers 98 500 km² -of which 90 500 km² are in 101
France- and its average inter-annual discharge is approximately 1 700 m3 s-1 at the estuary. It has a long
102
history of human influence and the earliest traces of agriculture along the river date back to around 7 103
500 years ago (Berger et al. 2019). As most major rivers in Europe, the Rhône is highly engineered, with 104
numerous dikes, groynes and 19 dams along its French course. Those infrastructures have impacted 105
the river in many ways: increased transport capacity, reduced sediment load, channel armouring, 106
narrowing and incision, increased slope, increased trapping efficiency, etc. (Petit et al., 1996; Bravard 107
et al., 1999; Arnaud-Fassetta, 2003; Parrot, 2015; Tena et al., 2020). 108
The study area (known as PDR for « Péage-de-Roussillon ») is located 50 km downstream from the 109
metropolitan city of Lyon (Fig. 1.a). It consists of a 12 km-long reach with a bypass configuration typical 110
of the Rhône River: the historical main channel is closed by an upstream run-of-river dam and bypassed 111
by an artificial canal (Fig. 1.b). The area has undergone two phases of engineering in the last 200 years. 112
River training and flood protection infrastructures were implemented from the mid-19th century to 113
the early 20th century: non-submersible dikes were built on the floodplain, and submersible dikes and 114
groynes were implemented in the river in order to cut secondary arms and straighten the main 115
channel. From 1974 to 1978, the area was heavily modified to produce hydroelectricity: an 11 km-long 116
canal was dug out in parallel to the existing one and equipped with a lock and a power plant, and the 117
historical channel was closed with a run-of-river dam to divert most of the discharge in the canal. As a 118
result, only a minimum instream flow of 50 to 125 m3/s is maintained nowadays in the bypassed
119
channel (GRAIE, 2016), while the inter-annual discharge upstream of the area is 1080 m3 s-1. The
6
historical channel is still used to accommodate flood flows that exceed the maximum discharge 121
processed by the hydropower plant (1600 m3 s-1).
122
123
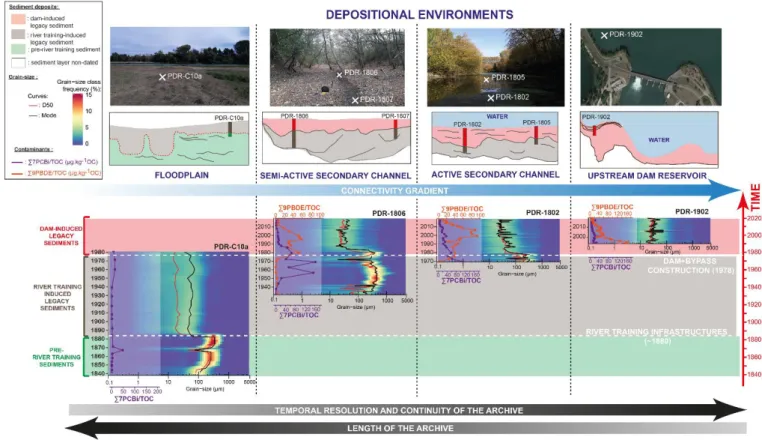
Figure 1: a. Location of the study area along the Rhône River; b. Overview of the study area and its river infrastructures (NB: 124
core PDR-C10a has been previously published in Vauclin et al., 2019); c. Study site: Saint-Pïerre-de-Boeuf dam reservoir; d. 125
Study site: Limony secondary channel; e. Study site: Ilon secondary channel. [IN COLOR]
126
Inside this area, four fluvial compartments were chosen in an attempt to characterize and compare 127
four distinct types of depositional environments. The selected study sites exhibit different hydro-128
sedimentary dynamics which have been created or impacted by various periods and types of river 129
engineering, as shown in a planimetric analysis of the area published in Tena et al. (2020). 130
- The Saint-Pierre-de-Boeuf dam reservoir is a recent compartment as it was built in 1978 131
upstream of the bypassed section (Fig. 1.b). It is a run-of-river installation, therefore most 132
7
sediments flow through the dam, especially during flooding. However, a recess zone along the 133
right bank allows sediment accumulation (Fig. 1.c). 134
- The Ilon secondary channel (Fig. 1.e) was part of a major arm of the Rhône River until the 135
implementation of river training structures in the 1880s, when it became less connected as 136
both its inflow and outflow were barred by submersible dikes and groynes (Vauclin et al., 2019; 137
Tena et al., 2020). In the 1950s, the Ilon secondary channel had lost in width but both its ends 138
were still linked to a secondary arm of the main stream. Following the bypass implementation 139
in 1978, the upstream entrance got disconnected and the channel is now supplied by its 140
downstream end only but still underwater all year-long. It is further referred to as an active 141
secondary channel. 142
- The Limony secondary channel (Fig. 1.d) used to be an active arm of the river prior to the first 143
engineering phase. Both its entrance and outflow were then closed by submersible dykes in 144
the 1880s and it quickly became disconnected from the main channel (Vauclin et al., 2019; 145
Tena et al., 2020). Nowadays, it is mostly supplied by groundwater and flooded by the river 146
several times a year. It is further referred to as a semi-active secondary channel. 147
- An overbank floodplain location that used to be flooded regularly prior to the bypass 148
implementation but is entirely disconnected from the river since the 1980s (Vauclin et al., 149
2019). Note that part of the results from this site have already been published (Vauclin et al., 150
2019; Vauclin et al., 2020) but are used in this study for a broader comparison of different 151
depositional environments. 152
2.2.
Bathymetric and geophysical analysis
153Bathymetric surveys measured along a transect from the Saint-Pierre-de-Boeuf dam reservoir on which 154
a sediment core is located (Fig. 1.c) were provided by the CNR (Compagnie Nationale du Rhône; 155
company in charge of the river management). They were available for six dates: 1980, 1999, 2004, 156
2008, 2012 and 2018, and allowed to reconstruct the progressive filling of the reservoir with 157
sediments. 158
8
Ground Penetrating Radar (GPR) is a non-invasive geophysical method used to obtain a high-resolution 159
image of shallow subsurface structures (Davis and Annan, 1989). It is based on the generation and 160
propagation of discrete pulses of high frequency (MHz) electromagnetic energy through the 161
sediments. It allows the assessment of subsurface spatial structures up to a depth of 10–20 m over 162
extended areas (Huggenberger et al., 1994; Beres et al., 1999) with a resolution ranging between 10 163
cm and 1 m (Jol, 1995). It can be used on the ground (GPR) or on shallow water bodies (1 to 2 meters 164
of water depth) where it is then referred to as Water Ground Penetrating Radar (WGPR: Annan et 165
Davis, 1977). 166
A 500 m-long GPR survey (GPR10) was acquired on the floodplain site in 2016. Three GPR profiles were 167
acquired on the active secondary channel (GPR12, GPR13, and GPR14; 160 m, 22 m, and 25 m 168
respectively; only) in October 2018 (Fig. 1.e). The GPR was used in WGPR configuration from a small 169
boat as there was a water depth of 60 to 70 cm in the channel at the time. Three GPR profiles were 170
acquired on the semi-active secondary channel (GPR20, GPR21, and GPR22; 55 m, 18 m, and 20 m 171
respectively) in October 2018 as well (Fig. 1.d). The measurements were made directly on the ground 172
as there was no water in the channel at the time. On the floodplain, one 500 m-long survey was 173
acquired in 2016 (GPR10). All GPR surveys were carried out with the GSSI SIR 3000 system (Geophysical 174
Survey System Inc., Salem, USA), operated with a shielded antenna at a central frequency of 400 MHz, 175
running in monostatic mode. In addition, a topographic survey using a GPS Trimble station was 176
performed to localize the surveys. Velocities of 0.11 m ns-1 (measured by a common mid-point
177
procedure) and 0.076 m ns-1 (from Lin et al., 2009) were used for the terrestrial and aquatic surveys
178
respectively, in order to calibrate the profile depths. The data processing was performed using the GSSI 179
Radan 7 software. 180
9
2.3.
Sediment characteristics
1812.3.1. Core sampling
182
The core sampling locations were chosen after a quick on-site analysis of the geophysical surveys so 183
that the cores would cross interesting sedimentary structures. Two underwater cores (PDR-1901 and 184
PDR-1902) of 72 and 104 cm respectively were retrieved from the dam reservoir in July 2019 with an 185
UWITEC® corer (Uwitec, Mondsee, Austria) fitted with a 2 m-long and 90 mm-diameter plastic liner. 186
Two underwater cores (PDR-1802 and PDR-1805) of 94 and 57 cm respectively were sampled from a 187
small boat in the active secondary channel (Fig. 1.e) in October 2018 with the same corer. Three 188
terrestrial cores (PDR-1806a, PDR-1806b and PDR-1807) of 82, 74.5 and 78.6 cm respectively were 189
retrieved from the Limony secondary channel in dewatered state with a Cobra TT percussion driller in 190
October 2018. Cores PDR-1806b was drilled 1 m apart from PDR-1806a in a 60 cm-deep pit, in order 191
to combine the two cores; the resulting mastercore (PDR-1806) is 108 cm-long. A 111 cm-long core 192
(PDR-C10a) was sampled from the floodplain site in 2016 with the same Cobra TT percussion driller. 193
The detailed characteristics of the studied sediment cores are summarized in Table S1. 194
2.3.2. Grain-size characteristics
195
Grain-size was measured on all cores every 0.5 to 1 cm with a Mastersizer 2000© (Malvern Panalytical) 196
particle size analyzer mounted with a hydro SM small volume dispersion unit. Descriptive grain-size 197
statistics (D50, mode, D10, D90, skewness, etc.) were computed with the Gradistat software (Blott and 198
Pye, 2001). To represent the grain-size distributions (GSD) as extensively as possible, heatmaps of each 199
core were plotted; for each measured sample, the percentage of each grain-size class is represented 200
by a colour scale. Unmixing of the sets of grain-size distributions was carried out on all sediment cores 201
simultaneously through end-member modelling analysis (EMMA) with the R package EMMAgeo 202
(Dietze et al., 2012). EMMA is a compositional method based on the assumption that any GSD is a 203
mixture of sediment populations corresponding to different mechanisms of production and/or 204
transport (Weltje and Prins, 2003; Toonen et al., 2015; Dietze et al., 2016). A linear mixing model is 205
therefore applied to an array of GSDs and allows to identify meaningful end-members that correspond 206
10
to the most representative populations of the GSDs (Weltje and Prins, 2007). The end-member scores 207
(percentage of representation of the different end-members) were plotted as a function of the depth 208
for each core. 209
2.3.3. Geochemical and contaminants analyses
210
Rock-eval pyrolysis was used to analyze several organic carbon-associated parameters of the 211
sediments, such as the total organic carbon (TOC). The analyses were carried out at the ISTO laboratory 212
(Orléans, France) with a 4 cm step on cores PDR-C10a, PDR-1802, PDR-1806, and PDR-1902. 213
Polychlorinated biphenyls (PCBs) and polybrominated diphenyl ethers (PBDEs) were analyzed. PCBs 214
were chosen as they are well-studied POPs whose temporal trends are reasonably well-known in the 215
Rhône River (e.g. Desmet et al., 2012, Mourier et al., 2014, Dendievel et al., 2020). Meanwhile, PBDEs 216
are emerging POPs that have been little studied in the Rhône, which brings a novelty factor. Besides, 217
works from other hydrosystems (Nylund et al., 1992, Zegers et al., 2003, Muir and Rose, 2007) suggest 218
that they have consistent and more contemporary temporal trends, meaning that they could 219
potentially be used as a time-marker for recent sediment records. 220
The following organic contaminants were quantified in the LABERCA laboratory (ONIRIS Nantes, 221
France): 222
- The seven indicator PCB congeners: PCB 28, 52, 101, 118, 138, 153, 180, of which the sum is 223
further referred to as ∑7PCBi on cores PDR-1902, PDR-1802, PDR-1806 and PDR-C10a; 224
- Nine PBDE congeners: PBDE 28, 47, 49, 99, 100, 153, 154, 183, and 209, of which the sum is 225
further referred to as ∑9PBDE on cores PDR-1902, PDR-1802 and PDR-1806; 226
The samples were collected at a step of 4 cm, packaged in amber glass vials and then sent to the 227
LABERCA laboratory for further analysis. After freeze-drying, extraction and purification procedures, 228
all persistent organic pollutants (POPs) analyses were simultaneously carried out by gas 229
chromatography coupled with high-resolution mass spectrometry (GC/HRMS) using a 7890A gas 230
chromatograph (Agilent) coupled with a JMS 800D double-sector high-resolution mass spectrometer 231
11
(JEOL, Tokyo, Japan). The quantification was ensured by isotopic dilution using 7 13C-labeled internal
232
PCB standards and 9 13C-labeled internal PBDE standards added to the samples before the extraction
233
step. A thorough description of the analysis protocol can be found in Vénisseau et al. (2015) and Liber 234
et al. (2019). The limits of detection (LOD) for PCBs range from 0.049 (PCB 118) to 0.109 (PCB 28) 235
μg·kg−1 DW and for PBDEs from 0.002 (PBDE 28) to 0.05 (PBDE 183) μg·kg−1 DW. The recoveries range
236
from 60 to 120%. 237
2.3.4. Sediment dating
238
Cesium-137 (137Cs) was assessed on cores PDR-1802, PDR-1806, PDR-1902 and PDR-C10a. This
239
anthropogenic radionuclide is typically used to identify two events that appear as peaks in the 240
radionuclide activity: nuclear weapon testing in 1962-1963 (Ritchie and McHenry, 1990) and the 241
Chernobyl accident in 1986. Additionally, excess lead-210 (210Pb
xs) activity was assessed on core
PDR-242
1902 only. 210Pb is a natural radionuclide that is part of the uranium-238 radioactive decay series and
243
is continually supplied to sediments from atmospheric deposition. Excess 210Pb radioactive decay can
244
be used to model sediment accumulation rate in a sediment core –and by extension, date it- assuming 245
that the sediments have not been subjected to large scale disturbances (Baskaran et al., 2014). We 246
assumed that there was neither mixing nor diffusion of 210Pb
xs in the core and therefore used the
247
Constant Flux Constant Sedimentation model in this study (Krishnaswamy et al., 1971; Bruel and 248
Sabatier, 2020). 249
Samples were collected at steps of 4 to 8 cm, dried for 48h at 40°C and preserved in polystyrene boxes. 250
Sub-samples from each core were analyzed by counting for at least 24h, using low-background gamma 251
spectrometry. Gamma emissions were detected with a germanium detector and used to quantify 252
specific activities of 226Ra, 228Ra, 40K, 210Pb, and 137Cs. Those analyses were carried out in the LMRE
253
laboratory (Laboratoire de Métrologie de la Radioactivité dans l’Environnement, IRSN, Orsay) for cores 254
PDR-C10a, PDR-1802 and PDR-1806, and in the LSCE laboratory (Laboratoire des Sciences du Climat et 255
de l’Environnement, Gif-sur-Yvette, France) for core PDR-1902. The mean detection limit is 0.1 Bq. 256
12
Age-depth modelling was carried out on cores PDR-1802, PDR-1806, PDR-1902 and PDR-C10a using 257
the R package “clam” (Classical Age-Depth Modelling of Cores from Deposits) v.2.3.4 (Blaauw, 2010). 258
Two models were developed: 259
- Model M1 uses only the most robust time-markers i.e. the surface (date of sampling), 137Cs or
260
210Pb trends and abrupt grain-size events associated with dated hydrological or human-driven
261
events. 262
- Model M2 uses the time-markers from model M1 as well as additional time-markers linked to 263
PCB and PBDE trends (e.g. date of early use of a contaminant, date of restriction of use, date 264
of ban, etc.). 265
The point in developing those two models was to assess whether contaminant trends can be used as 266
reliable time-markers in this context and whether they might allow to increase the dating accuracy. 267
The model type (e.g. linear regression, linear interpolation, etc.) was chosen for each core as to obtain 268
the best possible goodness of fit. The model type and parameter inputs for each model are available 269
in Supplementary Information (Table S2). 270
3. Results
2713.1.
Physical characteristics of the depositional environments
272The bathymetric measurements of a transect of the Saint-Pierre-de-Boeuf dam reservoir over time are 273
featured in Supplementary Information (Fig. S1). They show the progressive filling of the recess zone 274
on the right bank side (between roughly 100 and 300 m). In 1980 (two years after the dam 275
implementation in 1978), the old channel could still be distinguished around 150-200 m. The major 276
part of the filling (up to 6.5 m of sediments deposited) happened between 1980 and 1999. Since 1999, 277
up to one additional metre accumulated in the recess zone. Core PDR-1902 was sampled in this zone, 278
around 150 m on the measured transect. Its compaction rate could not be measured and therefore 279
had to be assumed; based on previous underwater cores, a 30% rate was used for the representation 280
13
in Fig. S1. The high uncertainty associated with the compaction rate of core PDR-1902 means that the 281
bathymetric measurements cannot be used as absolute time-markers. However, they still suggest that 282
the bottom of the core is older than 1999. 283
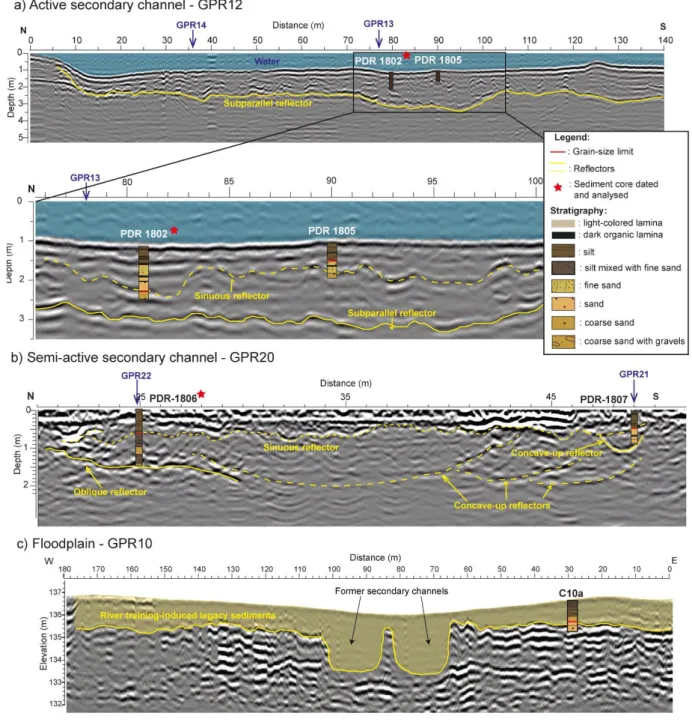
The Ilon (active) secondary channel is approximately 20 m large, 300 m long and with a water depth 284
depending on the season but generally around 1 m. The longitudinal survey GPR12 (Fig. 2.a) shows 285
that more than 5 m of sediments accumulated in the channel overtime. A continuous subparallel 286
reflector can be observed along the whole profile around 2-2.5 m. It might correspond to the original 287
gravel bed of the channel (before 1860, cf. section 2.1). The filling above this reflector is rather 288
homogeneous with mostly subparallel and sinuous reflectors, indicating a continuous deposition with 289
little to no reworking. A close-up on the part of the transect where the sediment cores are located 290
allows to distinguish a continuous sinuous reflector that matches with a grain-size limit observed in 291
sediment cores PDR-1802 and PDR-1805 (see section 3.2 for more details), proving the consistency 292
between GPR observations and the results from the core sampling. The survey shows that although 293
one core is 94 cm-long while the other is 57 cm-long, they deposited roughly in the same time span, 294
meaning sediment accumulation rates may vary a lot inside this compartment. This variability is 295
inherent to fluvial sediment deposition and has to be considered for a correct interpretation of 296
sediment records, which demonstrates the interest of combining sediment cores with geophysical 297
surveys. 298
14 299
Figure 2: Interpreted Ground Penetrating Radar surveys with sediment cores positioned; a) GPR12 from the active secondary 300
channel; b) GPR20 from the semi-active secondary channel; c) GPR10 from the floodplain. NB: Other transversal GPR surveys 301
for the active secondary channel (GPR21, GPR22) and the semi-active secondary channel (GPR13, GPR14) are available in 302
Supplementary Information (Fig. S2). [IN COLOR]
303
The Limony secondary channel is approximately 20 m-large and 1 km-long, although the geophysical 304
surveys and sediment cores are only located in the last 200 m downstream of the channel (Fig. 1.d). 305
The longitudinal transect GPR20 (Fig. 2.b) shows multiple oblique and concave-up reflectors between 306
depths of 0.5 and 2 m. They may be the result of strong and multiple erosion dynamics, indicating that 307
15
the channel used to have an important bed mobility. The bottoms of both sediment cores (PDR-1806 308
and PDR-1807) match with reflectors, which shows again the consistency between the two methods. 309
Around 50 cm, a rather continuous and sinuous reflector can be identified all along the survey. The 310
sediment filling above this reflector is more homogeneous, hinting at calmer depositional processes. 311
GPR12 from the floodplain compartment is roughly perpendicular to the Rhône main channel axis. A 312
very clear continuous reflector can be observed all along the survey (Fig. 2.c), outlining two former 313
secondary channels that have been entirely filled in and are not discernible nowadays from the surface. 314
Other subparallel reflectors are apparent below the continuous reflector while the GPR image is 315
smooth above: this filling is characteristic of legacy sediments induced by the implementation of river 316
training infrastructures in the 1880s in the area, as demonstrated in Vauclin et al. (2020). The 317
continuous reflector also coincides with a grain-size limit observed in the corresponding sediment core 318
(PDR-C10a). 319
3.2.
Grain-size characteristics of the sediment cores
320The cores from the dam reservoir (PDR-1901 and PDR-1902) are almost exclusively comprised of silt, 321
with only a few centimetres of very fine sand at their bottom. At their opening, they exhibited organic 322
macro-remains and dark organic laminas, as well as a few light-coloured laminas. The cores retrieved 323
in secondary channels (PDR-1802, PDR-1805, PDR-1806, PDR-1807) have a similar stratigraphic 324
description: an upward fining pattern of coarse sand, fine sand and silt from the bottom to the top of 325
the cores (Fig. 3). They also had many noticeable organic macro-remains (leaves, seeds, shells, etc.) 326
and several darker laminas. The core from the floodplain (PDR-C10a) is characterized by silty deposits 327
in its top 75 cm and sands at the bottom. 328
The grain-size heatmaps (Fig. 3) from the cores from the dam reservoir highlight a very homogeneous 329
grain-size distribution, only comprised of fine (D50~20 µm) and poorly sorted sediments. In contrast, 330
two main sections can be distinguished in the cores from the active channel: the top sediments are 331
fine (D50~20-50 µm) and poorly classified (i.e. the distribution is widely spread around the D50), while 332
16
the sediments at the bottom of the cores are coarser (D50~200 µm) and well-sorted (i.e. the 333
distribution is closely centred around the D50). This change in grain-size characteristics can be 334
observed at 80 cm and 42 cm on PDR-1802 and PDR-1805 respectively (Fig. 3). A similar grain-size limit 335
can be identified on the heatmaps of the cores from the semi-active secondary channel, at 48 and 40 336
cm in cores PDR-1806 and PDR-1807 respectively. The transition between the two grain-size patterns 337
is sharp and is represented as a dotted red line on Fig. 3. A similar distinction between the top (fine, 338
poorly sorted sediments) and the bottom (coarser, well-sorted sediments) can be observed in core 339
PDR-C10a from the floodplain environment. The corresponding grain-size limit has already been 340
analysed in Vauclin et al. (2019) and has been identified as the result of the implementation of river 341
training infrastructures in the 1880s. 342
17 343
18
Figure 3: Grain-size characteristics for the seven studied sediment cores in a) the dam reservoir, b) the active secondary 344
channel (Ilon), c) the semi-active secondary channel (Limony), and d) the floodplain. For each core, from left to right: 345
stratigraphic description, heatmap representation of the total grain-size repartition and End-Member scores. [IN COLOR]
346
The End-Member Modelling Analysis (EMMA) algorithm (Dietze et al., 2012) showed that the corpus 347
of grain-size distributions (GSDs) was best represented with two end-members (EM). The main modes 348
are at 26 and 320 µm and represent each around 50% of the grain-size distributions (Fig. 3). This end-349
member model has a class-wise explained variance of 52% and a sample-wise explained variance of 350
93%. 351
The end-member scores –i.e. their percentage of representation of the GSDs- vary depending on the 352
sediment core and the depth of the sample (Fig. 3). In the reservoir cores (PDR-1901 and PDR-1902) 353
and in the top part of the 5 other cores, EM1 is largely predominant, which is consistent with the fine 354
homogeneous sediments observed in the stratigraphic descriptions and heatmaps. Below the grain-355
size limit, EM2 is mostly represented which corresponds to the observed sandy sediments. The grain-356
size limit identified in the heatmaps can be clearly seen on the end-member score graphs as well. It 357
appears as an abrupt change in the EMs repartition and supports the observation that there is a sudden 358
change in the grain-size properties that can be consistently observed all sediment cores except those 359
from the dam reservoir, and might therefore be linked to river engineering. While this limit was initially 360
derived from visual observations and grain-size data, the fact that it also appears in the EM score 361
graphs gives it a statistical weight. Overall, the end-member modelling attests of the existence of two 362
distinct deposition processes in the studied cores: EM1 is likely representative of a decantation process 363
in a context of still waters, while EM2 might represent former dynamics of deposition from when the 364
fluvial corridor was not constrained by the various engineering works. 365
19
3.3.
Vertical trends in the geochemical characteristics of the sediments
3663.3.1. Vertical trends in Total Organic Carbon
367
The Total Organic Carbon (TOC) contents in the cores (Fig. 4) are comprised between 0 and 5%. The 368
vertical trend in TOC in PDR-1902 (dam reservoir, Fig. 4.a) is monotonous at around 2%. In PDR-1802, 369
the TOC is low (<1%) before the grain-size rupture (active secondary channel, Fig. 4.b), then increases 370
up to 3% at 55 cm, before falling back at ~2% until the surface. In PDR-1806 (semi-active channel, Fig. 371
4.c), the TOC content is null in the bottom of the core until ~50 cm from the top. It then increases up 372
to 4-5% close to the surface. In PDR-C10a (floodplain, Fig. 4.d), the TOC is almost null below 75 cm, 373
increases slowly towards the surface, and then more sharply in the last ten centimeters. It is worth 374
noting that the increase in TOC systematically coincides with the grain-size ruptures identified 375
previously (red dotted line in Fig. 4) in all cores. 376
3.3.2. Vertical trends in persistent organic pollutants
377
In core PDR-1902 (dam reservoir, Fig. 4.a), the Σ7PCBi concentration follows a decreasing trend from 378
the bottom (~40 µg kg-1) to the top (~10-20 µg kg-1). Two sharp peaks can however be observed at 78
379
cm (120 µg kg-1) and 12 cm (40 µg kg-1). The Σ9PBDE concentration starts around 200 µg kg-1 at the very
380
bottom of the core, peaks at ~400 µg kg-1 at 96 cm and then decreases steadily from 200 µg kg-1 at 90
381
cm to ~20 µg kg-1 close to the surface. The TOC normalization does not significantly modify the
382
observed trends in this core. 383
In core PDR-1802 (active secondary channel, Fig. 4.b), the Σ7PCBi concentration is around 80 µg.kg-1 at
384
the very bottom of the core and fluctuates between ~40 and 90 µg kg-1 until 50 cm. It then decreases
385
steadily to reach a stable value of 20 µg kg-1 close to the surface. When normalizing the Σ7PCBi
386
concentration to the TOC (in order to remove a potential confounding effect due to the affinity of 387
persistent organic pollutants for organic matter), the trend is significantly modified: we observe an 388
exponential decrease in Σ7PCBi/TOC from the bottom of the core to the surface. The Σ9PBDE 389
concentration is null at the very bottom but increases rapidly and peaks at ~250 µg kg-1 around 50 cm.
20
It decreases then steadily to reach ~25 µg kg-1 at the surface. The TOC normalization does not change
391
significantly the overall vertical trend observed for PBDEs. 392
21 393
22
Figure 4: Vertical trends in geochemical characteristics in cores a) PDR-1902; b) PDR-1806; c) PDR-1802; d) PDR-C10a. For 394
each core, the following characteristics are presented from left to right: Total Organic Carbon (TOC) content, D50, sum of the 395
7 indicator PCBi, sum of 9 PBDE, 137Cs activity. For organic contaminants, the darkest curve represents the raw concentrations 396
while the lightest curve represents the concentrations normalized to the TOC. NB: the sum of 9PBDE was not measured in core 397
PDR-C10a. [IN COLOR]
398
The Σ7PCBi concentration is null in the bottom part of core PDR-1806 (semi-active channel, Fig. 4.c) 399
but increases quickly starting at 80 cm from the surface. It peaks at a value of ~100 µg kg-1 at 44 cm,
400
then decreases steadily to reach a background value of ~5-10 µg kg-1 close to the surface. When
401
normalizing the Σ7PCBi concentration to the TOC, the vertical trend is significantly modified: the 402
increase is sharper starting at 80 cm, and the peak happens lower in the core, between roughly 55 and 403
70 cm. From 55 cm to the surface, an exponential decrease is then observed. In this core, the Σ9PBDE 404
concentration is null between the bottom of the core and ~50 cm from the surface. We can then 405
observe a sharp increase in concentration until ~140 µg kg-1 around 20-30 cm. Starting at 20 cm, the
406
concentration decreases rapidly until 20-30 µg kg-1 close to the surface. The TOC normalization does
407
not significantly impact the PBDEs vertical trend. 408
In core PDR-C10a (floodplain, Fig. 4.d), the Σ7PCBi concentration is null in the bottom part of the core. 409
The first measured concentration is ~12 µg kg-1 around 18 cm, and the contamination levels then stay
410
similar until the surface. The TOC normalization shows that the contamination is minimal compared to 411
the other cores but does not modify the tendency. 412
It is worth specifying that the congener repartition for PCBs and PBDEs is similar in all three cores and 413
does not vary significantly with depth. The highly chlorinated PCB congeners (PCB-414
138/PCB153/PCB180) are predominant, generally representing between 60 and 80% of the Σ7PCBi. 415
Meanwhile, congener 209 (BDE-209, the main component of the deca-BDE commercial mixture) 416
represents between 93 and 99% of the Σ9PBDE measured in the samples and was therefore mainly 417
considered in further interpretations. 418
3.3.3. Radionuclides activity trends
23
The 137Cs activity profile for core PDR-1902 (dam reservoir, Fig. 4.a) is monotonous and comprised of
420
background values between 5 and 10 Bq kg-1. No activity peak is observed. The 210Pb
xs activity profile
421
globally decreases from ~120 Bq kg-1 at the top to 40-60 Bq kg-1 at the bottom of the core. While a few
422
measure points slightly deviate from that decreasing trend (e.g. at 20 cm), all were nevertheless taken 423
into account for the modelling. 424
In core PDR-1802 (active secondary channel, Fig. 4.b), the 137Cs activity is around 20 Bq kg-1 at the very
425
bottom of the core and decreases onto the last 8 cm. This declining trend hints at the existence of an 426
earlier peak that was not recorded in the core. The activity then increases to peak at 25 Bq kg-1 around
427
76 cm. Afterwards, it decreases quickly between 44 and 78 cm, and more progressively between 44 428
cm and the surface, where the activity stalls around 5 Bq kg-1.
429
The 137Cs activity in core PDR-1806 (semi-active secondary channel, Fig. 4.c) is null from the bottom of
430
the core to 80 cm from the surface, then very low (<5 Bq kg-1) until 58 cm. We can then observe two
431
activity peaks of different intensities: a 6 Bq kg-1 peak at 52 cm, followed by a temporary decrease and
432
more straightforward peak of 35 Bq kg-1 at 44 cm. Above this second peak, the 137Cs activity decreases
433
overall to reach 10 Bq.kg-1 at the surface, although a slight increasing trend can be observed again
434
between 12 and 25 cm. 435
In core PDR-C10a (floodplain, Fig. 4.d), 137Cs activity is null in the bottom of the core and increases from
436
20 cm onwards. It starts at around 5 Bq kg-1 and reaches 20 Bq kg-1 close to the surface.
437
3.4.
Age-depth modelling
4383.4.1. Date markers
439The grain-size change identified in cores from the secondary channels (PDR-1802 and PDR-1806; cf. 440
section 3.3) and the floodplain (PDR-C10a) can be used as a date marker. Indeed, a similar change has 441
already been observed in sediment cores from the Rhône floodplain, in this study area and two other 442
sites along the river corridor (Vauclin et al., 2019; Vauclin et al., 2020). In those cases, it was proven 443
24
that the abrupt grain-size modification was due to the first period of river engineering (~1880) that 444
created a partial disconnection between the channel and the floodplain, and sediments above the limit 445
were therefore defined as infrastructure-induced legacy sediments. This mechanism is illustrated here 446
in the floodplain core (PDR-C10a). In the cores from the secondary channels, however, the grain-size 447
change is located just below 137Cs activity peaks and therefore has to be more contemporary than the
448
1880s. We therefore concluded that it was caused by the second period of river engineering (bypass 449
implementation) in 1978. As a consequence, we considered that the 137Cs activity peaks in cores
PDR-450
1802 and PDR-1806 were the result of the 1986 Tchernobyl accident since both are located above the 451
1978 grain-size limit. 452
Tipping points in organic contaminants trends were used as secondary date markers in models M2 (in 453
addition to absolute date-markers, cf. section 2.3.4), based on production/consumption temporal data 454
or already published dated contamination trends from other sedimentary archives. Standard errors 455
were associated with POPs time-markers to take into account the lag time between the legislation, its 456
implementation at the national scale and the time needed to record a decrease in the sediment record 457
(Table S2). All date markers used in this study and their justification and/or reference are available in 458
Table 1. 459
Date marker Date Sediment cores Reference/explanation
Absolutedate markers
137Cs activity peak 1986 PDR-1806, PDR-1802 See section 3.5.1 Grain-size change 1978 PDR-1806, PDR-1802 See section 3.5.1
Secondary date markers
PCB
concentration increase
1950 PDR-1806 Breivik et al., 2002b; Desmet et al., 2012; Lorgeoux et al., 2016; Dendievel et al., 2020
25
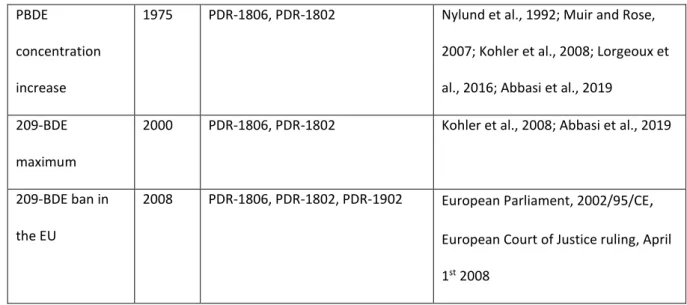
PBDE
concentration increase
1975 PDR-1806, PDR-1802 Nylund et al., 1992; Muir and Rose, 2007; Kohler et al., 2008; Lorgeoux et al., 2016; Abbasi et al., 2019
209-BDE maximum
2000 PDR-1806, PDR-1802 Kohler et al., 2008; Abbasi et al., 2019
209-BDE ban in the EU
2008 PDR-1806, PDR-1802, PDR-1902 European Parliament, 2002/95/CE,
European Court of Justice ruling, April 1st 2008
Table 1: Date markers used to build the age-depth models 460
3.4.2. Age models
461Model M1 for core PDR-1902 was developed from 210Pbxs modelling exclusively. The coefficient of
462
determination of the model was R²=0.61, and the resulting sedimentation rate in the reservoir 463
computed from the regression slope is 4.12 cm yr-1. According to this model, the bottom of core
PDR-464
1902 would date back to 1993 (Fig. 5.a). Model M2 additionally considers the PBDE decreasing trend 465
in the core and results from a linear regression. It estimates a constant sedimentation rate of 5.0 cm 466
yr-1 in the reservoir, the bottom of the core therefore dating back to 1999. While both models give
467
relatively similar results, the bathymetric measurements (Fig. S2) suggest that the bottom of the core 468
is older than 1999, which renders model M1 more plausible. 469
Models M1 and M2 for core PDR-1802 were obtained with a linear interpolation model (Fig. 5.b). 470
According to model M1, the bottom of the core dates back from 1960. The resulting sedimentation 471
rate is around 2.3 cm yr-1 between 1986 and 2018. Model M2 gives very similar results to model M1:
472
the date of the bottom of the core is estimated at 1969 and the sedimentation rate is around ~1.2 473
cm.year-1 until 1986, 1.7-1.8 cm yr-1 between 1986 and 2006 and 3.2 cm yr-1 between 2006 and the
474
surface. The consistency between the two models suggest that the dating of core PDR-1802 is overall 475
valid, although the dating of very bottom of the core beyond the older time-marker should be 476
26
considered with caution as the results had to be extrapolated. This also indicates that the additional 477
time-markers linked to the PBDE contamination trend in model M2 are reliable in this case. 478
479
Figure 5: Age-depth models for cores PDR-1902, PDR-1802, PDR-1806 and PDR-C10a. [IN COLOR]
480
Models M1 and M2 fore core PDR-1806 were obtained with a linear interpolation model (Fig. 5.c). 481
According to model M1, the bottom of the core dates back from 1890, however this date results from 482
a large extrapolation -the latest time-marker being positioned at 48 cm- and is therefore unreliable. 483
The sedimentation rate is estimated at 0.6 cm yr-1 between the bottom of the core and 48 cm
(time-484
marker: 137Cs peak 1986), then increases at 1.3 cm yr-1 until the surface. Model M2 gives a very similar
485
estimation for the top 48 cm of the core, with a sedimentation rate comprised between 1 and 2 cm yr
-486
1 between 1986 and 2018. Between 50 and 104 cm, however, the slope of the modelled line is steeper,
487
with an estimated 1.4 cm yr-1 sedimentation rate. According to this model, the bottom of the core
488
dates back from 1933, although it should still be considered with caution as it results from 489
extrapolation. As the two models give consistent results for the top 48 cm of the core, we can assume 490
that the dating of this section is reliable. The two additional time-markers related to the PBDE 491
27
contamination trend in model M2 therefore appear as accurate. Regarding the bottom half of the core, 492
model M2 is likely the most accurate of the two, as the beginning of PCB contamination in sediments 493
is widely accepted as dating back from the early 1950s (Wania, 1999; Breivik et al., 2002a; Breivik et 494
al., 2002b) and such a trend has already been observed in sediment core from the Rhône River (Desmet 495
et al., 2012; Mourier et al., 2014). 496
The best results for the age-depth modelling of core PDR-C10a (Fig. 5.d) were obtained with a linear 497
regression model. Only one POPs time-marker is additionally used in model M2 compared to M1, 498
therefore the two models are practically identical. A consistent sedimentation rate of 0.76 cm yr-1 is
499
estimated in both cases, with the bottom of the core dating back from 1840. However, the last reliable 500
time-marker is the grain-size change resulting from the river training infrastructures implementation 501
in the area around 1880, at 75 cm. Below this point, the model results are highly uncertain as they 502
stem from extrapolation. 503
4. Discussion
5044.1.
Multi-proxy dating in a complex fluvial setting
505Dating often constitutes the basis for the interpretation of other information recorded in a sediment 506
sequence, such as identifying contamination trends or relating grain-size patterns to hydrological 507
events. However, achieving a robust dating of sediments from a complex fluvial setting is challenging 508
and requires extensive interpretation in its own. Two types of dating methods can be distinguished 509
based on the information they provide (Notebaert et al., 2011): discrete methods such as radiocarbon, 510
Optically Stimulated Luminescence or 137Cs will provide an absolute date for a few discrete points in
511
the core, while continuous methods based on the presence and evolution of tracers -for instance 512
contaminant trends- will allow to identify time periods based on their vertical repartition in the 513
deposits. In fluvial contexts, several processes might render these dating methods ambiguous: 514
sedimentation hiatuses due to incision, erosion, or the intermittent nature of a depositional 515
environment (e.g. floodplain), fluctuations of sediment accumulation rate, post-depositional processes 516
28
(e.g. bioturbation, contaminants/radionuclides migration or leeching), etc. (Lewin and Macklin, 2003; 517
Bábek et al., 2008; Matys Grygar et al., 2016). The different dating methods will be more or less 518
affected by those processes: the use of 137Cs activity measurements might prove little informative if a
519
sedimentation hiatus coincides with an activity peak or if the sediments were deposited after 1986, 520
while a varying sedimentation rate is especially misleading when trying to infer a time period from a 521
known contamination trend. 522
A combination of complementary methods is therefore optimal for a robust dating of a sediment 523
sequence in a complex fluvial system, as illustrated in this study where no less than five types of time-524
markers (137Cs and 210Pb activity, contamination trends, grain-size changes, bathymetric
525
measurements) were necessary to build reliable age-depth models for each of the four depositional 526
environments. Indeed, few discrete time-markers were available in our samples: the deposits are too 527
recent for radiocarbon dating to give relevant results, and clear 137Cs peaks could only be identified in
528
two out of the four depositional environments. We therefore had to use continuous and less robust 529
indicators such as contamination trends. PCBs temporal trends in sediments are reasonably well-530
known, having been studied in many European Rivers (Bábek et al., 2008; Malina et Mazlova, 2017; 531
Lorgeoux et al., 2016, Dendievel et al., 2020) including the Rhône River (Desmet et al., 2012, Mourier 532
et al., 2014). They started being produced in the 1930s but the contamination often appears in 533
sediments from the 1950s only (Lorgeoux et al., 2016, Dendievel et al., 2020). Their emissions peaked 534
in 1975 in France (Breivik et al., 2002b), which coincides with the prohibition of their use in open 535
systems, and then decreased. They were then banned from use and sale in closed system as well in 536
1987. In our case, unfortunately, only core PDR-1806 recorded the complete PCB temporal trend, and 537
the large discrepancy between the concentration and the TOC-normalized trends (Fig. 4.b) rendered 538
unreliable any date indication other than the initial increase in concentrations (~1950s). PBDEs have 539
been less investigated and there is no consensus yet about their temporal repartition in sediment 540
deposits. However, their concentrations follow a well-defined pattern that seems consistent in the 541
cores from the aquatic environments (Fig. 4.a, 4.b and 4.c), meaning they could be used as geochemical 542
29
tracer. As for PCBs, their use is restricted in time: they started being produced in 1970 (Lauzent, 2017), 543
and were progressively banned from use and production by the European Union from 2004 to 2008 544
(European Parliament, 2002/95/CE). Additionally, results from dated sediment cores (Nylund et al., 545
1992, Zegers et al., 2003, Muir and Rose, 2007) suggest a contamination peak in the early to late 1990s 546
depending on the congener, BDE-209 tending to peak in the early 2000s as the use of the deca-mix 547
was regulated later than the others. 548
Relying on contamination trends -especially ones that were less studied- is risky to date sediment 549
archives in such a complex setting, therefore our approach was to construct two separate age-depth 550
models for the aquatic cores: model M1 from the absolute time-markers only (137Cs, grain-size changes,
551
sampling date), inevitably imprecise but reliable; and model M2 using contamination trends as 552
additional time-markers. Both models ended up being similar in the four cores, which proves the 553
robustness of our approach. In the case of PDR-1806, the use of PCBs contamination trend even 554
allowed to significantly improve the age-depth model in the lowest part of the core. This methodology 555
also confirms the potential for PBDE contamination trends to be increasingly used as time-markers in 556
sediment deposits, although larger-scale studies would be useful to ascertain it. Finally, the lack of 557
time-markers in the most recent core (PDR-1902, Fig. 4.a) highlights the interest of investigating 558
emergent contaminants trends in order to retain the ability to date future sediment cores where 559
conventional date-markers such as 137Cs peaks and historical organic contaminants may not be
560
present. 561
4.2.
Characterization of the depositional environments
562One of the aims of this study is to demonstrate that a thorough characterization of the fluvial 563
depositional environment from which a sediment core will be sampled is essential and time efficient. 564
While the four depositional environments have been previously described from a geographical and 565
geophysical point of view, this section intends to formally characterize these environments based on 566
30
previous geomorphology studies and illustrate incidentally the interest of such characterization for 567
sediment archive interpretation. 568
The dam reservoir environment in this study cannot readily be compared to most reservoirs in terms 569
of depositional processes, as the run-of-river dam is punctually erased during floods and few sediments 570
are therefore deposited in the axis of the dam (Fig. S2). The coring zone where sediments accumulated 571
corresponds to a recess zone where there is little flow velocity under normal discharge conditions and 572
is likely closer to a harbour basin in terms of context. The environment was never dredged and there 573
is no sedimentological nor bathymetric evidence to show that sediment remobilization might have 574
happened during floods: the core sediments are fine (silt to clay) and homogeneous, and the 575
bathymetric lines are in chronological order. Few date markers were available in the core sampled in 576
the reservoir, which renders essential the knowledge that sedimentation is likely continuous and 577
sustained in time in this environment: it supports the use of 210Pbxs decay and a linear regression
age-578
depth modelling to establish the chronology of the core. 579
The Ilon (active) secondary channel was affected by the river training phase in the 1880s: the upstream 580
end of the larger secondary channel to which the Ilon channel is connected to was barred by a dyke 581
(Vauclin et al., 2019, Tena et al., 2020). Later on, the dam implementation quickly resulted in the 582
disconnection and siltation of the upstream part of the channel, which is a common consequence of 583
bypassing in the Rhône River as demonstrated in Dépret et al. (2019). Both phases can be identified 584
on the GPR profile due to a distinct and continuous subparallel reflector (dotted line on Fig. 2.a) that 585
matches temporally with the dam-induced legacy sediment limit in the cores (Fig. 3.b). While the grain-586
size analysis shows that sediments below the limit are coarser (fine sand) than those above (silt), both 587
units appear similar on the GPR survey: poorly defined subparallel reflectors that are indicative of a 588
calm deposition process. A deeper subparallel reflector is speculated to correspond to the pre-589
infrastructure gravel-bed (Fig. 2.a). Overall, this depositional environment is therefore characteristic 590
of a passive channel fill (Aslan, 2013). The river training infrastructure initiated the filling, and the 591
31
severe flow reduction associated with bypassing emphasized the disconnection, resulting in the 592
deposition of finer sediment without altering the sedimentary architecture. Understanding the 593
chronology of the filling process of this environment was invaluable to reinforce the dating of the 594
corresponding sediment core. 595
The Limony (semi-active) secondary channel was artificially disconnected from the main channel by 596
the building of dykes at its upstream and downstream ends in the 1880s (Vauclin et al., 2019; Tena et 597
al., 2020). Both the sediment cores and the GPR results prove that two distinct phases of infilling 598
followed. The first phase is characterized by numerous oblique and concave reflectors on the GPR 599
profile (Fig. 2.b) and fine to medium sands in the corresponding section of the sediment cores (Fig. 600
3.c). Both aspects are indicative of an active fill (Aslan, 2013), with deposition of bedload elements and 601
possible migration of bar or dune forms recorded as the oblique reflectors. The second phase is 602
characterized by subparallel/sinuous reflectors (Fig. 2.b) and silt deposits (Fig. 3.c), indicating a more 603
passive fill due to severe flow reduction (Aslan, 2013) -which in this case is due to the dam 604
implementation in 1978. Dépret et al. (2019) also found that water level lowering following bypassing 605
in the Rhône River resulted in a rapid dewatering process, which is confirmed here by the sharp 606
increase in organic carbon content in this layer (Fig. 4.c). This depositional environment is therefore a 607
hybrid of an active and passive channel fill, strongly influenced by river engineering. This interpretation 608
was essential to identify the grain-size change as a date-marker that contributes to the robust dating 609
of core PDR-1806. Additionally, it is worth noticing that its intermittent connection to the main channel 610
might have resulted in a discontinuous sediment record. 611
Finally, the floodplain environment described in this study could be defined as a floodbasin: the lowest 612
lying parts of a floodplain that act as a stilling basin in which suspended fines can settle from overbank 613
flows after the coarser suspended debris have been deposited on levees (Aslan, 2013; Allen, 1965). 614
Sediments from the floodplain environment in our study area are indeed fine (Fig. 3.d) and the absence 615
of reflectors in the upper layer on the corresponding GPR profile (Fig. 2.c) is an indication of a 616
32
decantation process, resulting in a homogeneous sedimentary architecture with no tangible reflector. 617
In our case, the screening of coarser materials has been emphasized by the implementation of in-618
channel infrastructures (Vauclin et al., 2019). Floodbasins often exhibit a network of small channels 619
(Allen, 1965), which used to be the case in the studied area, as proven by the two paleochannels clearly 620
identifiable on GPR10 (Fig. 2.c). Those filled channels are not discernible on the field nor recorded in 621
the historical maps, likely due to their small size: this demonstrates the interest of using GPR or another 622
geophysical method to understand the sedimentary context of a sediment core. 623
4.3.
Influence of depositional environments on sediment archives
624When studying a sedimentary archive, one is ideally looking for a compromise between a good 625
temporal resolution and a long-term record, in an environment as preserved as possible. Those 626
features depend strongly on the depositional environment and are influenced by natural and 627
anthropogenic disturbances. As a consequence, finding a good sampling site for a sediment core is 628
rarely straightforward and requires investigation and/or a good knowledge of the study area. 629
Floodbasins have often been used as archives of historic contamination as they are less prone to 630
reworking than channel deposits and thus constitute long-term records of fine-grained sediments that 631
efficiently retain contaminants (Matys Grygar et al., 2016). The counterpart is that the record is most 632
likely intermittent, sediments being deposited in high-discharge conditions only. An estimation of the 633
overflow frequency is therefore essential for the interpretation of sedimentary sequences from such 634
an environment. In aggrading or corseted systems, the floodplain might not be actively flooded 635
anymore, meaning that even sediments close to the surface could be a few decades old. In our case, 636
the floodplain has been entirely disconnected from the channel since the late 1970s, and interpreting 637
the pollution trend from core PDR-C10a (Fig. 4.d) as the whole contamination chronicle would have 638
led to a wrong estimation of the pollution levels and dynamics in the area. Lewin and Macklin (2003) 639
noted that channel stability may cause overbank sedimentation to become self-limiting as the 640
floodplain aggrades and progressively becomes too elevated to be overflowed, and therefore reduces 641
33
over time the preservation potential of the floodplain environment. This is consistent with our 642
observations following the river training infrastructures implementation: the decline in floodplain-643
channel connectivity was first translated into the deposition of finer-grained legacy sediments (Vauclin 644
et al., 2019), and was later exacerbated by the severe flow reduction associated with the dam 645
construction. River engineering therefore caused the loss of a recording environment, but it should 646
also be noted that the river training infrastructures stopped lateral channels migration, facilitating 647
sediment deposition without major reworking in the margins for several decades. Despite the recent 648
hiatus, the floodplain in our study still displays the longest sediment record (~1840s-1970s, cf. Fig. 6), 649
and therefore remains an essential sedimentary archive when properly interpreted. 650
Abandoned or partly disconnected channels are often considered as a good alternative to floodplains 651
to study recent river history (Bábek et al., 2008, Van Metre et al., 2008; Van Metre et al., 2015; Mourier 652
et al., 2014) as they are usually characterized by a reasonably good preservation potential and a better 653
stratigraphic resolution and continuity than floodplains due to their higher connectivity with the main 654
channel. The two secondary channels we studied showed similar recording tendencies but were also 655
influenced by the respective timings and dynamics of their disconnection. The temporal extent of the 656
archive is related to the date of the disconnection: the secondary channel that was partly disconnected 657
from the 1880s onward recorded a longer chronicle (1930s-2018) than the other channel (1960s-2018) 658
whose partial disconnection is mainly related to the bypass implementation in the 1970s. This 659
illustrates again the influence of human-induced river modification on the recording ability of the 660
various depositional environments. Additionally, the temporal resolution of the archive is linked to the 661
connection frequency of the channel environment (Fig. 6): the Ilon channel which is connected most 662
of the year has an accumulation rate more than twice as high (~3.2 cm.year-1) as the Limony channel
663
(~1.3 cm.year-1) that is only connected under high discharge conditions. Finally, the nature of the
664
channel fill influences the continuity and reliability of the archive: a passive fill such as in top parts of 665
the secondary channel cores ensures a deposition without reworking and therefore an archive without 666

![Figure 5: Age-depth models for cores PDR-1902, PDR-1802, PDR-1806 and PDR-C10a. [IN COLOR]](https://thumb-eu.123doks.com/thumbv2/123doknet/13411388.407129/27.892.98.843.193.626/figure-age-depth-models-cores-pdr-pdr-color.webp)