HAL Id: hal-01590806
https://hal-pjse.archives-ouvertes.fr/hal-01590806
Submitted on 20 Sep 2017
HAL is a multi-disciplinary open access archive for the deposit and dissemination of sci-entific research documents, whether they are pub-lished or not. The documents may come from teaching and research institutions in France or abroad, or from public or private research centers.
L’archive ouverte pluridisciplinaire HAL, est destinée au dépôt et à la diffusion de documents scientifiques de niveau recherche, publiés ou non, émanant des établissements d’enseignement et de recherche français ou étrangers, des laboratoires publics ou privés.
Ready for Boarding? The Effects of a Boarding School
for Disadvantaged Students
Luc Behaghel, Clément de Chaisemartin, Marc Gurgand
To cite this version:
Luc Behaghel, Clément de Chaisemartin, Marc Gurgand. Ready for Boarding? The Effects of a Board-ing School for Disadvantaged Students. American Economic Journal: Applied Economics, American Economic Association, 2017, 9 (1), pp.140-164. �10.1257/app.20150090�. �hal-01590806�
Ready for boarding?
The effects of a boarding school for disadvantaged students.
∗Luc Behaghel† Cl´ement de Chaisemartin‡ Marc Gurgand§ April 4, 2016
Abstract
Boarding schools substitute school to home, but little is known on the effects this substitution produces on students. We present results of an experiment in which seats in a boarding school for disadvantaged students were randomly allocated. Boarders enjoy better studying conditions than control students. However, they start outperforming control students in mathematics only two years after admission, and this effect mostly comes from strong students. Boarders initially experience lower levels of well-being but then adjust. This suggests that substituting school to home is disruptive: only strong students benefit from the school, once they have adapted to their new environment.
Keywords: boarding school, cognitive skills, non-cognitive skills, randomized controlled trial, heterogeneous effects
JEL Codes: I21, I28, J24, H52
∗
This research was supported by a grant from the French Experimental Fund for Youth. We are very grateful to Jean-Michel Blanquer for his strong support to this project, as well as to C´edric Afsa, Pierrette Briant, Jean-Fran¸cois Bourdon, Bernard Lociciro, St´ephane Lours, Sithi Maricar, C´edric Mont´esinos, B´en´edicte Robert and all National Education personnel who supported operational work and data collection; and to Pascal Bessonneau, Jean-Fran¸cois Chesn´e, Sylvie Fumel and Thierry Rocher, from the Evaluation Department of the French Ministry of Education, who created the cognitive tests used in this paper. Adrien Bouguen and Axelle Charpentier provided outstanding contributions as research managers at the J-Pal European office: we thank them very warmly, as well as J-Pal administrative team and research assistants. We also thank Karen Brandon, Xavier D’Haultfœuille, Julien Grenet, Francis Kramarz, Victor Lavy, Andrew Oswald, Roland Rathelot, Vincent Pons, Claudia Senik, Fabian Waldinger, Chris Woodruff, seminar participants at Warwick University, the Institute of Fiscal Studies, Uppsala University, Crest and PSE for their helpful comments. This research has been approved by J-Pal Europe ethics committee (ref. CE/2010-001).
†
Paris School of Economics - INRA, [email protected]
‡
University of Warwick, [email protected]
§
1
Introduction
Boarding schools are an intensive form of education, in which students live at school, and visit their families only for weekends and vacations. There is a long-standing tradition in American and English upper-class families of sending male children to elite boarding schools even at a very young age. Cookson et al. (2008) argue that by doing so, parents hope to provide their children a sense of discipline, and, thus, prepare them for leadership positions. Recently, boarding schools have received renewed interest from policymakers seeking ways to enhance the academic progress of disadvantaged students. Two examples are the SEED boarding schools in the United States which serve poor black students, and the “boarding schools of excellence” in France which serve relatively high-ability students from poor families. In both cases, policy makers opened these schools because they were concerned that the poor studying conditions and negative influences students are exposed to in their home environment could impair their academic potential.1
The explicit goal of these boarding schools is to substitute time at school to time at home, under the presumption that this will generate better outcomes for students. However, very little is known on the effects this substitution actually produces. Curto & Fryer (2014) is the only paper we are aware of which studies this question. The authors find that being enrolled in the SEED boarding school in Washington DC increases students test scores by 20 percent of a standard deviation per year spent in the school.
In this paper, we analyze the effects of a French “boarding school of excellence” on students cognitive and non-cognitive outcomes. The school we study was created in 2009, and is located in a rural area south of Paris. It was oversubscribed, and students offered a seat were randomly selected out of the pool of applicants. We followed the treatment and the control groups over two years after the lottery. Data collection implied surveying and testing students in 169 different schools scattered all over France.
The boarding school dramatically increases the quantity and the quality of schooling inputs: boarders benefit from smaller classes, spend longer hours in study room, report much lower levels of classroom disruption, and praise the engagement of their teachers. These investments have positive returns: after two years, the treatment group performs substantially better on the mathematics test. The difference is sizeable: the boarding school increases students’ maths test scores by more than 20 percent of a standard deviation per year spent
1
This is not the first time boarding schools have been used to increase the educational opportunities of marginalized and disadvantaged students. In the end of the 19th century, American philanthropists from the Indian Rights Association set up boarding schools for American Indians’ children, to assimilate them into mainstream American culture. In 1926, 83 percent of the American Indian school-age population was enrolled in one of these boarding schools (see Adams, 1995).
in the school. However, these positive effects hide two important findings. First, returns only emerge after two years: one year after the lottery, test scores are very similar in the treatment and control groups. This is in sharp contrast with papers studying the dynamic effects of educational interventions, which have often found stronger effects for the first year of treatment (see Krueger (1999)), or effects that are linear in the amount of exposure (see Abdulkadiroglu et al. (2011)). Second, returns are very heterogenous: we find that the average effect of the school after two years mostly comes from students in the higher tercile of math scores at baseline. For them, the effect is very large, around 57 percent of a standard deviation per year spent in the school.
We take advantage of the very detailed data we collected to investigate the mechanisms that could underlie these patterns. When students arrive at the boarding school, they need to adapt to their new environment. First, they have to cope with the separation from friends and family. Second, they relinquish a certain amount of freedom. For instance, they report spending four times less time watching television than control students, a difference probably due to the strong control exerted by the boarding school staff. Third, boarders face higher academic demands. They are immersed into an environment with peers who are academically stronger, and teachers who are more demanding: most students experience a sharp decline in their grades when they enter the school. These three factors are probably responsible for the lower levels of well-being we observe among boarders in the end of their first year. During their second year, students seem to adjust, and the positive effects of the intervention appear. Boarders’ levels of well-being catch-up with those of control students; their motivation becomes higher, and they also report spending more time on their homework, while there were no differences in the end of the first year on these two dimensions.
The stark difference between returns to students’ first year and second year in the boarding school might therefore arise from the following mechanism: Adjusting to the school reduces students well-being, thus impeding their learning until they have adapted to their new envi-ronment. We find some indication that the initial negative shock on well-being and motivation is larger for weaker students, while the recovery is faster for stronger students, although we lack statistical power to make definitive conclusions. Though this interpretation is some-what speculative, we review other potential mechanisms, and we argue that they cannot fully account for all of our findings.
Overall, our results suggest that boarding is a disruptive form of schooling for students. Once they have managed to adjust to their new environment, strong students make very substantial academic progress. On the other hand, this type of school does not seem well-suited to weaker students: even after two years we do not observe any test scores gains among
them.
From a methodological perspective, our results also show that in education research, re-gression discontinuity estimates can fall very far from the average treatment effect. If we had used a regression-discontinuity design to measure the effect of this boarding school, we would have found no effect or even a negative effect. We indeed find an insignificantly positive effect for weak students at baseline, and negative quantile treatment effects at the bottom of the distribution. This estimate would have fallen far from the average positive effect of the boarding school.
Accordingly, our results might shed new light on recent, puzzling results on elite schools. Many elite schools around the world use entrance exams to admit students. A number of papers have used regression discontinuity designs to measure the effects of these schools on students at the admission cut-off. These papers have consistently failed to find any effects on students’ test scores (see Abdulkadiro˘glu et al., 2014 and Lucas & Mbiti, 2014) or college enrollment (see Dobbie & Fryer Jr, 2013), and have even sometimes found negative effects on dropout rates among the most vulnerable students (see de Janvry et al., 2012).This has been interpreted as evidence that peer effects do not play a large role in the production of education (see Abdulkadiro˘glu et al., 2014). Based on our results, one might suggest another interpretation. When they enter these elite schools, students may benefit from the presence of strong peers, and at the same time, they may also be hampered by the need to adapt to a new, more competitive environment – as happens to students in our boarding school. The absence of any effect for students at the threshold could then be the sum of a positive peer effect and a negative adaptation effect. Moreover, overcoming this adaptation process might be easier for stronger students. Effects for them might then be larger than for students at the admission cut-off, in which case regression discontinuity estimates could fall far from the average effects of these schools.2
The remainder of the paper is organized as follows. In Section 2, we describe our research design, the complex data collection we had to complete for this project, and our study pop-ulation. In Section 3, we present the main differences between the boarding school and the schools in which control students are enrolled. In Section 4, we present the effects the board-ing school produces on students test scores. In Section 5, we discuss potential mechanisms underlying these effects. Section 6 concludes.
2
As shown by Clark & Del Bono (2016), the lack of effects of elite schools in the short run may also hide large, significant long-run effects, for instance on completed education and female fertility.
2
Research design, data, and study population
In the fall of 2005, important riots took place in the suburbs of Paris and other large French cities. These events triggered a number of political responses, including which the “Inter-nats d’excellence” program. “Inter“Inter-nats d’excellence” could be translated as “boarding schools targeting excellence”. These schools are dedicated to motivated and relatively high ability students in poor suburbs of large French cities. Policy makers were concerned that in those suburbs, poor school quality, negative influences from peers, and bad studying conditions at home could impair the academic success of motivated students. The school we study is located in a rural area southeast of Paris. It was the first “Internat d’excellence” to open, and it is also the largest of the 45 “Internats d’Excellence” now operating in France, with an intake accounting for 10% of that of the 45-school program. It serves students from all eastern parisian suburbs, the most deprived ones.
2.1 Research design and statistical methods
Students offered a seat in the boarding school were randomly selected out of a pool of ap-plicants. We study the boarding school’s first two cohorts, those admitted in September 2009 and September 2010. In 2009, 129 seats were offered to students in 8th to 10th grades. In 2010, 150 seats were offered to students in 6th to 12th grades. The school received 275 applications in 2009, and 499 in 2010. In the spring of each year, a committee screened ap-plications to make sure that the students met the school’s eligibility criteria. The policy was intended to target motivated students living in homes that were considered unconducive to scholastic progress. In 2009, 73 applications were discarded for lack of eligibility. In 2010, 216 were discarded. A few applicants (five in 2009 and seven in 2010) were granted priority admission because they faced particularly tough conditions at home. The boarding school had set a predetermined intake of students at the grade and gender levels, to ensure that male- and female-only dormitories of given sizes could be formed. In each grade × gender stratum in which the number of applicants still exceeded the number of seats remaining after the screening and priority admission, we randomly allocated applicants a waiting list number. Seats were offered following this order.
Waiting list randomization designs have often been used in the education literature (see e.g. Abdulkadiroglu et al., 2011 or Curto & Fryer, 2014). In such designs, the treatment (resp. control) group is often defined as students receiving (resp. not receiving) an offer. Groups constructed this way are not strictly statistically comparable.3 Students joining the
school when they receive an offer (accepters) are slightly over-represented in the treatment 3We thank an anonymous referee for pointing this out to us.
group, because the last student receiving an offer must by definition be an accepter. If that student had not been an accepter, the next student in the waiting list would have received an offer to ensure all seats are filled. However, de Chaisemartin & Behaghel (2015) show that this problem can easily be solved: students with a random number strictly lower than that of the last student who received an offer are statistically comparable to students with a random number strictly greater. These two groups can therefore be used as valid treatment and control groups, while the last student receiving an offer in each lottery stratum should be discarded from the analysis. In this paper, we follow this procedure to construct our treatment and control groups. Applicants exceeded the number of seats in 14 grade × gender strata. 395 applicants in these strata participated in a lottery, and 258 received an offer to join the school. Our treatment group consists of the 244 students who received an offer and with a random number strictly above that of the last student in their stratum receiving an offer, and our control group consists of the 137 students who did not receive an offer.
The lottery created very similar treatment and control groups. In Table 1, we compare them on 14 measures of baseline ability and socio-economic background. We find no significant difference, even at the 10% level.
Compliance with random assignment was high. 86% of lottery winners enrolled in the school, and 76% of them stayed until the end of the academic year. By contrast, 6% of lottery losers managed to enrol because one of their siblings had been admitted to the school. 5% stayed until the end of the year.
In all the regressions we estimate in the paper, we use propensity score reweighting to account for the fact our lottery offer is randomly assigned within grade × gender strata (see Rosenbaum & Rubin, 1983 and Fr¨olich, 2007). Let Zi be a dummy denoting our lottery offer,
and let Si denote lottery stratum. In our regressions, students in the treatment group receive
a weight equal to q
P (Zi=1)
P (Zi=1|Si), while control students receive a weight equal to q
P (Zi=0)
P (Zi=0|Si).
4
These weights ensure that our coefficients of interest arise from the comparison of lottery winners and losers within and not across strata. Alternatively, we could have estimated unweighted regressions with lottery strata indicators. These regressions estimate a variance-weighted average of within-strata comparisons, which does not give to each stratum its natural weight in the population. Therefore, these regressions do not estimate standard parameters of interest in policy analysis such as intention to treat (ITT) or local average treatment effects (LATE). Notwithstanding, it is worth noting that using one or the other estimation method hardly changes our main results (see Table 17 in the Appendix). Moreover, as using lottery 4Using a GMM representation, it is easy to see that this reweighting is computationally equivalent to
Table 1: Balancing checks
Control Mean T-C SE N
(1) (2) (3) (4)
Ability and disruptiveness
Grade in French 12.70 -0.169 0.300 380
Grade in Maths 13.02 0.108 0.370 380
Studies latin or greek 0.29 -0.069 0.051 362
Studies german 0.28 -0.057 0.052 362
School behavior grade 15.99 0.498 0.428 331
Times missed school last term 5.63 0.851 0.746 337
Socio-economic background
Parent blue collar or clerk 0.47 -0.016 0.059 379
Recipient of means tested grant 0.40 0.037 0.059 379
Number of children in the family 2.93 -0.028 0.191 379
Parents divorced 0.26 -0.026 0.055 338
Single-parent family 0.38 -0.063 0.060 340
Parent has no degree 0.11 0.004 0.040 334
Parent completed high school 0.22 0.027 0.054 334
Only French spoken at home 0.41 0.047 0.061 340
Notes. This table reports results from OLS regressions of several dependent variables on a constant, a dummy for our lottery offer, and strata dummies. Column (1) reports the coefficient of the constant, while column (2) reports the coefficient of the dummy. Standard errors in column (3) are robust. Measures of baseline ability and disruptiveness come from application files. Socio-economic variables come from the “Sconet” administrative data set. *significant at 10%; **significant at 5%; ***significant at 1%.
strata often increases statistical precision, we use this specification to perform our balancing checks (see Tables 1 and 11). Here the goal is not to estimate an ITT or a LATE but just to check that our lottery did not fail to create comparable groups, so maximizing power is desirable.5
2.2 Data
French students do not take standardized tests every year. Consequently, we had to conduct a complex data collection operation to measure students’ academic ability and non-cognitive outcomes. This, among other things, involved collaborating with 169 different schools scat-tered over the whole of France as we detail below.
One and two years after the lottery, we gave students two standardized tests, each one hour and 30 minutes in length. The first test included a one-hour French test and a 30-minute non-cognitive questionnaire. The second test included a one-hour mathematics test and another 30-minute non-cognitive questionnaire. The French Department of Education created the French and mathematics tests. We devised the non-cognitive questionnaires, using validated psychometric scales and questions from the Program for International Student Assessment (PISA).
Tests were taken online in the computer lab of students’ schools. Boarders took them with their classmates. To ensure that treatment and control students were taking the test in somewhat comparable conditions, we randomly selected three classmates to take the test with every student not enrolled in the boarding school. We also took extensive steps to prevent cheating: we sent research assistants to the boarding school to serve as test proctors; the programming of the test ensured questions did not appear in the same order on neighboring computers, so that neighboring students would not answer the same question at the same time; students could only bring a pen and a sheet of paper to the test room. Students not enrolled in the boarding school were scattered among 169 schools. Most of them were in the local school district of Creteil, but some of them were in other areas of France. Due to budget constraints, we could not send research assistants to monitor the tests in each of these 169 schools. This is problematic as this implies that the level of oversight on the exam might be different in the treatment and in the control group. To mitigate this problem, the Department of Education wrote to the principals of all of these schools to require that our test be monitored by someone from the school. Because the tests were taken online, we can check whether students who took the test out of the boarding school spent more time on the test than was allowed. We do not find evidence of this (see Table 12 in the Appendix). 12
5
schools did not have a working computer lab, and we had to send them paper versions. 2 years after the lottery, 27 students had dropped out of school. These students took the tests at home. Our main results are robust to dropping these observations (see Table 13 in the Appendix).
In order to ensure that our results would not be plagued by differential attrition, extensive effort was required to reach all of the control students, who were scattered among many more schools than treatment students. In the end, more than 90% of students took our tests, and attrition was balanced in the treatment and in the control groups as shown in Table 14 in the Appendix. Moreover, the treatment and control groups are still balanced after discarding students lost to follow-up. In Table 11 in the Appendix, we restrict the sample to students who took the mathematics test in year 2, and compare the treatment and the control group on the same 14 characteristics as in Table 1. We still find no statistically significant difference between the two groups.
Cognitive tests were partly revised each year by the Department of Education to ensure that students and their teachers could not anticipate which questions would be asked in the following year. We tried not to change our non-cognitive questionnaires from one year to the other, to ensure the comparability of students’ responses. However, at the end of the first year of data collection, we realized that students took much less than the allotted 30 minutes to answer our non-cognitive questionnaires. As a result, in the following years, we added more questions. Unfortunately, this means that some questions are not available one year after the lottery for the first cohort of students.
Finally, we also rely on a number of pre-existing sources of information to describe our study population and the treatment. We use students’ average marks in mathematics and French from transcripts required in the application process as measures of baseline ability. We use the “Base Scolarit´e” (Sconet) administrative data set to describe the students’ socio-economic background. We also use data from the “Diplˆome National du Brevet”, the French national exam given to students at the end of middle school, to compare applicants to the boarding school to their classmates and to French students. Finally, we use the “Base Relais”, an administrative data set on teachers and supervisors working in French schools, to compare the school staff in the boarding school to the staffs in schools where control students were enrolled.
To increase statistical precision, all of our regressions include the following list of controls: students’ grades in French, math, and school behavior, as per the transcripts they provided in their application; a dummy for students enrolled in a Greek or Latin optional class at baseline; the level of financial aid students’ family receive under the means-tested grant for
middle- and high-school students; a dummy for whether French is the only language spoken at home; a dummy for students whose parents are unemployed, blue collar workers, or clerks; dummies for boys, second cohort, and school grade. Our main results are robust to dropping these controls from the regressions (see Table 15 in the Appendix).
2.3 The population of applicants to the boarding school
We measure the effect of the boarding school within the population of students who applied for seats. This population is the product of several layers of selection. In the fall of each year, the Department of Education wrote to school principals asking them to identify motivated students who lacked home environments conducive to studying, and to encourage these stu-dents to apply. Stustu-dents interested in joining the school then had to fill out an application form, write a letter of application, and provide a letter from a parent. Finally, a committee discarded applications which did not match the profile targeted by the policy.
In Table 2, we describe our study population. Whenever data are available, we also compare the student population to several reference populations. Our population comprises a majority of girls (57 percent), and students’ average age when they applied was 14. Eligible applicants are higher achievers than their classmates, but median students in the French population. At the time of application, applicants ranked around the third decile of their class in French and mathematics. Slightly more than half of our study population had taken the end-of-middle-school French exam before applying for the boarding school. Those students scored 13.5 percent of a standard deviation higher than the French average in French and mathematics, and 42.5 percent of a standard deviation higher than their classmates. Under a normality assumption, this implies that eligible applicants stand at the 45th percentile of the French distribution.
Eligible applicants are also underprivileged students. The share of eligible applicants who are recipients of the means-tested grant for middle- and high-school students is almost twice as large as in the French population, and close to the share observed among students enrolled in “ ´Education prioritaire” schools, a program that encompasses French schools located in the poorest neigborhoods. Still, given that the program explicitly targets disadvantaged students, it might seem surprising that this fraction is not higher than 44 percent. This could be due to the fact that a substantial fraction of eligible families do not claim this grant because its amount is low and the application procedure costly. Applicants’ parents are as likely to be clerks and blue-collar workers as parents of their classmates, and more likely to be inactive, and the schools from which applicants come are located in one of the poorest areas in France. French is the only language spoken at home for only 40 percent of them: this suggests that
many come from families that recently immigrated to France.
Table 2: Economic background and baseline academic ability of applicants
Applicants French “ ´Education Classmates
students prioritaire”
(1) (2) (3) (4)
Baseline ability
Mark in French, transcripts 12.256 10.500
Rank in French, transcripts 0.273
Mark in Mathematics, transcripts 12.646 10.529
Rank in Mathematics, transcripts 0.301
Middle school exam, French 0.135 0.000 -0.288 -0.335
Middle school exam, Mathematics 0.135 0.000 -0.352 -0.241
Socio-economic background
Means tested grant, middle school 0.464 0.278 0.468
Means tested grant, high school 0.412 0.249
Parent clerk 0.242 0.210
Parent blue collar 0.259 0.278
Parent inactive 0.186 0.082
Parent has completed high school 0.245
Only French spoken at home 0.403
Other characteristics of applicants
Share of girls 0.574
Average age 14.129
Number of children in the family 2.818
N 381 9 637
Notes. This table compares applicants to the boarding school to a number of reference populations. “Educa-tion prioritaire” refers to a program that encompasses French schools located in the poorest neighborhoods. Socio-economic variables on applicants come from the “Sconet” administrative data set. Transcripts come from their application files. Grades in the end-of-middle-school exam come from the “Base Brevet” administrative data set. Data on French students, students enrolled in “ ´Education Prioritaire” schools and in the Cr´eteil school district come from DGESCO (2010). Ranks range from 0 (highest) to 1 (lowest).
3
The treatment
In this section, we compare the amount of educational inputs received by boarders and control students. Specifically, we estimate the following two stage least squares (2SLS) regressions
for 40 such inputs Yi:
Yi= η0+ η1Di+ Xi0ζ + εi. (1)
Yi are either objective measures of the resources of the school where student i is enrolled
(e.g. class size), or measures of students’ i experience (e.g. perceived levels of classroom disruption). Di is a dummy for whether student i was enrolled in the boarding school at the
time the measure was made. We use the dummy for our lottery offer Zi as an instrument
for Di.6 Xi is the vector of statistical controls listed in Section 2.2 and εi is a residual. η1
measures the difference in the amount of input Yi received by students who comply with
their lottery offer when they are in and out of the boarding school. Indeed, it is equal to the difference between lottery winners’ and losers’ average of Yi, normalized by the difference in
the share of students enrolled in the boarding school between these two groups. Estimates of the mean of Yi for compliers in the control group are displayed in column (1) of Tables 3, 4,
and 5 (we follow the method described in Abadie (2003) to estimate this quantity). Estimates of η1 are displayed in column (2).
To measure students’ experiences, we included questions from PISA on levels of disruption in the classroom, relationships between students, etc., in the questionnaires we administered to students. Answers to these questions could take four values: “strongly disagree”, “disagree”, “agree”, and “strongly agree”. In Tables 4 and 5 we present the effect of being enrolled in the boarding school on students’ answers to these questions divided by their standard deviation in the control group. When several questions arguably measure the same dimension, we compute the average of a student’s answers to these questions, and we divide this average by its standard deviation in the control group.7
The boarding school benefits from more resources than the schools in which control stu-dents are enrolled. As shown in Table 3, the teacher-to-student ratio is 36 percent higher in the boarding school, which corresponds to the fact that classes are 22 percent smaller. The supervisor-to-student ratio is almost five times larger, because students must also be monitored at night. Boarding school teachers are better educated and less experienced than teachers of control students. A larger fraction of them hold the “Aggr´egation”, the highest degree for high school teachers in France. But twice as many of them have less than three years of experience. Based on these two observable dimensions, boarding school teachers appear less likely to generate high test scores than those in control schools. There is indeed little evidence
6
See Section 2.1 for the definition of the lottery offer threshold that defines the instrument.
7
All the tables in this section present results two years after the lottery took place, because some of these questions were not included in the questionnaires administered to the first cohort one year after the lottery. In Tables 19, 20, and 21 shown in the Appendix, we present results one and two years after the lottery, keeping only the second cohort for questions which were not administered to the first cohort one year after the lottery. We find few differences between the two years.
in the literature that more educated teachers generate higher test scores, while there is some evidence that experienced teachers do. In particular, the first years of experience seem to have higher returns – for a meta-analysis, see Hanushek & Rivkin (2006). But teachers in the boarding school have volunteered to join, so they could differ from control schools teachers on unobservable dimensions such as motivation.
Table 3: Resources allocated to the boarding school
E(Y0|C) LATE SE N
(1) (2) (3) (4)
Class size 25.680 -5.664*** 0.918 341
Teachers per 100 students 8.350 3.040*** 0.244 360
Supervisors per 100 students 1.590 6.090*** 0.125 362
Teachers with “Aggregation” degree 0.180 0.097*** 0.021 365
Teachers with less than 3 years experience 0.187 0.201*** 0.011 365
Teachers years of experience 9.898 -3.501*** 0.399 365
Notes. This table reports results from 2SLS regressions of several dependent variables on a constant, a dummy for being enrolled in the school and the statistical controls listed in Section 2.2, using our lottery offer as an instrument. Column (2) reports the coefficient of the dummy (η1 in equation 1). Standard errors in column
(3) are clustered at the class level. Column (1) reports an estimate of the mean of the outcome for compliers not enrolled in the school. We use propensity score reweighting to control for lottery strata. The last column displays the number of observations. We use only one observation per student, two years after the lottery. The class size variable comes from students’ questionnaires. The other variables come from the “Base Relais” administrative data set. *significant at 10%; **significant at 5%; ***significant at 1%.
Boarders also benefit from a much better classroom experience than control students, as shown in Table 4. As per our score, levels of classroom disruption are 72.9 percent of a stan-dard deviation lower in the boarding school. For instance, students are less likely to answer that they cannot work well in the boarding school. Living together in the boarding school in-creases solidarity and cooperation among students: treated students are more likely to report that they do their homework in groups, and that strong students help weak ones. Boarding school teachers are more engaged: boarders are more likely to report that their teachers keep explaining until all students have understood, that they give them the opportunity to express their opinions, and that they care about students’ academic progress. They also perceive their teachers much more positively: overall, our students-teacher relationship score is 1.02 standard deviation higher in the boarding school.
But boarders face higher academic demands. They have to take a two-hour test each week, and grading in the boarding school is much harsher than in a regular school. Students
Table 4: Students’ experience in the classroom
E(Y0|C) LATE SE N
(1) (2) (3) (4) Attendance over the last two weeks
Attendance score 0.230 0.162 0.199 350 Missed school -0.336 -0.072 0.239 351 Skipped classes -0.193 -0.152 0.205 350 Arrived late -0.078 -0.190 0.191 351 Disruption Disruption score -0.150 -0.729*** 0.236 349 Teacher often waits students calm down -0.167 -0.428* 0.221 350 Students start working long after class begins -0.190 -0.325 0.223 350 Students cannot work well -0.101 -0.475** 0.218 349 There is noise and disruption in the classroom -0.131 -0.533** 0.217 350 Students do not listen to the teacher -0.051 -0.994*** 0.256 350 Relationships between students
Students relationships score 0.095 0.801*** 0.202 280 Students are ashamed when they have good grades -0.044 -0.246 0.216 281 Weak students make fun of strong ones -0.398 0.092 0.207 324 Students do their homework in group -0.142 0.591*** 0.214 350 Strong students help weak ones -0.045 1.005*** 0.209 349 Teachers’ engagement
Teachers’ engagement score -0.146 1.389*** 0.257 350 She cares for students academic progression -0.055 0.746*** 0.205 350 She explains until students understand -0.154 1.191*** 0.217 350 She listens to students opinions -0.041 0.864*** 0.229 350 Teacher-students relationships
Teacher-students relationships score 0.032 1.020*** 0.255 336 Students get along well with their teachers 0.057 0.821*** 0.268 351 Teachers care for students 0.073 0.786*** 0.233 336 Teachers listen to students 0.044 0.731*** 0.238 351 Teachers give supplementary help if needed -0.024 0.914*** 0.240 351 Teachers are fair to students -0.002 0.717*** 0.243 351
Notes. This table reports results from 2SLS regressions of several dependent variables on a constant, a dummy for being enrolled in the school and the statistical controls listed in Section 2.2, using our lottery offer as an instrument. Column (2) reports the coefficient of the dummy (η1 in equation 1). Standard errors in column
(3) are clustered at the class level. Column (1) reports an estimate of the mean of the outcome for compliers not enrolled in the school. We use propensity score reweighting to control for lottery strata. The last column displays the number of observations. We use only one observation per student, two years after the lottery. All the variables come from students’ questionnaires. Each score in italics is standardized and computed from the variables listed below. *significant at 10%; **significant at 5%; ***significant at 1%.
from the first cohort experienced a 2.1 point decrease in their marks in math after entering the boarding school.8 This is a substantial drop, equivalent to 53 percent of the standard deviation of math grades in the boarding school. Because school marks in France are not digitized, we could not collect them for control students. Teachers in regular schools might have tougher marking standards for higher grades, in which case control students might also have experienced a decline of their marks following the lottery. To investigate this possibility, we conduct the following exercise. As students from the first cohort entered in 8th, 9th, or 10th grade, they thus went from 7th to 8th, 8th to 9th, or 9th to 10th grade. Transcripts in France usually include both a student’s mark and the average mark in her class. The dashed line on Figure 1 shows class averages in math at baseline for students who applied when they were in 7th, 8th, 9th, or 10th grade. Under the assumption that these four groups of students do not come from schools with very different marking standards, this line should be a good proxy of the “natural” year-on-year evolution of marks between these four grades. The three solid lines on Figure 1 show the evolution of marks after entering the school for boarders who joined in 8th, 9th and 10th grade, respectively. The dashed line is mostly flat: the only noticeable pattern is that class averages decrease by 1.2 points between 7th and 8th grade. On the contrary, the three solid lines all sharply decrease. Given that students who applied in 7th grade only account for 20 percent of the first cohort, only 1.2 × 0.2/2.1 =11 percent of the sharp decline in marks this cohort experienced can be attributed to the mechanical evolution of school marks across grades. The remainder seems attributable to harsher grading standards in the boarding school.
0 5 10 15 20 Students' Marks 7 8 9 10 Students' Grades
After entering the school Usual evolution
Figure 1: Evolution of Students’ Mathematics Marks
The dashed line shows class averages in math at baseline in the classes of students who applied to the boarding school when they were in 7th, 8th, 9th, or 10th grade. This is a proxy for how boarders’ marks would have evolved if they had stayed in their original schools. The three solid lines show the evolution of marks before and after entering the boarding school, for boarders who joined in 8th, 9th and 10th grade, respectively.
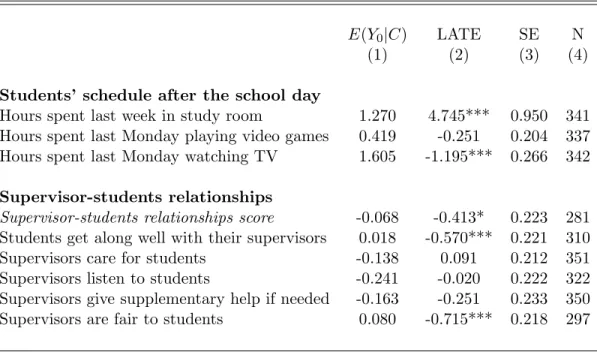
Boarders also have to cope with longer studying days and stricter disciplinary rules. Stu-dents do not have more class hours in the boarding school than in a regular school, but at the end of their school day they have to spend one hour and a half in a study room in which they are monitored by a supervisor to do their homework. In control schools, spending some time after the school day in a study room is only a non-mandatory option available to students. This is why treated students report spending six hours per week in a study room, against one hour and fifteen minutes for those in the control group, as shown in Table 5. Access to TV is strictly regulated in the boarding school, and playing video games is, in theory at least, forbidden. Consequently, treated students report watching TV only 25 minutes per day, against 1 hour and 36 minutes for controls. They also report spending less time playing video games, but the difference is not statistically significant. From the end of the school day to the moment they go to bed, boarders are monitored by supervisors, who have to enforce stringent disciplinary rules. For instance, students have to wear formal school uniforms, a very unusual practice in French schools. This seems to generate conflicts between them and students: our students-supervisor relationship score is 41.3 percent of a standard deviation lower in the boarding school than in control schools.
rem-Table 5: Students’ experience outside the classroom
E(Y0|C) LATE SE N
(1) (2) (3) (4)
Students’ schedule after the school day
Hours spent last week in study room 1.270 4.745*** 0.950 341
Hours spent last Monday playing video games 0.419 -0.251 0.204 337
Hours spent last Monday watching TV 1.605 -1.195*** 0.266 342
Supervisor-students relationships
Supervisor-students relationships score -0.068 -0.413* 0.223 281
Students get along well with their supervisors 0.018 -0.570*** 0.221 310
Supervisors care for students -0.138 0.091 0.212 351
Supervisors listen to students -0.241 -0.020 0.222 322
Supervisors give supplementary help if needed -0.163 -0.251 0.233 350
Supervisors are fair to students 0.080 -0.715*** 0.218 297
Notes. This table reports results from 2SLS regressions of several dependent variables on a constant, a dummy for being enrolled in the school and the statistical controls listed in Section 2.2, using our lottery offer as an instrument. Column (2) reports the coefficient of the dummy (η1 in equation 1). Standard errors in column
(3) are robust. Column (1) reports an estimate of the mean of the outcome for compliers not enrolled in the school. We use propensity score reweighting to control for lottery strata. The last column displays the number of observations. We use only one observation per student, two years after the lottery. All the variables come from students’ questionnaires. The supervisor-students relationships score is standardized; it is computed from the variables listed below. *significant at 10%; **significant at 5%; ***significant at 1%.
iniscent of French “Classes Pr´eparatoires” and English and American upper-class boarding schools. Indeed, the important concentration of resources on a small number of students, the interactions with qualified and engaged teachers, the high academic demands, the long school days, and the strict disciplinary rules are common features of all these schools.
4
Effects of the boarding school on students cognitive
out-comes
4.1 Effects on the average of test scores
This section presents the impacts of the boarding school on test scores in French and math-ematics, one year and two years after the lottery. We present first-stage, intention-to-treat and two-stage least squares estimates in Table 6.
Panel A in Table 6 displays the first-stage estimates. Specifically, we estimate the following equation: Sit= γ01{t = 1} + γ1Zi× 1{t = 1} + γ21{t = 2} + γ3Zi× 1{t = 2} + X 0 iζ11{t = 1} + X 0 iζ21{t = 2} + εit. (2) Si1 and Si2 respectively denote the total number of years that student i has spent in the
boarding school by the end of the first and second academic years after randomization;9
1{t = 1} and 1{t = 2} are dummies for first and second year; Xi is the vector of statistical
controls listed in Section 2.2; Ziis a dummy for students in the treatment group;10and εitis a
residual. Standard errors are clustered at the student level to account for the fact Si1and Si2
are correlated. γ1 and γ3 are respectively equal to the difference between lottery winners’ and
losers’ average years of enrollment one and two years after the lottery. Estimates of γ0, γ1,
and γ3 are displayed in columns (1), (2), and (4) of panel A. Column (6) reports the p-value
of a test of γ1= γ3.
Panel B displays coefficients of the same regressions but with students’ French or math-ematics test score as the outcome variable. Finally, Panel C displays coefficients of the corresponding 2SLS regression where Zi× 1{t = 1} and Zi× 1{t = 2} are used to instrument
Si1× 1{t = 1} and Si2× 1{t = 2}.
Panel A in Table 6 shows that, at the end of the first year, lottery losers had spent 5.3 percent of a year in the boarding school on average. This reflects the fact that about 6 percent of them entered the boarding school during the first year, and most of them stayed for the
9
Si1∈ [0, 1] and Si2 ∈ [0, 2] do not only take integer values: some students dropped out from the boarding
school during the academic year, in which case we compute fractions of years based on the number of days actually spent in the boarding school.
year. At that point, lottery winners had spent on average 0.766 more years at the boarding school than control students. Two years after the randomization, they had spent 1.328 more years there.
Panel B in Table 6 displays intention-to-treat (ITT) estimates, i.e. estimates of the effect of winning the lottery on students’ French and mathematics test scores. Lottery winners start outperforming losers only two years after the lottery, and only on their mathematics scores. After one year, estimates of the effect of winning the lottery on French and mathematics scores are small and not statistically different from zero. After two years, the point estimate in French is still rather small and not significant. On the contrary, the point estimate in mathematics is large and significantly different from zero: by then, lottery winners score 28.0 percent of a standard deviation higher than losers.11 As this panel contains four different estimates of the effect of the boarding school on test scores, one might worry that this significant effect might be a false positive. However, its Bonferroni adjusted p-value is 0.05 (see Abdi, 2007), the Bonferroni adjustment being conservative here because the four outcomes in the panel are highly correlated. The chances that this effect is actually a false positive are low. Finally, the effects on mathematics scores after one and two years significantly differ at the 1 percent level.
Panel C in Table 6 displays the 2SLS estimates corresponding to the first-stage and reduced-form estimates in the upper part of the table. These can be interpreted as local average treatment effects estimates, i.e. estimates of the average effect of spending one year in the boarding school among students who complied with their lottery offer (see Angrist & Imbens, 1995).
Two years after the lottery, the magnitude of our 2SLS estimates is consistent with pre-vious findings from the literature. At this date, our estimates indicate that the boarding school increases compliers’ mathematics scores by 21.3 percent of a standard deviation per year spent in the school. Furthermore, it has no effect on scores in French. Research studying the effects of educational policies in middle and high school has often found low or zero effects in language, and effects on mathematics scores similar to the one we show here. For instance, in the charter school literature, Dobbie & Fryer (2011) find that the Promise Academy School in Harlem increases students mathematics test scores by 23 percent of a standard deviation per year spent in the school, but has no effect on their English scores. In Boston, Abdulka-diroglu et al. (2011) and Angrist et al. (2010) find larger effects than those we report here, but they also find stronger effects in mathematics than in English (+35 percent versus +12 11The number of observations in mathematics and French are different, as these two tests were taken on
different days, as explained in Section 2. For instance, some students who took the French test missed the math test because they were sick on the day when it took place.
Table 6: Effect of the boarding school on test scores
Panel A: First stage estimates
Control mean FS after 1 year SE FS after 2 years SE FS 1 = 2 N (1) (2) (3) (4) (5) (6) (7) Years of treatment 0.053 0.766*** 0.038 1.328*** 0.086 0.000*** 719
Panel B: Intention to treat estimates
Control mean ITT after 1 year SE ITT after 2 years SE ITT 1 = 2 N (1) (2) (3) (4) (5) (6) (7) French 0.022 -0.065 0.107 -0.115 0.124 0.638 719 Mathematics 0.023 -0.037 0.096 0.280** 0.112 0.004*** 712
Panel C: Two stage least squares estimates
E(Y0|C) 2SLS after 1 year SE 2SLS after 2 years SE 2SLS 1 = 2 N
(1) (2) (3) (4) (5) (6) (7) French 0.011 -0.085 0.137 -0.087 0.092 0.989 719 Mathematics -0.030 -0.048 0.121 0.213** 0.083 0.019** 712
Notes. Panel A reports coefficients from a regression of the number of years spent in the school on a dummy for year 1, the interaction of this dummy with our lottery offer (column (2)), a dummy for year 2, the interaction of this dummy with our lottery offer (column (4)), and the statistical controls listed in Section 2.2 interacted separately with both year dummies, within the sample of students who took at least one cognitive test. Panel B reports coefficients from regressions of French and math test scores on the same explanatory variables, within the sample of students who took these tests. Panel C reports coefficients from 2SLS regressions of the French and math tests scores on a dummy for year 1, the interaction of this dummy with the number of years spent in the school after one year (column (2)), a dummy for year 2, the interaction of this dummy with the number of years spent in the school after two years (column (4)), and the statistical controls listed in Section 2.2 interacted separately with both year dummies, using our lottery offer interacted with the year 1 and year 2 dummies as instruments, within the sample of students who took these tests. Column (1) of this panel reports an estimate of the mean of French and math test scores for compliers not enrolled in the school. We use propensity score reweighting to control for lottery strata. Standard errors reported in columns (3) and (5) are clustered at the student’s level. In column (6), we report the p-value of a test of equality of the coefficients in columns (2) and (4). *significant at 10%; **significant at 5%; ***significant at 1%.
percent of a standard deviation per year spent in the school). There is no consensus yet on why many middle and high school interventions have larger returns on mathematics than on language test scores. Some cognitive psychologists have argued that language ability might be set during childhood while numerical ability might continue to evolve during adolescence (see e.g. Hopkins & Bracht, 1975) Also, language is acquired and manipulated at home, whereas mathematics is more exclusively a school topic - which may make it more dependent on teaching quality. One of the few exceptions to this language versus mathematics divide is Curto & Fryer (2014), who study the SEED Boarding School in Washington, D.C., the closest school to the one we study here for which causal effects on test scores are available. They find comparable effects to ours in mathematics, and larger effects in English (+23 and +20 percent of a standard deviation per year spent in the school, respectively). As a potential explanation for their result, the authors argue that boarding schools might be more efficient than other interventions at raising language ability if students speak no or little English in their home environment. We do not find evidence of this here: when we focus on students for whom French is not the only language spoken at home, we still find insignificant effects of the boarding school on their French test scores, even though we lack statistical power to make definitive conclusions.
Another way to assess the magnitude of these effects is to compare the cost-effectiveness of the boarding school to that of alternative interventions in France. In Behaghel et al. (2013), we find that the boarding school is about as cost-effective as class size reduction. Specifically, using administrative data, we show that the cost per student in the boarding school is about twice as large as in control schools (21,600 vs. 10,700 euros per year). This difference is mostly due to the boarding component of the program. The cost of the program is thus approximately the same as that of dividing class size by two.12 Using results from Piketty & Valdenaire (2006), we compute that a reduction in class size from 24 to 12 students increases test scores by 11.4% of a standard deviation among average middle- and high-school students (adding gains in maths and in French). This is close to our estimate of the total effect of the boarding school (+12.6% of a standard deviation, resulting from a -8.7% effect in French and a +21.3% effect in maths).
The results in Table 6 are robust to a number of changes in the specification. In Tables 15 and 16 in the Appendix, we show that results in Table 6 are robust to dropping the control variables, and to clustering standard errors at the classroom level. As all the variables in the regressions in Table 6 are interacted with 1{t = 1} and 1{t = 2}, their coefficients are algebraically equivalent to those we would obtain by running two separate regressions one
12
Dividing class size by two would almost double costs, as teachers’ salary account for most of the per-student cost in French middle and high schools.
and two years after the lottery. On the other hand, the standard errors of the coefficients are not the same in the pooled and in the separate regressions. In Table 18 in the Appendix, we estimate the regressions in Table 6 separately one and two years after the lottery. The differences between the standard errors of the coefficients are extremely small, and are not even visible when comparing the two tables where estimates are rounded up to the third digit.
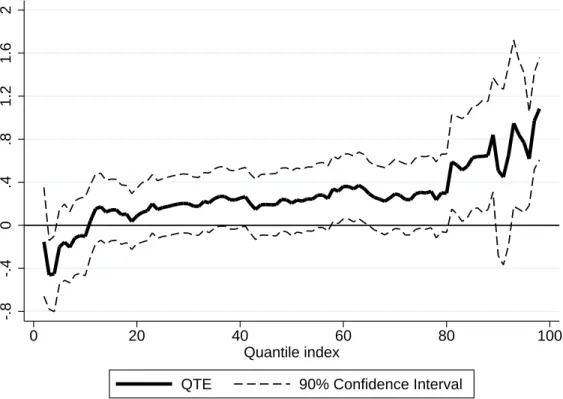
4.2 Distributional and heterogeneous effects.
We explore whether the average effects displayed in Table 6 hide heterogeneity along the distribution of the outcome. We focus on effects after two years in mathematics, as this is where average effects are statistically significant.13 Figure 2 displays unconditional quantile treatment effects (QTE), following Firpo et al. (2009), and using the indicator Zi as the
treatment variable. QTE estimates should therefore be compared to ITT estimates in Table 6, panel B (+0.280 of a standard deviation).14
Our lottery offer has a positive effect on the upper part of the distribution of the outcome, but has a negative effect on the lower part. Quantile treatment effects are: negative and significant in the lower decile, around -0.3 standard deviation of the outcome; positive and marginally significant in the middle of the distribution, around +0.3 standard deviation; large, positive, and significant in the upper quintile, around +0.7 standard deviation. Overall, the lottery offer produces a strong increase in the variance of the outcome.
13Results in French and after one year are available upon request. Most quantile treatment effects for these
outcomes are small and insignificant.
14As our treatment variable is not binary, we cannot use the instrumental variable quantile treatment effect
-.8 -.4 0 .4 .8 1.2 1.6 2 0 20 40 60 80 100 Quantile index
QTE 90% Confidence Interval
Figure 2: Quantile treatment effects in Mathematics after 2 years, intention-to-treat.
The graph displays unconditional quantile treatment effect estimates and their corresponding 90% confidence intervals, following Firpo et al. (2009), and using the lottery instrument Z as the treatment variable.
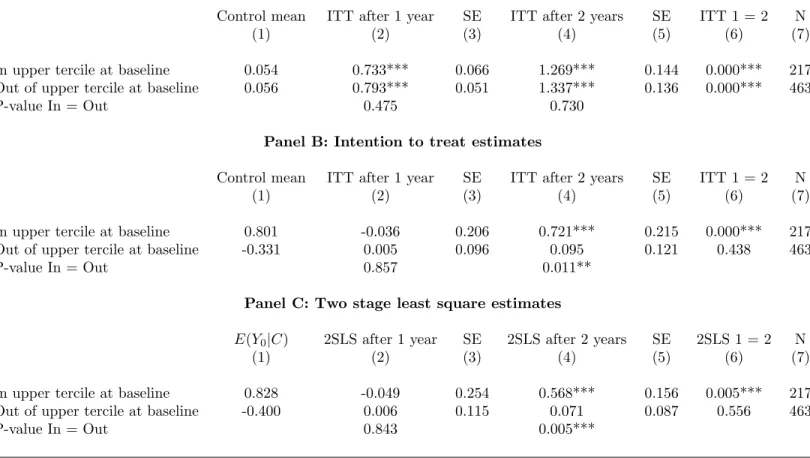
Under the assumption that the boarding school does not change the rank of a student in the distribution of mathematics scores, these findings imply that winning the lottery is mostly beneficial to the strongest students. To test the validity of this interpretation, we investigate heterogeneous treatment effects according to baseline ability in math. Given the sharp difference between quantile treatment effects in the upper part and in the rest of the distribution, we compare ITT estimates for students in the top tercile of baseline math scores and for those in the middle and bottom terciles.15 Table 7 reproduces Table 6 for those two
subgroups. Panel B shows that the 0.280 ITT effect of Table 6 is actually the average of a large, positive, and highly significant effect in the upper tercile (+0.721) and of a small and non significant impact in the other two terciles. These effects are not driven by the fact that weaker students are less likely to join the school, or more likely to leave between the two years (Panel A). Therefore, the 2SLS estimates are also very different in these two populations (Panel C).
15
When we disaggregate the middle and bottom terciles, we do not find any significant difference between the effects in these two terciles.
These highly heterogeneous effects have implications for papers using regression disconti-nuity designs in education research. Had the boarding school used an admission test to admit students and had we used an RD design to measure its effects, we would have found no effect or even a negative effect. But this estimate for students at the admission cut-off would have hidden large positive effects for students well above the cut-off.
To sum up, assignment to the boarding school has a large positive impact on math scores after two years, whose magnitude is comparable to available estimates of charter school im-pacts in the United States. However, two possibly more surprising results emerge: the positive value-added of the boarding school only appears after two years, and even at that time, it is mostly concentrated among students with higher initial ability. There is even evidence suggesting that a non-negligible share of lottery winners are actually harmed by the offer to enter the school.
5
Interpreting heterogeneous and delayed effects: are all
board-ers ready for boarding?
We have shown that the boarding school provides students with smaller classes, more engaged teachers, better peers, less classroom disruption, and more mandatory time spent each day in a study room. These improved inputs are available to boarders from their first year in the school.16 Yet, they translate into higher test scores after two years only, and only among
students with higher initial ability. In this section, we provide evidence that these limited effects may be due to the fact that students’ well-being is also an important input in the education production function. Initially, this input is negatively impacted by the boarding school, possibly cancelling the positive effects of other inputs.
When they arrive in the boarding school, students need to adjust to a number of negative changes. They have to cope with the separation from their friends and families; they relinquish a certain amount of freedom; and they face higher academic demands. This may explain why one year after the lottery, levels of school well-being were significantly lower among boarders, as shown in Table 8.17 At that date, as per our standardized score, lottery winners’ well-being
16
Tables 3 to 5 described the treatment by comparing schooling conditions for boarders and control students two years after the lottery. In Tables 19 to 21 shown in the Appendix, we reproduce similar tables, in which we also report the differences in schooling conditions for boarders and control students one year after the lottery, and the result of a test for whether the difference after one year significantly differs from that after two years. (Unfortunately, one year after the lottery not all measures are available for the first cohort of students, and, as a result, the samples in the supplementary tables are sometimes smaller than in the baseline tables.) There is little evidence that the nature or the intensity of the treatment changed between the two years: out of the 35 tests we conduct to assess these changes, only 4 have a p-value lower than 0.10.
Table 7: Heterogeneous effects, according to baseline mathematics scores
Panel A: First stage estimates
Control mean ITT after 1 year SE ITT after 2 years SE ITT 1 = 2 N (1) (2) (3) (4) (5) (6) (7) In upper tercile at baseline 0.054 0.733*** 0.066 1.269*** 0.144 0.000*** 217 Out of upper tercile at baseline 0.056 0.793*** 0.051 1.337*** 0.136 0.000*** 463 P-value In = Out 0.475 0.730
Panel B: Intention to treat estimates
Control mean ITT after 1 year SE ITT after 2 years SE ITT 1 = 2 N (1) (2) (3) (4) (5) (6) (7) In upper tercile at baseline 0.801 -0.036 0.206 0.721*** 0.215 0.000*** 217 Out of upper tercile at baseline -0.331 0.005 0.096 0.095 0.121 0.438 463 P-value In = Out 0.857 0.011**
Panel C: Two stage least square estimates
E(Y0|C) 2SLS after 1 year SE 2SLS after 2 years SE 2SLS 1 = 2 N
(1) (2) (3) (4) (5) (6) (7) In upper tercile at baseline 0.828 -0.049 0.254 0.568*** 0.156 0.005*** 217 Out of upper tercile at baseline -0.400 0.006 0.115 0.071 0.087 0.556 463 P-value In = Out 0.843 0.005***
Notes. The first line of Panel A reports coefficients from the same regression as that in Panel A of Table 6, within the sample of students who took at least one math test and who were in the first tercile of math scores in their lottery stratum at baseline. The second line reports the same coefficients from the same regression, within the sample of students who took at least one cognitive test and who were not in the first tercile of math scores in their lottery stratum at baseline. In column (2) (resp. (4)) of the third line of the panel, we report p-values of a test of equality of the coefficients reported in column (2) (resp. (4)) of the first and second lines. Accordingly, Panel B and C reproduce results for math scores in Panel B and C of Table 6, separately for students in and out of the first tercile of math scores at baseline. We use propensity score reweighting to control for lottery strata. Standard errors reported in columns (3) and (5) are clustered at the student’s level. In column (6), we report the p-value of a test of equality of the coefficients in columns (2) and (4). *significant at 10%; **significant at 5%; ***significant at 1%.
is reduced by 29.8 percent of a standard deviation. When we look separately at the eight items included in our score, we find two significant differences: boarders felt more uncomfortable in school, and they were more likely to think that other students did not like them. Also, although they are not significant, all the other effects point to a reduction in well-being.
In the end of their second year, students seem to have adjusted to their new environment. At this point, the well-being score is slightly higher for boarders than for control students, and we can reject at the 5 percent level that the effect of the boarding school is the same in year one and year two. We also measure the effect of the boarding school on students’ academic, social, and general self-esteem, using the French translation of the Self-Perception Profile for Adolescents (see Bouffard et al., 2002). The effect of the boarding school on students academic self-esteem is insignificant both after one year and after two years, but it significantly increases over time (p-value =0.071).
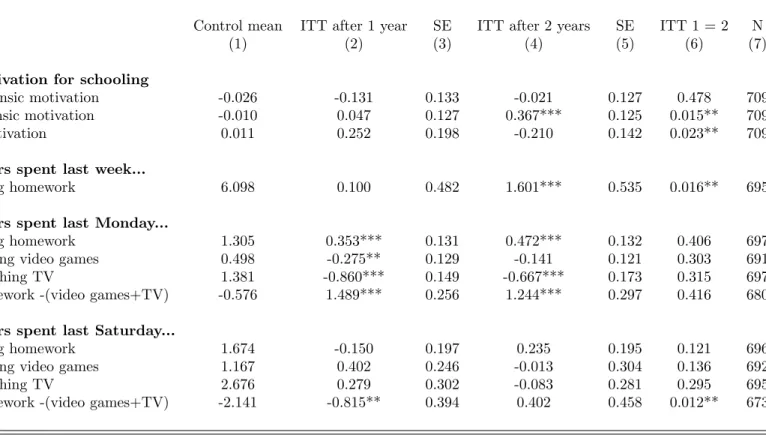
At the same time that levels of well-being catch-up, students’ motivation increases, and they start spending more time on their homework. To measure students’ motivation for schooling, we use the “motivation for education” scale (see Vallerand et al., 1989). Whereas one year after the lottery there were no noticeable differences between boarders and control students on any of its three sub-scales (extrinsic and intrinsic motivation, and amotivation), after two years boarders have more intrinsic motivation for schooling as shown in Table 9. Moreover, the effect of the school on students’ amotivation significantly decreases between year one and two.
Similarly, although after one year, boarders did not report spending more time per week on their homework, after two years lottery winners spend 25 percent more time on it than lottery losers. During school days, boarders spend more time on their homework and less time watching TV or playing video games. This effect is somewhat mechanical, merely reflecting the rules in the boarding school: differences are large and quite constant over time. The increase in total homework time during the second year seems to be driven by week-end behavior. Although we lack statistical power to make definitive conclusions, it seems that during the first year, treated students tend to compensate weekday effort by relaxing more during the week-end. After two years, this pattern has changed markedly: boarders now spend more time on their homework and less time watching TV or playing video games during the week-ends. This is consistent with the increase in their intrinsic motivation we observe between the first and the second year. None of these three evolutions between year one and two – time spent on homework, television and video games on Saturdays – are statistically significant, but the estimates all go in the same direction. To gain power, we compute the difference
Table 8: Effects of the school on well-being and self-esteem
Control mean ITT after 1 year SE ITT after 2 years SE ITT 1 = 2 N (1) (2) (3) (4) (5) (6) (7) School well-being
School well-being score 0.175 -0.298* 0.167 0.118 0.171 0.016** 352 In school, I feel like a stranger -0.094 0.149 0.160 -0.047 0.187 0.316 383 I have few friends 0.076 -0.018 0.176 0.017 0.180 0.859 383 I feel home 0.147 -0.186 0.184 0.230 0.153 0.072* 383 I feel uncomfortable -0.116 0.526*** 0.177 0.179 0.196 0.123 383 Other students like me 0.157 -0.403** 0.185 -0.036 0.181 0.157 352 I feel lonely -0.071 0.040 0.160 -0.014 0.158 0.793 383 I do not want to go -0.097 0.056 0.182 -0.049 0.167 0.583 383 I am often bored -0.108 0.233 0.176 -0.089 0.171 0.124 383 Self-Esteem Academic Self-Esteem 0.078 -0.137 0.111 0.081 0.129 0.071* 710 Social Self-Esteem 0.052 -0.018 0.151 0.030 0.136 0.685 709 General Self-Esteem 0.081 0.029 0.124 0.138 0.144 0.362 709
Notes. This table reports coefficients from OLS regressions of several dependent variables on a constant, a dummy for year 1, the interaction of this dummy with our lottery offer (column (2)), a dummy for year 2, the interaction of this dummy with our lottery offer (column (4)), and the statistical controls listed in Section 2.2 interacted separately with both year dummies, within the sample of students for whom these outcomes are available at least one year. For well-being, our estimation sample is the second cohort of students, as well-being measures are not available one year after the lottery for the first cohort. We use propensity score reweighting to control for lottery strata. Standard errors reported in columns (3) and (5) are clustered at the student’s level. In column (6), we report the p-value of a test of equality of the coefficients in columns (2) and (4). All the variables come from students’ questionnaires. The school well-being score is standardized; it is computed from the variables listed below. Self-esteem scores are also standardized and are based on Bouffard et al. (2002). *significant at 10%; **significant at 5%; ***significant at 1%.
between homework and “screen-time”, so as to concentrate this consistent information into one coefficient. Both the substitution between homework and screen time on Saturdays during the first year and the reversal after the second year are now significant.
Table 9: Effects of the school on students motivation and effort
Control mean ITT after 1 year SE ITT after 2 years SE ITT 1 = 2 N (1) (2) (3) (4) (5) (6) (7) Motivation for schooling
Extrinsic motivation -0.026 -0.131 0.133 -0.021 0.127 0.478 709 Intrinsic motivation -0.010 0.047 0.127 0.367*** 0.125 0.015** 709 Amotivation 0.011 0.252 0.198 -0.210 0.142 0.023** 709 Hours spent last week...
Doing homework 6.098 0.100 0.482 1.601*** 0.535 0.016** 695 Hours spent last Monday...
Doing homework 1.305 0.353*** 0.131 0.472*** 0.132 0.406 697 Playing video games 0.498 -0.275** 0.129 -0.141 0.121 0.303 691 Watching TV 1.381 -0.860*** 0.149 -0.667*** 0.173 0.315 697 Homework -(video games+TV) -0.576 1.489*** 0.256 1.244*** 0.297 0.416 680 Hours spent last Saturday...
Doing homework 1.674 -0.150 0.197 0.235 0.195 0.121 696 Playing video games 1.167 0.402 0.246 -0.013 0.304 0.136 692 Watching TV 2.676 0.279 0.302 -0.083 0.281 0.295 695 Homework -(video games+TV) -2.141 -0.815** 0.394 0.402 0.458 0.012** 673
Notes. This table reports coefficients from OLS regressions of several dependent variables on a constant, a dummy for year 1, the interaction of this dummy with our lottery offer (column (2)), a dummy for year 2, the interaction of this dummy with our lottery offer (column (4)), and the statistical controls listed in Section 2.2 interacted separately with both year dummies, within the sample of students for whom these outcomes are available at least one year. We use propensity score reweighting to control for lottery strata. Standard errors reported in columns (3) and (5) are clustered at the student’s level. In column (6), we report the p-value of a test of equality of the coefficients in columns (2) and (4). All the variables come from students’ questionnaires. Motivation scores are standardized; they are computed from the “motivation for education” scale (see Vallerand et al. (1989)). *significant at 10%; **significant at 5%; ***significant at 1%.
Finally, we find some indication that the initial negative shock on well-being and motiva-tion is more pronounced among weaker students, and that the recovery is faster for stronger students, although we lack statistical power to make definitive conclusions. This could explain why even after two years, only high-performing students seem to benefit from the school. In Table 10, we report ITT effects of the school on the outcomes of Tables 8 and 9 for which we found different effects after one and two years, distinguishing students in the upper tercile of math scores at baseline from those in the middle and bottom terciles. After one year, weaker students have more negative effects on each of these five outcomes, even though none of the