HAL Id: hal-02405933
https://hal.archives-ouvertes.fr/hal-02405933
Submitted on 11 Dec 2019
HAL is a multi-disciplinary open access
archive for the deposit and dissemination of
sci-entific research documents, whether they are
pub-lished or not. The documents may come from
teaching and research institutions in France or
abroad, or from public or private research centers.
L’archive ouverte pluridisciplinaire HAL, est
destinée au dépôt et à la diffusion de documents
scientifiques de niveau recherche, publiés ou non,
émanant des établissements d’enseignement et de
recherche français ou étrangers, des laboratoires
publics ou privés.
Potential impact of thermal effects during ultrasonic
neurostimulation: retrospective numerical estimation of
temperature elevation in seven rodent setups
Charlotte Constans, Philippe Mateo, Mickaël Tanter, Jean-François Aubry
To cite this version:
Charlotte Constans, Philippe Mateo, Mickaël Tanter, Jean-François Aubry. Potential impact of
ther-mal effects during ultrasonic neurostimulation: retrospective numerical estimation of temperature
elevation in seven rodent setups. Physics in Medicine and Biology, IOP Publishing, 2018, 63 (2),
pp.025003. �10.1088/1361-6560/aaa15c�. �hal-02405933�
Potential impact of thermal effects during
ultrasonic neurostimulation : retrospective
numerical estimation of temperature elevation
in seven rodent setups
Charlotte Constans
1, Philippe Mateo
1, Mickaël Tanter
1, Jean-François Aubry
1Abstract
In the past decade, a handful but growing number of groups have reported worldwide successful low intensity focused ultrasound induced neurostimulation trials on rodents. Its effects range from movement elicitations to reduction of anesthesia time or reduction of the duration of drug induced seizures. The mechanisms underlying ultrasonic neuromodulation are still not fully understood. Given the low intensities used in most of the studies, a mechanical effect is more likely to be responsible for the neuromodulation effect, but a clear description of the thermal and mechanical effects is necessary to optimize clinical applications. Based on five studies settings, we calculated the temperature rise and thermal doses in order to evaluate its implication in the neuromodulation phenomenon.
Our retrospective analysis shows thermal rise ranging from 0.002°C to 0.8°C in the brain for all setups, except for one setup for which the temperature increase is estimated to be as high as 7°C. We estimate that in the latter case, temperature rise cannot be neglected as a possible cause of neuromodulation. Simulations results were supported by temperature measurements on a mouse with two different sets of parameters. Although the calculated temperature is compatible with the absence of visible thermal lesions on the skin, it is high enough to impact brain circuits. Our study highlights the usefulness of performing thermal simulations prior to experiment in order to fully take into account not only the impact of the peak intensity but also pulse duration and pulse repetition.
Introduction
In the 50s and 60s, Fry et al 1–6 were pioneers in inducing reversible changes on nervous structures: they altered the activity of an excised crayfish ventral nerve cord and the visual nervous system of a cat. Lele et al7 induced similar effects on peripheral nerves of cat, monkey and humans. Interestingly, some of these studies highlighted the dependence of the results on temperature5,7: Lele et al7 found the threshold dose for ultrasound-induced activity on peripheral nerves to be inversely proportional to ambient temperature. They additionally thermally induced activity in nerves by local application of heat, with similar or better results than ultrasonic radiation, demonstrating the existence of a temperature-mediated mechanism for neurostimulation. However, the predominance of non-thermal effects was demonstrated as early as 19506 by showing an ultrasound induced reduction of activity in a crayfish ventral abdominal nerve cord while the modest temperature rise, estimated to 1°C by the authors, had been shown to increase the firing frequency of this type of neurons8.
More recently, reversible effects on animals’ central nervous system were elicited with reduced ultrasound dosages, giving a new momentum to ultrasonic neuromodulation. Tyler and his group9,10 were the firsts to elicit movements in anesthetized rodents, with pressure amplitudes as low as 50 kPa in the brain. In 2012, Yang et al11 demonstrated that low intensity focused ultrasound reduced extracellular GABA levels in rats. In 2013, Younan et al12 reproduced Tyler’s motor elicitation results and reported a pressure threshold below which no elicitation could be seen. Trials were also broaden to larger species. Yoo et al. stimulated the somatosensory and visual areas of anesthetized rabbit13 and sheep14 under MRI guidance, with electrophysiological recordings. Pouget and colleagues reported behavioral changes15 and single neuron discharges16 during antisaccade tasks after transcranial ultrasound application in the frontal eye field of awake monkeys; in human volunteers, somatosensory sensations were modulated by Legon et al9 and elicited by Lee et al17. Based on these low (sub-MHz) frequency results, some groups proposed to increase the frequency so as to reach a better accuracy: King et al18 and Ye et al.19 investigated the frequency dependence of neurostimulation in mice up to 2.9 MHz, Li et al.20 moved forward along this path with 5 MHz sonications on mice and more recently Kamimura et al.21 showed cortical and subcortical neuromodulation at 1.9 MHz on mice.
Several models, based on either thermal or mechanical effects, have been proposed to explain the ultrasonic neuromodulation effects and are explained in detail in Sassaroli et al. review22. The soliton model23 considers the action potential as a propagating density pulse (soliton), and therefore an electromechanical phenomenon that can be affected by an ultrasonic mechanical wave. It relies on thermodynamics and phase behavior of the lipids in the cell membrane, and thus depends on the temperature. The flexoelectric model24 hypothesizes that the mechanical bending induced by the ultrasound on the membrane leads to a change in its electric potential, impacting the state of the ionic channels. The activation of voltage-gated sodium and calcium channels by intensity, low-frequency ultrasound was demonstrated experimentally by Tyler et al.25. In parallel, Ibsen et al.26 highlighted experimentally the role of mechanotransduction channels in the response of C. elegans to ultrasound stimulation. Plaksin et al27 proposed an intramembrane cavitation model as a bio-piezoelectric mechanism for ultrasonic brain stimulation. Their model shows that intensity activation thresholds increase with ultrasound frequency and decrease with pulse duration at a fixed stimulation frequency. This is in line with the fact that previously cited teams increased either the acoustic intensity18,20 or the sonication time11,12,19,20, compared to the low values used by Tyler10, in order to induce neuromodulation at higher frequencies. Increasing the acoustic intensity and/or the sonication time is known to increase the thermal rise28,29.
In this study, we analyze retrospectively a selection of recent studies performed in rodents only in order to estimate the thermal rise in the central nervous system and the skull. Younan et al.12, Ye et al.19, Li et al.20, Yang et al.11 and Kamimura et al.21 were selected in order to cover a large range of frequencies (320 kHz, 500 kHz, 650 kHz, 1 MHz, 1.4 MHz, 1.9 MHz and 5 MHz). 3D simulations using a K-space pseudo spectral method30 were performed in order to simulate the ultrasonic field in the head, based on the respective parameters and transducer shape and location reported in the studies. Thermal rise was then simulated by solving the bioheat equation.
Additionally, we experimentally measured the thermal rise during sonication on a mouse head, using the ultrasound parameters of two different setups for which the simulations highlighted a significant difference in thermal rise.
Methods Simulations
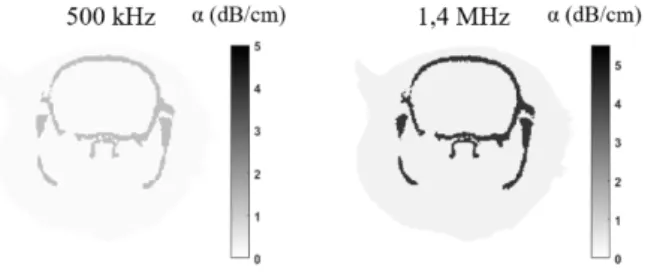
The acoustic propagation of focused ultrasound was simulated in an entire rat head in order to investigate the pressure amplitude and spatial distribution. The simulations were performed with k-Wave [6], a k-space pseudospectral method-based solver. 3D maps of the skull, brain and tissues were extracted from a rat microcomputed tomography scan (80 µm resolution). Brain and tissues were assumed to have the same sound-speed and density as water (ρwater=1000 kg/m3 and cwater =1500 m/s) and the transducer was modeled according to each study’s materials (table 2), as explained in more details in a previous work31. Absorption was taken into account in the skull (α =2.7dB/cm/MHz-1.18) and in the brain (α =0.21dB/cm/MHz-1.18) with a 1.18 power law of frequency32 (figure 1). The Courant–Friedrichs–Lewy number was set to 0.2.
Figure 1. Coronal view of absorption maps at 500 kHz (left) and 1.4 MHz (right)
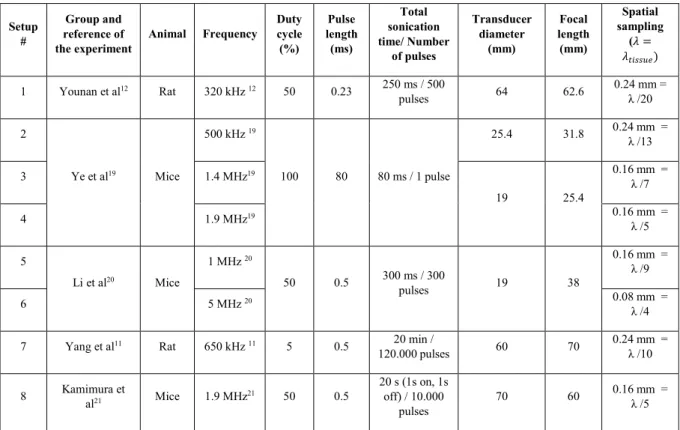
The geometry of the transducer was reproduced according to the materials and methods of each study. The transducer frequency, diameter and focal length are summarized in table 1, together with the duty cycle, pulse length, and total sonication time. The spatial sampling of the simulation is also provided in table 1.
Table 1. Parameters and results in brain and at the focal spot
It was assumed for all simulation a perfect coupling between the transducer and the rat head by filling a coupling cone with water. The geometrical focal point is located inside the brain, according to the description found in the papers.
For setups #1, 4, 5, 6, 7, we first calculated the pressure at the focal spot in water based on the data provided by each study materials and methods (table 2). In Younan et al case (setup #1)12, the pressure at focus in water was directly reported. Li et al (setup #4 and 5)20 reported the estimated ISPPA in the brain and the transmission coefficients used for that calculation, so we could calculate back the pressure in water based on that information. Similarly, Yang et al (setup #6)11 and Kamimura et al (setup #7)21 provided the estimated peak pressure in the brain and the transmission coefficients, allowing to recover the pressure value in water. For Ye et al study (setup #2 and 3) 19, the article did not report the calibrated value of pressure in water or transmission but they provided their own estimation of the peak pressure in brain. We used it to rescale the pressure field obtained with our simulations. Amongst all the experiments performed by Ye et al, we selected the ones achieved with a reported 3W/cm² ISPPA at focus (corresponding to success rates of 0.5 at 500 kHz and 0.2 at 1.4 MHz), corresponding to a 0.3 MPa pressure in the brain. We also selected their 1.9MHz experiment at the highest ISPPA (90W/cm²) to establish a comparison with setup #8 and reproduce the procedure on a mouse while monitoring the temperature. The simulations were first performed in water to determine the acoustic intensity to apply on the simulated transducer surface in order to produce the same pressure amplitude at focus in water. The same acoustic power was then applied on the surface of the transducer for the simulation of the propagation in the rat head. The peak negative pressure in the rat head was extracted from the simulation and thus takes into account reflections and absorption effects.
Setup #
Group and reference of
the experiment Animal Frequency
Duty cycle (%) Pulse length (ms) Total sonication time/ Number of pulses Transducer diameter (mm) Focal length (mm) Spatial sampling (𝜆𝜆 = 𝜆𝜆𝑡𝑡𝑡𝑡𝑡𝑡𝑡𝑡𝑡𝑡𝑡𝑡) 1 Younan et al12 Rat 320 kHz 12 50 0.23 250 ms / 500 pulses 64 62.6 0.24 mm = λ /20 2 Ye et al19 Mice 500 kHz 19 100 80 80 ms / 1 pulse 25.4 31.8 0.24 mm = λ /13 3 1.4 MHz19 19 25.4 0.16 mm = λ /7 4 1.9 MHz19 0.16 mm = λ /5 5 Li et al20 Mice 1 MHz 20 50 0.5 300 ms / 300 pulses 19 38 0.16 mm = λ /9 6 5 MHz 20 0.08 mm = λ /4 7 Yang et al11 Rat 650 kHz 11 5 0.5 20 min /
120.000 pulses 60 70 0.24 mm = λ /10 8 Kamimura et al21 Mice 1.9 MHz21 50 0.5 20 s (1s on, 1s off) / 10.000 pulses 70 60 0.16 mm = λ /5
Table 2. Estimated pressures in water based on the reported data.
The thermal modeling is based on the bio-heat equation33: ρC∂T∂t = κ∇2T + q + w𝜌𝜌
𝑏𝑏𝐶𝐶𝑏𝑏(𝑇𝑇 − 𝑇𝑇𝑎𝑎)
where T, ρ, C, κ and q are the temperature, density, specific heat, thermal conductivity and rate of heat production defined as q = αPPP2ρC, α being the absorption. The last term corresponds to the perfusion process, w, 𝜌𝜌𝑏𝑏,𝐶𝐶𝑏𝑏 and 𝑇𝑇𝑎𝑎 being the blood perfusion rate, blood density, blood specific heat and blood ambient temperature respectively. These parameters are taken homogeneous over the brain, although a more detailed description of the brain cooling processes can be found in the litterature34.
The bioheat equation is solved by using a finite-difference scheme in Matlab (Mathwork, Natick, USA) with Dirichlet boundary conditions (T=37°C on boundaries). Simulations were run over the entire sonication time for each setup except for setup #7 for which the memory requirement were too high for a 20 min sonication. Computation lasted for 200s only for setup #8, which was enough to reach the steady state (see results). The cooling time was adjusted to allow the temperature to go back to baseline (less than 0.02°C above baseline for all setups, except for setup #8 for which the temperature was still 0.1°C above baseline 10s after the last sonication. The thermal dose was introduced to estimate tissue damage under thermal stress 35. It is given by
TD = ∫ R43−Tdt
where R=0.25 if T<43 and R=0.5 if T>43. Its unit is CEM (cumulative equivalent minutes at 43°C).
Model validation
We compared the temperature rise estimated with our code and with the FDA HIFU simulator36 for the propagation of 0.5 MHz, 1 MHz and 1.5 MHz ultrasound continuous waves by a single-element transducer with a 1.25 cm diameter and 4 cm focusing in homogeneous tissue with HIFU simulator default absorption value (5.8 dB/cm/MHz-1.1). The tissue properties are summarized in Table 3. The perfusion parameters are taken from Pulkkinen et al37: w = 0.008𝑠𝑠−1, 𝜌𝜌
𝑏𝑏 = 1030 𝑘𝑘𝑘𝑘/𝑚𝑚3, 𝐶𝐶𝑏𝑏= 3620 𝐽𝐽/𝑘𝑘𝑘𝑘/𝐾𝐾 and 𝑇𝑇𝑎𝑎= 37 °𝐶𝐶.
The FDA HIFU simulator solves the Khokhlov-Zabolotskaya-Kuznetsov (KZK) equation. As the KZK equation is valid for angles smaller than 20°38, the FDA HIFU simulator recommends using an f-number higher than 1.37. Therefore the transducer geometry was designed with an f-number higher than twice this recommended value.
Setup # Group and reference of the experiment Frequency Reported value for Isppa or pressure in brain Reported value for peak pressure in brain Reported Transmission used for the in situ estimation Reported pressure at focus in water Calculated pressure at focus in water Simulated pressure at focus in water
1 Younan et al12 320 kHz - - - 0.68 MPa - 0.68 MPa
2 Ye et al19 500 kHz 3W/cm² - - - - 0.3 MPa 3 1.4 MHz - - - - 0.3 MPa 4 1.9 MHz 90 W/cm - - - - 1.6 MPa 5 Li et al20 1 MHz 210 mW/cm² - 89% - 0.12 MPa 0.12 MPa 6 5 MHz - 38% - 0.19 MPa 0.19 MPa 7 Yang et al11 650 kHz - 0.49 MPa 87% - 0.56 MPa 0.56 MPa 8 Kamimura et al21 1.9 MHz - 1.79 MPa 68% - 2.6 MPa 2.6 MPa
Density
(kg/m3) Sound speed (m/s) Absorption (Np/m/MHz
-1.18) Specific heat (J/kg/K) Thermal conductivity (W/m/K)
Bone 1850 2400 3139 130040 0.440
Tissue 1000 1500 2.432 360040 0.52840
Table 3. Tissue properties for simulations
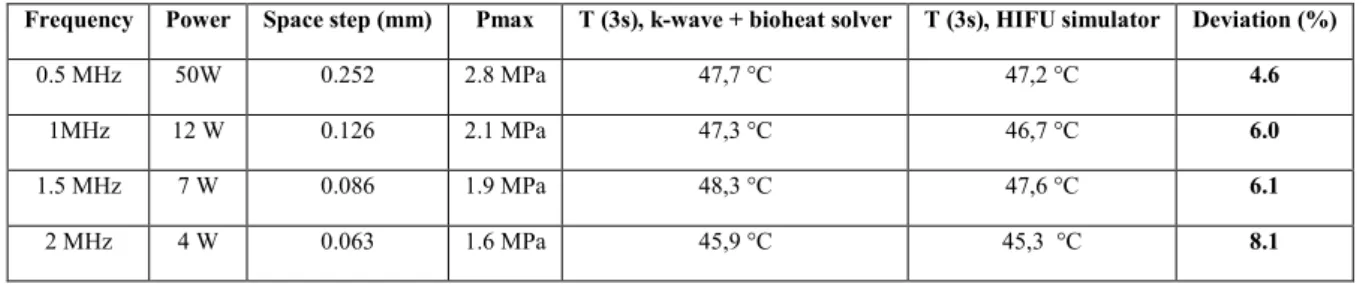
Table 4. Validation of the numerical model with a comparison with HIFU simulator in the 0.5 – 2MHz range: results. For each frequency the power was adjusted so that the temperature rise would be about 10°C after 3 seconds of sonication. The space step used in k-wave was set to the one defined by HIFU simulator. The pressure field from k-Wave propagation was then rescaled so that the maximum pressure amplitude matches the one from HIFU simulator, and the thermal parts were run separately to compare the maximum temperatures. The main parameters and results of the simulations are listed in table 4. The deviation between the thermal results remains below 9% for all frequencies and is partly due to the difference of pressure field after propagation, that is itself a consequence of the difference between the models (HIFU simulator solves the Khokhlov-Zabolotskaya-Kuznetsov (KZK) equation, k-wave uses a k-space pseudo-spectral solver). The pressure profiles in the axial direction as well as the temperature rise for 2 MHz are plotted in Figure 2.
Figure 2. Model validation: pressure profile (up) and temperature rise (bottom) with k-Wave30 (left) and HIFU simulator 36
(right)
Frequency Power Space step (mm) Pmax T (3s), k-wave + bioheat solver T (3s), HIFU simulator Deviation (%)
0.5 MHz 50W 0.252 2.8 MPa 47,7 °C 47,2 °C 4.6
1MHz 12 W 0.126 2.1 MPa 47,3 °C 46,7 °C 6.0
1.5 MHz 7 W 0.086 1.9 MPa 48,3 °C 47,6 °C 6.1
Measurements of temperature rise in mouse
Ex-vivo measurements were performed on a mouseenrolled in the project "Etude de la plasticité cérébrale dans le cerveau adulte, associée à deux modèles animaux de troubles psychiatriques/neurologiques" (Study of cerebral plasticity in the adult brain, associated with two animal models of psychiatric/neurologic disorders) validated by the Comité d’Ethique en Expérimentation Animale n°59 under the reference 2015-23. Since this protocol ends with euthanasia, we could perform the neurostimulation sequence and temperature measurements immediately after sacrifice.
The mouse (c57Bl/6JRj, 3 months old, 34g) was anesthetized with ketamine (80mg/kg) and xylazine (20 mg/kg) and sacrificed with pentobarbital (800 mg/kg). The injections were intraperitoneal. The measurements were performed right after sacrifice and lasted less than an hour.
We used a single element transducer (center frequency: 2.25MHz, focal length: 2cm, diameter: 2.2cm, Imasonic, Voray sur L’Ognon, France) at the frequency of 2 MHz, identical to the one used previously in 41. The transducer was mounted with a 50µm thick latex membrane (Durex, Reckitt Benckiser, Slough, United Kingdom), in front of the active piezoelectric material. The cavity between the transducer and the membrane was filled with degassed water. The animal’s head was shaved with a depilatory cream (Klorane, France). The signal was generated with a digital function generator (Handyscope HS5, TiePie engineering, Sneek, The Netherlands) and amplified with a 75-Watts amplifier (75A250A, Amplifier Research, Souderton, PA). The output voltage was monitored with an oscilloscope (DPO 3034, Tektronix, France). The transducer was previously calibrated on a custom-built heterodyne interferometer (compact heterodyne probe of the Mach-Zehnder type described previously42) leading to a direct relation between the voltage and the pressure at focus in water.
Temperature was monitored by a Copper-Constantan thermocouple (Type T, 0.010 in diameter, Omega, Stamford, CT) subcutaneously introduced in the mouse head skin above the skull, using a 18G needle. Recording was achieved by an acquisition board (TC-08, Pico Technology, Cambridgeshire, UK) connected to a PC. The transducer was positioned with a mechanical gantry to target the brain with the thermocouple, with the thermocouple at the center of the ultrasonic wave axis.
We aimed at reproducing the ultrasound sonications of setups #4 19 (1.9 MHz, 1.6 MPa in the brain, 80 ms single pulse) and #8 21 (1.9MHz, 1.9MPa in the brain, 50% duty cycle for 1s followed by 1s of cooling, total sonication time 20 s). However, as the transducer could not deliver enough power at 1.9 MHz, we set the frequency to 2 MHz (closer to the center frequency, 2.25MHz). We assumed a transmission coefficient of 68% through the mouse skull, so the input voltages were set to 34V and 38V,corresponding to 2.3 MPa and 2.6 MPa pressure amplitude in water, for setups #4 and #8 respectively.
Results Simulations
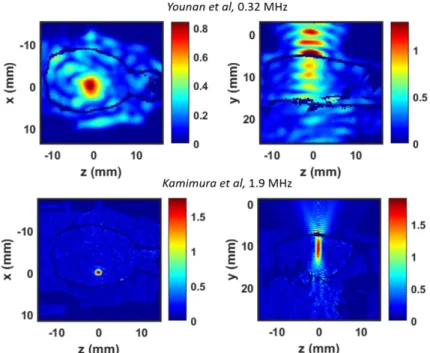
3D pressure fields were obtained for all simulations. Figure 3 shows a typical low frequency (320 kHz, top) and high frequency (1.9 MHz, bottom) pressure field. The maximal pressure amplitude in the brain is 0.95 MPa at 320 kHz and 1.86 MPa at 1.9 MHz. According to the experimental setup, the target was located in the left hemisphere for the 1.9 MHz sonication21.
Figure 3. Peak pressure fields in rat brain at 0.32kHz (up) and 1.9MHz (bottom), based on Younan et al12 and Kamimura et
al21 parameters, respectively. Axial planes (left) and sagittal planes (right) are presented. In sagittal plane, the transducer is
located above the head, on the top of the image.
Table 5 summarizes the sonication parameters (duty cycle, pulse length, sonication time, and transducer characteristics) and the result of the simulations: peak pressure in the brain, maximum temperature in the brain and at focal spot. In all cases but setups #4 and #8, the maximum pressure in the brain is below 1 MPa.
Table 5. Parameters and results in brain and at the focal spot. Baseline temperature is assumed to be 37°C. Temperature rise estimated for setup #112 and setup #821 are plotted on figure 4 and 5 respectively at the focal spot (left) and at the most heated point in the brain (right), with a zoom on individual bursts.
Setup # Group and reference of the experiment
Frequency Duty cycle (%) Pulse length (ms) Total sonication time Maximum pressure in brain (MPa) Temperature at focal spot (temperature rise ΔT (°C) ) Max temperature in brain (temperature rise ΔT (°C) ) 1 Younan et al12 320 kHz 12 50 0.23 250 ms 0.95 37.01 (ΔT=0.01) 37.06 (ΔT=0.06) 2 Ye et al19 500 kHz 19 100 80 80 ms 0.30 37.001 (ΔT=0.001) 37.007 (ΔT=0.007) 3 1.4 MHz19 37.002 (ΔT=0.002) 37.02 (ΔT=0.02) 4 1.9 MHz19 1.6 37.07 (ΔT=0.07) 37.8 (ΔT=0.8) 5 Li et al20 1 MHz 20 50 0.5 300 ms 0.12 37.0005 (ΔT=0.0005) (ΔT=0.006) 37.006 6 5 MHz 20 0.16 37.003 (ΔT=0.003) 37.07 (ΔT=0.07) 7 Yang et al11 650 kHz 11 5 0.5 20 min 0.45 37.03 (ΔT=0.03) 37.07 (ΔT=0.07) 8 Kamimura et al21 1.9 MHz21 50 0.5 20 s (1s on, 1s off) 1. 9 38.3 (ΔT=1.3) 44.0 (ΔT=7.0)
Figure 4 Estimated temperature rise at 320kHz12
Figure 5. Estimated temperature rise at 1.9MHz21
Measurements of temperature rise in mouse
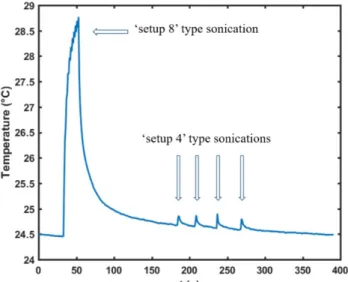
Figure 6 displays the temperature measurements during the sonications: one “setup #8” type sequence followed by four successive “setup #4” type sequences. This value of thermal rise (4.3°C for setup #8 type sonication and 0.3°C for setup #4 type sonication) was found for two different positions, while the few other positions that we tested would give a lower temperature rise.
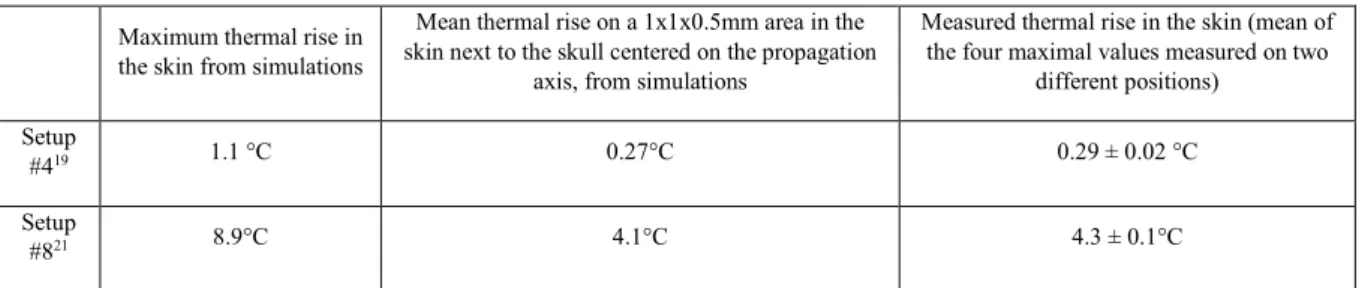
For comparison purposes, we report in table 6 the thermal rise calculated in the skin from simulations. The first column displays the maximum value, which was reached in a single point adjacent to the skull in both cases, and the second column presents the mean value in a 1x1mm range in the lateral direction and 0.5mm range in the axial direction, in the cutaneous area next to the skull centered on the propagation axis, excluding the skull region.
Figure 6. Temperature measured in a mouse head skin with a thermocouple during two different sequences of ultrasonic neuromodulation
Maximum thermal rise in the skin from simulations
Mean thermal rise on a 1x1x0.5mm area in the skin next to the skull centered on the propagation
axis, from simulations
Measured thermal rise in the skin (mean of the four maximal values measured on two
different positions) Setup
#419 1.1 °C 0.27°C 0.29 ± 0.02 °C
Setup
#821 8.9°C 4.1°C 4.3 ± 0.1°C
Table 6. Estimated and measured thermal rise in the mouse skin head Discussion
For each study we report both the temperature at target location and the maximum temperature overall in the rat brain. This location of the maximum temperature elevation is distinct from the target location. The temperature rise is indeed higher in the skull than in brain tissue due to their difference in thermal parameters : in setup #821, we estimate a maximum temperature of 49.0°C in the skull and 43.15 °C in the brain after 3 seconds. By diffusion effects, tissues near the skull heat more than those deeper inside (figure 7 a))43,44. This also explains the unusual relaxation time that can be observed (Figure 4, right as opposed to Figure 4, left): the temperature of tissue near the skull does not drop immediately at the end of the sonication. They keep being heated by the skull for about 0.1s. This effect is also observed on the pulses timescale: figure 7 b) c) displays the temperature during the last pulses of the sonication in Kamimura et al study21. The focal spot, far from the bone, undergoes a thermal rise during the pulses and cools down between them. The point of maximal temperature, on the contrary, keeps heating between the pulses: as it is located close to the bone that has reached a higher temperature, it is subject to thermal diffusion. It can also be noticed on Fig 7 that thermal rise and decay do not exhibit an exponential trend: the curve appears to be almost linear, even when further decreasing the time step of the simulation. The typical diffusion time for one pixel (𝜆𝜆 =𝑑𝑑𝑥𝑥κ2× ρC) is indeed 0.17 s, much larger than the 5ms duration of the bursts.A higher thermal rise in the bone than in the brain was also reported45 in a numerical study on ultrasonic neurostimulation with a layer model of human skull/cerebrospinal fluid/white matter/gray matter.
Figure 7. Temperature at the end of a 20s sonication at 1.9 MHz
In setups #1, 2, 3, 5, 6 and 7, the temperature rise remains below 0.01 °C, confirming that thermal effects are expected to be in the neuromodulation results. Ye et al19 measured a thermal rise of 0.01°C with setup #2 and 3, in good agreement with our results. Surprisingly, Li et al.20 used a lower acoustic power and a lower duty cycle than Ye et al19 but reported a temperature rise of 0.2°C at 1 MHz and 1.6°C at 5 MHz at 230 mW/cm², whereas our simulations predict a thermal rise of only 0.006°C and 0.07°C respectively.
It should be noted that a rat CT-scan was used for all simulations, whereas three of the five studies19–21 were performed on mice. However, the numerical results are in good agreements with the experimental measurements of thermal rise in mice.
The experimental thermal rise measurements have been performed at a frequency (2MHz) as close as possible to the one used in Kamimura et al (1.9MHz) and Li et al (1.9MHz). It must be noted here that experiments have been performed on a euthanatized mice, so that perfusion is not cooling down the tissue in contrast to the latter two in vivo neuromodulation studies. Nevertheless, the relative impact of the acoustic intensity and duty cycle can be assessed. Our ex vivo measurements show that maximum temperature elevation is 15 times higher when using
Kamimura et al parameters as compared to Li et al. For comparison our simulations predict the maximum temperature elevation (respectively mean temperature over a 0.5mm3 volume) to be 8 times (respectively 15 times) higher when using Kamimura et al parameters as compared to Li et al.
In Kamimura et al. study21 at 1.9 MHz, we estimate that temperature rises from 37 to 44°C in the brain in 20 seconds. Thermal rise is not negligible: 10 seconds after the sonication, the temperature is still higher than the maximal value, spatially and temporally, simulated in every other study. It is worth noting that Kamimura et al performed histopathology at the target location and did not observe any lesion, which is in line with our thermal dose estimation (15CEM in the brain).
While it is commonly admitted that neuromodulation results from a mechanical phenomenon, temperature might influence its effects. Diverging studies exist on the influence of temperature on neuronal activity: it has been shown that for some neurons in the hypothalamic suprachiasmatic nucleus (SCN)46, temperature rise increases the firing rate by a coefficient of 1.1 impulses /s /°C. 12 to 22% of warm-sensitive neurons and 48 to 62% moderately temperature-sensitive neurons have been reported in the SCN, depending on the regions. Even though the SCN is located deep in the brain and is not likely to undergo the highest thermal variations, this sensitivity to temperature might also concern neurons located in path of the ultrasound. On the contrary, other groups47,48 observed a thermal inhibition of sciatic nerves using focused ultrasound. As the neurons concerned by neuromodulation in the simulated experiments are not located in the SCN nor in sciatic nerves, it is impossible to predict whether their reaction to thermal rise is an activation or an inhibition.
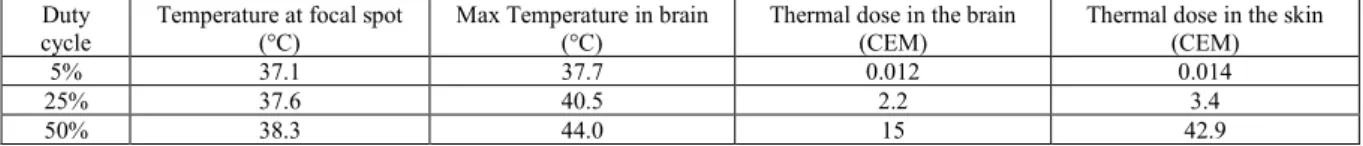
The concept of thermal dose (TD) was introduced to quantify the heating energy brought to tissues and evaluate the risk of ultrasound induced damages35. It takes into account the temperature rise and the time of sonication: 1 CEM is equivalent to one second of 43°C heating. Typically, a 240 CEM thermal dose corresponds to a total necrosis of any type of tissue35 and 17.5 CEM49 is the threshold for a 50% probability of brain damages (table 8). We calculated the thermal doses in each of the five studies: in setups #1 to 6 12,19,20, thermal doses values are below 0.1CEM in the skull, brain and skin. Setup #7 11 exhibits a slightly higher TD (0.1 CEM) because of the longer sonication time, but this value remains much below any reported damage threshold. However in Kamimura et al. study (setup #8) 21 at 1.9 MHz, TD reaches 15 CEM in the brain (close to the bone), 42.9 CEM in the skin, and 0.75 CEM at the focal spot. The highest thermal dose was observed close to the bone. The heating of the bone has long hampered ultrasonic brain surgery as was reported in pioneering work about previous primate studies43, and is still of concern during current clinical treatments44. The thermal dose on target (0.75 CEM) agrees with the absence of visible damage in the histology reported by Kamimura et al in the central part of the brain (Figure 9 in the article’s supplementary material21). Thermal effects can be used on purpose to enhance the neuromodulation effects of ultrasound. Given the high level of expertise in acoustics of the Kamimura et al team, it was likely the case even if this is not discussed in the paper. In this context, acoustic parameter must be chosen with extreme care in order to avoid thermal damage. Our results show that most superficial parts of the brain (close to the skull) are at most thermal risk. According to our simulations, Kamimura et al successfully capped their maximum power: the thermal doses in the outer surface of the brain and in the skin reaches higher values than at the target but remain slightly below the thresholds reported 35,49,50 for tissue lesions (table 7 and 8).
Duty
cycle Temperature at focal spot (°C) Max Temperature in brain (°C) Thermal dose in the brain (CEM) Thermal dose in the skin (CEM)
5% 37.1 37.7 0.012 0.014
25% 37.6 40.5 2.2 3.4
50% 38.3 44.0 15 42.9
Table 7. Results for temperature and thermal dose with varied duty cycles, at 1.9MHz
Reported thermal dose threshold for brain
damages Reported thermal dose threshold for skin damages Reported thermal dose threshold for muscle damages 17.5 CEM (50% probability)49
25 CEM35 210 CEM
35 240 CEM35
Table 8. Reported threshold values of thermal dose for thermal necrosis
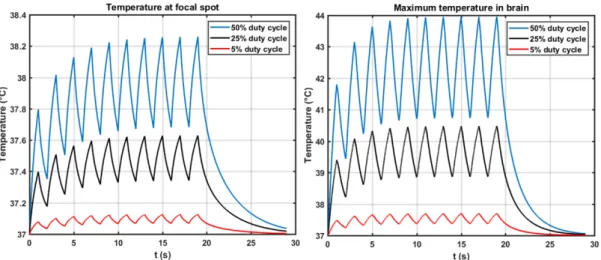
Thermal effects can be significantly reduced by lowering the duty cycle. In that case, tissues have more time to cool down between the pulses but mechanical effect are kept the same if the peak pressure remains unchanged. To illustrate this, we ran two simulations based on the same sonication parameters than Kamimura et al, but changing the duty cycle from 50% to 25% and 5%. Figure 8 shows the maximum temperature at the target (left) and the maximum temperature (right) for the three duty cycles. Results are listed in table 7 for the maximum temperature
in the brain and in the skinnear the skull. Compared to a 50% duty cycle, a 25% duty cycle divides the thermal dose by a factor of 7 (in the brain) to 13 (in the skin) and a 5% duty cycle by a factor of 1250 (brain) to 3000 (skin).
Figure 8. Estimated temperature rise at 1.9MHz, with the same parameters as in Kamimura et al21, except for the duty cycles.
The temperature measurements performed on a mouse support our simulations results. For setups #4 and 8, the maximum temperature in the skin at the end of the sonication is predicted to be 38.1°C (dT=1.1°C) and 45.9°C (dT=8.9°C), respectively, in our simulations (table 6). The fact that we did not observe as high temperature increases as calculated is not surprising: given the small size of the focal spot at 1.9MHz, it is very hard to target it. Besides, the most heated point from simulations was, in both cases, right next to the skull; this position could not be reached with the thermocouple subcutaneousy introduced into the skin. Therefore we calculated the mean value of ΔT in a small area (1x1x0.5mm) around this point to estimate a more realistic value of the temperature that can be measured experimentally (table 6). They compare well with the experimental measures: for setup #418, the mean value from simulations matches the measured thermal rise (0.2°C) and for setup #821, the values of thermal rise from simulations and experiments are close (respectively 4.1°C and 4.3°C).
Conclusion
Our retrospective analysis shows that thermal effects can be neglected in almost all the simulated neuromodulation experiments. For setups #1 to 711,12,19,20, corresponding to a frequency range of 320 kHz to 5 MHz and a total sonication time ranging from 80 ms to 20 min, the maximum temperature elevation in the rodent brain is indeed lower than 1°C. In the case of setup #821, for a 20 seconds total sonication time, the thermal rise reaches 1.3°C at the target and 7°C near the skull. In that case, both thermal and mechanical effects could plausibly contribute to the neuromodulatory effect of ultrasound, which can be accepted as long as the thermal dose does not exceed the threshold of tissue damage. Numerical simulations are a useful tool to design the experimental procedure and adjust the ultrasonic parameters (especially the duty cycle, as highlighted in this paper) in order to better predict the potential impact of a thermal rise during neuromodulation. It can even be used to exclude certain modes of action, by limiting the thermal rise to a negligible value.
Acknowledgements
This work was supported by the Bettencourt Schueller Foundation and the "Agence Nationale de la Recherche" under the program ‘‘Future Investments’’ with the reference ANR-10-EQPX-15.
References
1. Fry, W. J. Use Of Intense Ultrasound in Neurological Research. Am. J. Phys. Med. 37, (1958).
2. Barnard, J. W., Fry, W. J., Fry, F. J. & Krumins, R. F. Effects of high intensity ultrasound on the central nervous system of the cat. J. Comp. Neurol. 103, 459–484 (1955).
3. Fry, F. J., Ades, H. W. & Fry, W. J. Production of Reversible Changes in the Central Nervous System by Ultrasound. Science 127, 83–84 (1958).
4. Fry, W. J. & Fry, F. J. Fundamental Neurological Research and Human Neurosurgery Using Intense Ultrasound. IRE Trans. Med. Electron. ME-7, 166–181 (1960).
5. Fry, W. J. & Meyers, R. Ultrasonic Method of Modifying Brain Structures. Stereotact. Funct. Neurosurg.
22, 315–327 (1962).
6. Fry, W. J., Wulff, V. J., Tucker, D. & Fry, F. J. Physical Factors Involved in Ultrasonically Induced Changes in Living Systems: I. Identification of Non‐Temperature Effects. J. Acoust. Soc. Am. 22, 867–876
(1950).
7. Lele, P. P. Effects of focused ultrasonic radiation on peripheral nerve, with observations on local heating.
Exp. Neurol. 8, 47–83 (1963).
8. Prosser, C. L. ACTION POTENTIALS IN THE NERVOUS SYSTEM OF THE CRAYFISH. J. Gen.
Physiol. 19, 65–73 (1935).
9. Legon, W. et al. Transcranial focused ultrasound modulates the activity of primary somatosensory cortex in humans. Nat. Neurosci. 17, 322–329 (2014).
10. Tufail, Y., Yoshihiro, A., Pati, S., Li, M. M. & Tyler, W. J. Ultrasonic neuromodulation by brain stimulation with transcranial ultrasound. Nat. Protoc. 6, 1453–1470 (2011).
11. Yang, P. S. et al. Transcranial Focused Ultrasound to the Thalamus Is Associated with Reduced Extracellular GABA Levels in Rats. Neuropsychobiology 65, 153–160 (2012).
12. Younan, Y. et al. Influence of the pressure field distribution in transcranial ultrasonic neurostimulation.
Med. Phys. 40, 082902 (2013).
13. Yoo, S.-S. et al. Focused ultrasound modulates region-specific brain activity. NeuroImage 56, 1267–1275
(2011).
14. Lee, W. et al. Image-Guided Focused Ultrasound-Mediated Regional Brain Stimulation in Sheep.
Ultrasound Med. Biol. 42, 459–470 (2016).
15. Deffieux, T. et al. Low-Intensity Focused Ultrasound Modulates Monkey Visuomotor Behavior. Curr. Biol.
23, 2430–2433 (2013).
16. Wattiez, N. et al. Transcranial ultrasonic stimulation modulates single-neuron discharge in macaques performing an antisaccade task. Brain Stimulat. (2017). doi:10.1016/j.brs.2017.07.007
17. Lee, W., Chung, Y. A., Jung, Y., Song, I.-U. & Yoo, S.-S. Simultaneous acoustic stimulation of human primary and secondary somatosensory cortices using transcranial focused ultrasound. BMC Neurosci. 17, 68
(2016).
18. King, R. L., Brown, J. R., Newsome, W. T. & Pauly, K. B. Effective Parameters for Ultrasound-Induced In Vivo Neurostimulation. Ultrasound Med. Biol. 39, 312–331 (2013).
19. Ye, P. P., Brown, J. R. & Pauly, K. B. Frequency Dependence of Ultrasound Neurostimulation in the Mouse Brain. Ultrasound Med. Biol. doi:10.1016/j.ultrasmedbio.2016.02.012
20. Li, G.-F. et al. Improved Anatomical Specificity of Non-invasive Neuro-stimulation by High Frequency (5 MHz) Ultrasound. Sci. Rep. 6, 24738 (2016).
21. Kamimura, H. A. S. et al. Focused ultrasound neuromodulation of cortical and subcortical brain structures using 1.9 MHz: FUS neuromodulation of cortical/subcortical brain structures. Med. Phys. 43, 5730–5735
(2016).
22. Sassaroli, E. & Vykhodtseva, N. Acoustic neuromodulation from a basic science prospective. J. Ther.
Ultrasound 4, 17 (2016).
23. Heimburg, T. & Jackson, A. D. On soliton propagation in biomembranes and nerves. Proc. Natl. Acad. Sci.
U. S. A. 102, 9790–9795 (2005).
24. Petrov, A. G. Flexoelectric Model for Active Transport. in Physical and Chemical Bases of Biological
Information Transfer 111–125 (Springer, Boston, MA, 1975). doi:10.1007/978-1-4684-2181-1_9
25. Tyler, W. J. et al. Remote Excitation of Neuronal Circuits Using Low-Intensity, Low-Frequency Ultrasound. PLOS ONE 3, e3511 (2008).
26. Ibsen, S., Tong, A., Schutt, C., Esener, S. & Chalasani, S. H. Sonogenetics is a non-invasive approach to activating neurons in Caenorhabditis elegans. Nat. Commun. 6, ncomms9264 (2015).
27. Plaksin, M., Shoham, S. & Kimmel, E. Intramembrane Cavitation as a Predictive Bio-Piezoelectric Mechanism for Ultrasonic Brain Stimulation. Phys. Rev. X 4, 011004 (2014).
28. Xu, Z. et al. Intracranial inertial cavitation threshold and thermal ablation lesion creation using MRI-guided 220-kHz focused ultrasound surgery: preclinical investigation. J. Neurosurg. 122, 152–161 (2014).
29. Bucknor, M. D., Ozhinsky, E., Shah, R., Krug, R. & Rieke, V. Effect of Sonication Duration and Power on Ablation Depth During MR-Guided Focused Ultrasound of Bone. J. Magn. Reson. Imaging n/a-n/a (2017). doi:10.1002/jmri.25676
30. Cox, B. T., Kara, S., Arridge, S. R. & Beard, P. C. k-space propagation models for acoustically
heterogeneous media: Application to biomedical photoacoustics. J. Acoust. Soc. Am. 121, 3453–3464 (2007).
31. Constans, C., Deffieux, T., Pouget, P., Tanter, M. & Aubry, J. F. A 200 - 1380 kHz Quadrifrequency Focused Ultrasound Transducer For Neurostimulation In Rodents And Primates: Transcranial In Vitro
Calibration And Numerical Study Of The Influence Of Skull Cavity. IEEE Trans. Ultrason. Ferroelectr. Freq.
Control PP, 1–1 (2017).
32. Goss, S. A., Frizzell, L. A. & Dunn, F. Ultrasonic absorption and attenuation in mammalian tissues.
Ultrasound Med. Biol. 5, 181–186 (1979).
33. Pennes, H. H. Analysis of Tissue and Arterial Blood Temperatures in the Resting Human Forearm. J. Appl.
Physiol. 1, 93–122 (1948).
34. Wang, H., Kim, M., Normoyle, K. P. & Llano, D. Thermal Regulation of the Brain—An Anatomical and Physiological Review for Clinical Neuroscientists. Front. Neurosci. 9, (2016).
35. Dewey, W. C. Arrhenius relationships from the molecule and cell to the clinic. Int. J. Hyperthermia 25, 3–
20 (2009).
36. Soneson, J. E. & Ebbini, E. S. A User‐Friendly Software Package for HIFU Simulation. AIP Conf. Proc.
1113, 165–169 (2009).
37. Pulkkinen, A., Huang, Y., Song, J. & Hynynen, K. Simulations and measurements of transcranial low-frequency ultrasound therapy: skull-base heating and effective area of treatment. Phys. Med. Biol. 56, 4661
(2011).
38. Lee, D. & Pierce, A. D. Parabolic equation development in recent decade. J. Comput. Acoust. 03, 95–173
(1995).
39. Pinton, G. et al. Attenuation, scattering, and absorption of ultrasound in the skull bone. Med. Phys. 39,
299–307 (2012).
40. Duck, F. A. Physical Properties of Tissues. (2013).
41. Dervishi, E. et al. Transcranial high intensity focused ultrasound therapy guided by 7 TESLA MRI in a rat brain tumour model: A feasibility study. Int. J. Hyperthermia 29, 598–608 (2013).
42. Royer, D. & Casula, O. Quantitative imaging of transient acoustic fields by optical heterodyne interferometry. in , 1994 IEEE Ultrasonics Symposium, 1994. Proceedings 2, 1153–1162 vol.2 (1994).
43. Hynynen, K. et al. Pre-clinical testing of a phased array ultrasound system for MRI-guided noninvasive surgery of the brain—A primate study. Eur. J. Radiol. 59, 149–156 (2006).
44. Jeanmonod, D. et al. Transcranial magnetic resonance imaging–guided focused ultrasound: noninvasive central lateral thalamotomy for chronic neuropathic pain. Neurosurg. Focus 32, E1 (2011).
45. Mueller, J. K., Ai, L., Bansal, P. & Legon, W. Computational exploration of wave propagation and heating from transcranial focused ultrasound for neuromodulation. J. Neural Eng. 13, 056002 (2016).
46. Burgoon, P. W. & Boulant, J. A. Temperature-sensitive properties of rat suprachiasmatic nucleus neurons.
Am. J. Physiol. - Regul. Integr. Comp. Physiol. 281, R706–R715 (2001).
47. V, C., G, S., F, J., N, V. & K, H. Focused ultrasound effects on nerve action potential in vitro., Focused ultrasound effects on nerve action potential in vitro. Ultrasound Med. Biol. Ultrasound Med. Biol. 35, 35, 1737,
1737–1747 (2009).
48. Tsui, P.-H., Wang, S.-H. & Huang, C.-C. In vitro effects of ultrasound with different energies on the conduction properties of neural tissue. Ultrasonics 43, 560–565 (2005).
49. McDannold, N., Vykhodtseva, N., Jolesz, F. A. & Hynynen, K. MRI investigation of the threshold for thermally induced blood-brain barrier disruption and brain tissue damage in the rabbit brain. Magn. Reson. Med.
51, 913–923 (2004).
50. Elias, W. J. et al. A magnetic resonance imaging, histological, and dose modeling comparison of focused ultrasound, radiofrequency, and Gamma Knife radiosurgery lesions in swine thalamus. J. Neurosurg. 119, 307–