HAL Id: hal-02401447
https://hal.uca.fr/hal-02401447v2
Submitted on 14 Dec 2020HAL is a multi-disciplinary open access archive for the deposit and dissemination of sci-entific research documents, whether they are pub-lished or not. The documents may come from teaching and research institutions in France or abroad, or from public or private research centers.
L’archive ouverte pluridisciplinaire HAL, est destinée au dépôt et à la diffusion de documents scientifiques de niveau recherche, publiés ou non, émanant des établissements d’enseignement et de recherche français ou étrangers, des laboratoires publics ou privés.
A. Harris, S. Mannini, S. Thivet, Magdalena Oryaëlle Chevrel, Lucia Gurioli,
N. Villeneuve, A. Di Muro, A. Peltier
To cite this version:
A. Harris, S. Mannini, S. Thivet, Magdalena Oryaëlle Chevrel, Lucia Gurioli, et al.. How shear helps lava to flow. Geology, Geological Society of America, 2019, 48, pp.154 - 158. �10.1130/G47110.1�. �hal-02401447v2�
1
How shearing helps lava to flow
A. Harris
1, S. Mannini
1*, S. Thivet
1, M.O. Chevrel
1, L. Gurioli
1, N. Villeneuve
2,3, A. Di
Muro
2,4and A. Peltier
2,41Université Clermont Auvergne, CNRS, IRD, OPGC, Laboratoire Magmas et Volcans, F-63000
Clermont-Ferrand, France
2Université de Paris, Institut de physique du globe de Paris, CNRS, F-75005 Paris, France 3Université de La Réunion, Laboratoire Géosciences Réunion, F-97744 Saint Denis, France
4Observatoire Volcanologique du Piton de la Fournaise, Institut de physique du globe de Paris, F-97418 La Plaine
des Cafres, France *Now at: Department of Earth Sciences, University of Geneva, Geneva, Switzerland
*Current address: Department of Earth Sciences, University of Geneva, 13, Rue des Maraichers, CH-1205 Geneva, Switzerland.
CITATION: Harris, A., et al., How shear helps lava to flow: Geology (2020) 48 (2): 154– 158.https://doi.org/10.1130/G47110.1
ABSTRACT
Understanding the thermo-rheological regime and physical character of lava while it is flowing is crucial if we are to adequately model lava flow emplacement dynamics. We present measurements from simultaneous sampling and thermal imaging across the full width of an active channel at Piton de la Fournaise (La Réunion, France). Our data set involves measurements of flow dynamics at three sites down-channel from the vent. Quantification of flow velocities, cooling rates, sample texture, and rheology allows all thermo-rheological parameters to be linked, and down- as well as cross-channel variations to be examined. Within 150 m from the vent, we recorded an unexpected velocity increase (from 0.07 to 0.1 m/s), in spite of cooling rates of 0.19–0.29 °C/m and constant slope. This change requires a switch from a Newtonian-dominated regime to a Bingham plug–dominated regime. Sample analysis revealed that the plug consists of foam-like lava, and the shear zones involve vesicle-poor (low-viscosity) lava. With distance from the vent, shear zones develop, carrying the vesicular plug between them. This causes flow to initially accelerate, helped by bubble shearing in narrow lateral shear zones, until cooling takes over as the main driver for viscosity increase and, hence, velocity decrease.
Key words: Lava channel; Velocity; Cooling; Vesicles; Viscosity, Shearing
INTRODUCTION
Understanding the thermo-rheological regime of an active lava flow is fundamental if we are to adequately model its emplacement behavior (e.g., Harris and Rowland, 2001; Del Negro et al., 2005; Hidaka et al., 2005). The interrelation between physical flow properties and dynamics is a crucial link for which we are rich in heat-loss–driven models (e.g., Keszthelyi and Self, 1998) but lacking in data to al- low validation of models and theory. Tradition- ally, lava flow rheology has been modeled as a cooling-dominated process, so that the lava steadily cools, degasses, and crystallizes down flow, increasing in viscosity from the vent to the flow front (e.g., Harris and Rowland, 2001). However, to date, only a few measurements have been performed to assess whether this assumption is valid, and these measurements have all been for active channels in Hawaii (USA), with the first measurements being made more than a kilometer or two from the vent (Lipman and Banks, 1987; Moore, 1987; Crisp et al., 1994; Cashman et al., 1999). While such a down- channel thermal and rheological regime has been borne out by analysis of inactive channels (Soule et al., 2004; Riker et al., 2009; Chevrel et al., 2013; Robert et al., 2014; Rhéty et al., 2017), thermal measurements and modeling have also indicated
2
that down-flow cooling is inevitable and progressive, with the rate depending on degree of insulation, flow velocity, and channel dimensions (Harris and Rowland 2009). Other work has highlighted the importance of the crystallization sequence on lava viscosity and strain rate on influencing crystallization behavior and, hence, emplacement dynamics (e.g., Chevrel et al., 2013; Kolzenburg et al., 2018). The role of bubbles in lava transport properties is, however, very poorly constrained, and de- tailed measurements down near-vent segments of active channels are scarce, with Lipman and Banks (1987) remaining a precious resource.
Down-flow degassing will likely cause loss of volatiles and undercooling of the melt to trigger microcrystallization, both of which will in- crease the viscosity of the lava mixture (Sparks and Pinkerton, 1978). Down-flow evolution of bubble quantity and shape may also affect rheology, where the mixture viscosity will decrease or increase depending on whether bubbles are deformed or not (Llewellin and Manga, 2005). Down-flow degassing and loss of bubbles have also been documented in lava tubes (Cashman et al., 1994) and from the structure of inflated pāhoehoe flows (Cashman and Kauahikaua, 1997), as well as from measurements along ac- tive (Cashman et al., 1999) and solidified (Riker et al., 2009) systems. The effect of vesicles on rheology has also been inferred from in situ viscosity measurements on pāhoehoe lobes (Chevrel et al., 2018). However, no direct field measurements exist to constrain and link changing bubble states with flow dynamics down a lava channel.
Here, we present unique data from thermal imaging and sampling down the near-vent reach of an active lava channel at Piton de la Fournaise (Réunion Island, France) during July–August 2015. This data set allowed us to simultaneously constrain and link down- and across-flow velocity, temperature, and rheology. Surprisingly, we measured an acceleration within 150 m of the vent. At constant slope, this implies a down-flow evolution of the rheological regime, from Newtonian to Bingham. In this regard, a Newtonian fluid is one in which the shear stresses during flow linearly increase with strain rate, and the fluid will deform under an infinitesimal amount of stress applied. Instead, a Bingham fluid re- quires application of a finite yield stress before they begin to flow. As a result, the plot of shear stress versus shear strain does not pass through the origin for the latter, but it does for the former (e.g., Bachelor 1967). In our case, this change was caused by strain localization on the margin of a central plug. This can be supported by the difference in bubble content between lava sampled in the plug and that in the shear zones. Our current understanding of lava flow is that it can evolve from Newtonian to Bingham rheology, but bubbles are rarely taken into consideration to explain such evolution. Here, we provide a unique data set that documents this evolution and an attempt to model this with available rheological models (as detailed in the GSA Data Repository1), showing that bubbles play a fundamental role in determining rheology and evolving flow dynamics.
MEASUREMENTS IN AN ACTIVE LAVA CHANNEL Channel Dimensions and Surface Velocity
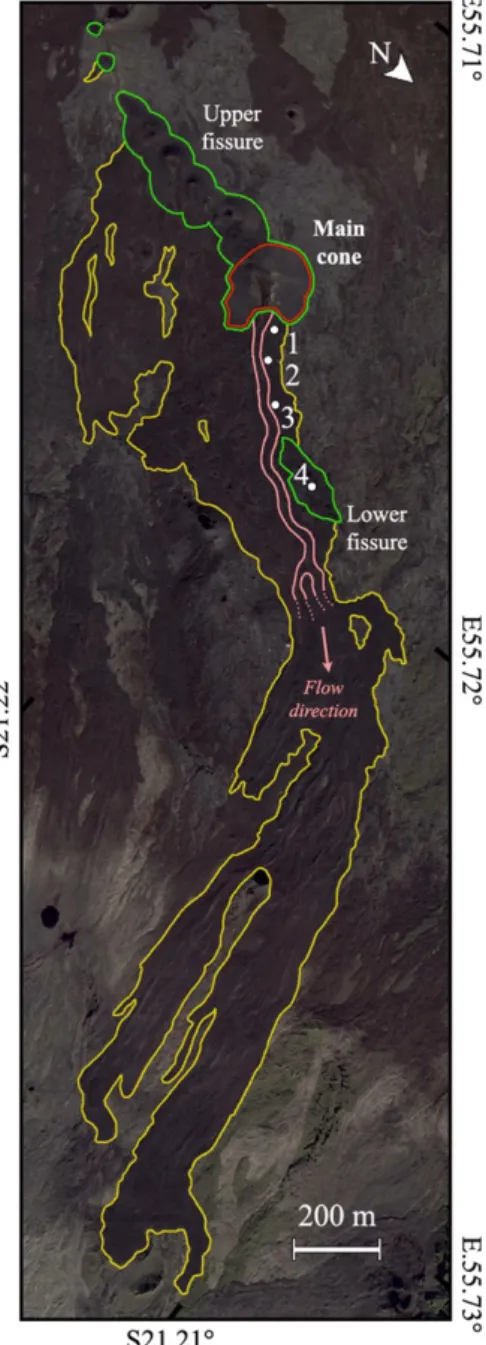
Piton de la Fournaise’s July–August 2015 eruption lasted 2 d (31 July–1 August) and fed a single master channel that extended 1 km (Fig. 1; Supplement DR1 in the Data Repository). Down this stable channel system, thermal image sequences were collected at four stations (30, 110, 220 and 440 m from the vent; Fig. 1) on the same day (1 August) and within 20 min of each other. Using manual particle tracking (Supplement DR2), surface velocities were measured at 0.03 ± 0.01 m/s at the channel margins and 0.07 ± 0.04 m/s at the center. The horizontal and vertical velocity profiles were best fit with a parabolic equation (Supplement DR2), indicating horizontal velocity gradients of 0.07 s–1 (Fig. 2) and suggesting that flow was laminar and Newtonian. Further down flow (at stations 2 and 3; Fig. 1), the channel was wider (4–5 m, instead of 2 m) and shallower (0.8 m instead of 1.8 m; Supplement DR2). A constant surface velocity was measured across a central, 3-m- wide plug at an average of 0.1 m/s at both stations, which was faster than at station 1 (Fig. 2). The central plug was flanked by two narrow, 0.5-m-wide shear zones where velocity declined to zero (Fig. 2A). These profiles revealed a plug- dominated Bingham behavior, with a velocity gradient across the shear zones of 0.2 s–1, a rate three times higher
3
than at station 1. Assuming that the plug comprised 75% of the flow by thickness (as it did by width), then the plug height was 0.47 m, for a basal shear zone height of 0.16 m, across which the velocity vertical gradient was 0.45 s–1 (Fig. 2B).
Heat Loss and Cooling Rate
Eruption temperature at the vent (1146 °C) was obtained from thermal images of bubbles bursting at the vent. At station 1, flow was poorly crusted, with a mean surface temperature of 704 ± 107 °C (Fig. 3). At stations 2 and 3, while the surface of the central plug was partially covered by a crust of fragmenting slabs of spiny pāhoehoe and nascent ‘a‘ā, the shear zones had a cover of down-flow–thickening ‘a‘ā. Due to the crust cover of the shear zones, surface temperatures at the channel margins were cooler than at the center, where the average surface temperature of the plug was 558 ± 38 °C, whereas it was 300 °C at the margins (Fig. 3). These surface temperature ranges converted to heat losses of 87 ± 2 kW/m2 at station 1, and 31 ± 24 kW/m2 and 45 ± 23 kW/m2 at stations 2 and 3 (Fig. DR3). Cooling was then estimated between the vent and station 1 at 0.21 ± 0.07 °C/m. Lower heat losses and higher velocities at stations 2–3 resulted in cooling of 0.13 ± 0.10 °C/m and 0.12 ± 0.10 °C/m, at the two stations, respectively (Supplement DR3). Such cooling per unit distance is high in comparison to previously reported values for flow down a lava channel (typically 0.005–0.007 °C/m; Crisp et al., 1994; Cashman et al., 1999; Soule et al., 2004; Riker et al., 2009; Robert et al., 2014; Rhéty et al., 2017). This is because, for our channel, the lava was poorly insulated, and velocities were low.
Sampling, Sample Characteristics, and Lava Viscosity
Lava was sampled on the first day near the vent and on the second day at station 2 coincident with thermal imaging (Supplement DR4). The station 2 sample was collected by inserting a metal rod laterally 50 cm into the channel, resulting in two distinct, simultaneously collected, fragments: one from the shear zone and one from the plug. Mass flux was steady during field work of day 2, during which this key (shear zone and plug) sample was collected coincident with the thermal imagery.
Lava bulk composition was basaltic with a porphyritic texture (<3 vol% phenocrysts; 15–34 vol% microlites of plagioclase and pyroxene; Supplement DR4). Near-vent samples had a bulk density of 1370 ± 280 kg/m3, resulting in a vesicularity of 53 ± 10 vol%. Vesicles were rounded with equivalent diameters of 1 mm (Fig. 4). Temperature estimated from the glass MgO content was 1138 ± 2 °C (Supplement DR4). The two station 2 sample fragments had contrasting textural characteristics. The shear zone part was dense (2020 kg/m3) with a vesicularity of 30 vol%, including rounded and small (0.5 mm) vesicles and a few larger (>2 mm) vesicles. Crystals showed alignment, and the calculated melt temperature was 1119 ± 1 °C. The difference between melt temperature near the vent and that of the sample from the shear zone resulted in a cooling per unit distance of 0.17 °C/m, which agrees with the theoretical calculations obtained from heat loss (Supplement DR3). Conversely, the central plug fragment had an extremely low density (500 kg/m3), a very high vesicularity (83 vol%), and less abundant crystals (17 vol%). The vesicle population was heterogeneous, being a mixture of small-rounded (10–100 µm), larger-small-rounded (<0.5 mm), and irregularly shaped vesicles.
At station 1, the strain rates were relatively low (0.07 s–1), and the bubble capillary number (Ca) was around 0.7 (Supplement DR4). Given a threshold Ca of 0.5, above which bubbles are able to deform (Manga et al., 1998), i.e., bubble internal forces are weaker than the sur- rounding fluid forces (viscosity × strain rate), the apparent viscosity of the three-phase lava (i.e., melt + crystal + bubbles) was estimated at 1.5 × 10³ Pa·s (Supplement DR4). At station 2 within the shear zones, the vesicle-free (melt + crystal) viscosity was higher at 8.4 × 10³ Pa·s due to lower temperature. However, because strain rates were 0.2 s–1 in the plug and 0.45 s–1 in the shear zones, we obtained Ca >> 0.5 in these locations—meaning that bubbles were highly deformable. The effect of the bubbles therefore decreased the effective viscosity to
4
4.7 × 10³ Pa·s. Conversely, within the plug, although crystallinity was lower, the very high bubble concentration (>80 vol%) and very low strain rates (near 0 s–1) prevented deformation of bubbles. DISCUSSION
Given the interior flow temperature difference of 19 °C between stations 1 and 2, an average surface velocity of 0.05 m/s at station 1, and a distance between the two stations of 80 m, the time to travel to station 2 was around 1600 s. This gives cooling along the shear zones at a rate of ∼0.012 °C/s, which is in line with cooling rates obtained for active flows in Hawaii (Cashman et al., 1999). Given such a decrease in temperature, we would expect a viscosity in- crease, and hence velocity decrease, down this vent-proximal channel length. However, the measured velocities revealed an acceleration be- tween stations 1 and 2, after which velocity was constant until station 3. Given a constant slope between the three stations and stable effusion rate at the time of measurements, we explain this as a change in rheological behavior by strain localization on either side of a down-flow–developing central plug (i.e., within the shear zones).
We therefore propose a scenario whereby lava emitted at the vent flowed under a Newtonian regime, as supported by the parabolic velocity profile. After 110 m (by station 2), narrow shear zones had appeared on either side of a central plug, suggesting that flow had become Bingham. In the central plug, high bubble concentration and low strain rates resulted in bubble growth and increasing capillary forces, resulting in a polyhedral foam with internal yield strength and stable bubble walls, so that the plug was not deforming. Instead, it behaved as a solid, being carried between the two marginal shear zones. At the channel margins, although temperature was lower than near the vent, strain rates were so high that bubbles were sheared. The effect of this sheared-bubble population on bulk flow rheological properties outweighed the effect of cooling, resulting in a lower viscosity. The nonsheared and bubble-rich plug was thus carried between two lateral zones of sheared lava, highlighting the effect of bubbles, which either acted as a lubricant in the shear zones or as a retardant to deformation in the plug. We note, also, that the shear zone had lower MgO than the plug (Supplement DR4). This could be due to preferential settling of larger olivine crystals in the slower-moving shear zones, further sup- porting the fact that the shear and plug zones were independent identities.
The lower bubble content within the shear zones could be due to more outgassing than in the plug, or shear pressing of bubbles out of the marginal shear zones and into the central plug. However, due to relaxation effects during the time between sampling and quenching (Moitra et al., 2013; Lindoo et al., 2017), the evidence of the shearing effect was lost from the vesicle signature, but it remained visible in the microlite alignment (Fig. 4B).
The change in flow regime over the proximal reach of the flow, from shear dominated with a parabolic velocity profile at the vent to plug dominated after 110 m, is reflected in the temperature profiles (Fig. 3). Temperatures were high across the entire channel close to the vent because of a highly disrupted, young crust. At stations 2 and 3, temperatures became low in the marginal shear zones, where an increasingly thick carapace of mature ‘a‘ā was built (cf. Rowland and Walker, 1987), and higher across the central plug, where slabs of crust were able to form, but then broke up to expose hotter interior lava. The lower velocities of the shear zone lava also meant that lava at the channel margins had more time to cool and develop a more mature crust than at the center, as well as giving time for larger olivine crystals to preferentially settle and gas to escape.
CONCLUSION
An unexpected velocity increase and apparent viscosity decrease were recorded down a lava channel over the first 110 m of flow, in spite of stable slope, constant mass flux, and high cooling rates. This peculiar change was caused by the down-flow development of a central plug flanked by narrow shear zones in which bubbles were highly deformed, and hence where the effective viscosity was low. As in a volcanic conduit (e.g., Wright and Weinberg, 2009), the lateral shear zones lubricated the central plug.
5
This caused the flow to initially accelerate over the proximal reach of the channel until cooling and crystallization could take over as the main drivers for viscosity increase and, hence, velocity decrease. Our measurements represent a unique (and difficult to obtain) near-vent data set (fully de- scribed and presented in the Data Repository) in which, for the first time, we could identify and quantify a velocity increase over a relatively short distance close to the vent. Future measurements will need to focus on this near-vent part of the channel system so as to properly define and explain the complete down-channel evolution of flow dynamics.
ACKNOWLEDGMENTS
This work was funded by the Agence National de la Recherche (ANR) through project Lava Advance into Vulnerable Areas (LAVA; ANR program: DS0902 2016; project: ANR-16CE39–0009) and greatly benefited from the constructive comments of Matthew Patrick, Einat Lev, Kathy Cashman, and two anonymous reviewers. This is ANR-LAVA contribution 12.
REFERENCES CITED
Bachelor, G.K., 1967, An Introduction to Fluid Dynamics: Cambridge, UK, Cambridge University Press, Cambridge Mathematical Library Series, https://doi.org/10.1017/CBO9780511800955.
Cashman, K.V., and Kauahikaua, J.P., 1997, Reevaluation of vesicle distributions in basaltic lava flows: Geology, v. 25, p. 419–422, https://doi .org/10.1130/0091-7613(1997)025<0419:ROV DIB>2.3.CO;2.
Cashman, K.V., Mangan, M.T., and Newman, S., 1994, Surface degassing and modifications to vesicle size distributions in active basalt flows: Jour- nal of Volcanology and Geothermal Research, v. 61, p. 45–68, https://doi.org/10.1016/0377- 0273(94)00015-8.
Cashman, K.V., Thornber, C., and Kauahikaua, J.P., 1999, Cooling and crystallization of lava in open channels, and the transition of pāhoehoe lava to ‘a‘ā: Bulletin of Volcanology, v. 61, p. 306–323, https://doi.org/10.1007/s004450050299.
Chevrel, M.O., Platz, T., Hauber, E., Baratoux, D., Lavallée, Y., and Dingwell, D.B., 2013, Lava flow rheology: A comparison of morphological and petrological methods: Earth and Planetary Science Letters, v. 384, p. 102– 120, https://doi .org/10.1016/j.epsl.2013.09.022.
Chevrel, M.O., Harris, A.J.L., James, M.R., Calabrò, L., Gurioli, L., and Pinkerton, H., 2018, The viscosity of pāhoehoe lava: In situ syn-eruptive measurements from Kilauea, Hawaii: Earth and Planetary Science Letters, v. 493, p. 161–171, https://doi.org/10.1016/j.epsl.2018.04.028.
Crisp, J., v. Cashman, K., Bonini, J.A., Hougen, S.B., and Pieri, D.C., 1994, Crystallization history of the 1984 Mauna Loa lava flow: Journal of Geo- physical Research, v. 99, no. B4, p. 7177–7198, https://doi.org/10.1029/93JB02973.
Del Negro, C., Fortuna, L., and Vicari, A., 2005, Modelling lava flows by cellular nonlinear net- works (CNN): Preliminary results: Nonlinear Processes in Geophysics, v. 12, p. 505–513,
https://doi.org/10.5194/npg-12-505-2005. Harris, A.J.L., and Rowland, S.K., 2001, FLOW- GO: A kinematic thermo-rheological model for lava flowing in a channel: Bulletin of Volcanology, v. 63, p. 20–44, https://doi.org/10.1007/ s004450000120.
6
review, in Hoskuldsson, A., et al., eds., Studies in Volcanology: The Legacy of George Walker: International Association of Volcanology and Chemistry of the Earth’s Interior Special Publication 2, p. 33–51.
Hidaka, M., Goto, A., Umino, S., and Fujita, E., 2005, VTFS Project: Development of the lava flow simulation code LavaSIM with a model for three- dimensional convection, spreading, and solidification: Geochemistry Geophysics Geosystems, v. 6, Q07008, https://doi.org/10.1029/2004G C000869.
Keszthelyi, L., and Self, S., 1998, Some physical requirements for the emplacement of long basaltic lava flows: Journal of Geophysical Re- search, v. 103, p. 27447–27464, https://doi .org/10.1029/98JB00606.
Kolzenburg, S., Giordano, D., Hess, K.-U., and Dingwell, D.B., 2018, Shear-rate dependent disequilibrium rheology and dynamics of ba- salt solidification: Geophysical Research Letters, v. 45, no. 13, p. 6466–6475, https://doi .org/10.1029/2018GL077799.
Lindoo, A., Larsen, J.F., Cashman, K.V., and Oppenheimer, J., 2017, Crystal controls on permeability development and degassing in basaltic andesite magma: Geology, v. 45, p. 831–834, https://doi .org/10.1130/G39157.1.
Lipman, P.W., and Banks, N.G., 1987, A‘a Flow Dynamics, Mauna Loa 1984: U.S. Geological Survey Professional Paper 1350, p. 1527–1567.
Llewellin, E.W., and Manga, M., 2005, Bubble suspension rheology and implications for conduit flow: Journal of Volcanology and Geothermal Research, v. 143, p. 205–217, https://doi .org/10.1016/j.jvolgeores.2004.09.018. Manga, M., Castro, J., Cashman, K., and Loewenberg, M., 1998, Rheology of bubble-bearing magmas: Journal of Volcanology and Geothermal Re- search, v. 87, p. 15–28, https://doi.org/10.1016/ S0377-0273(98)00091-2. Moitra, P., Gonnermann, H.G., Houghton, B.F., and Giachetti, T., 2013, Relating vesicle shapes in pyroclasts to eruption styles: Bulletin of Volcanology, v. 75, p. 691–698, https://doi.org/10.1007/ s00445-013-0691-8. Moore, H.J., 1987, Preliminary estimates of the rheo- logical properties of 1984 Mauna Loa Lava, in Decker, R.W., Wright, T.L., and Stauffer, P.H., eds., Hawaiian Volcanism: U.S. Geological Sur- vey Professional Paper 1350, p. 1569–1588.
Rhéty, M., Harris, A.J.L., Villeneuve, N., Gurioli, L., Médard, E., Chevrel, M.O., and Bachèlery, P., 2017, A comparison of cooling-limited and volume-limited flow systems: Examples from channels in the Piton de La Fournaise April 2007 lava-flow field: Geochemistry Geophysics Geosystems, v. 18, p. 3270–3291, https://doi .org/10.1002/2017GC006839.
Riker, J.M., Cashman, K.V., Kauahikaua, J.P., and Montierth, C.M., 2009, The length of channelised lava flows: Insight from the 1859 eruption of Mauna Loa Volcano, Hawaii: Journal of Volcanology and Geothermal Research, v. 183, p. 139–156, https://doi.org/10.1016/ j.jvolgeores.2009.03.002.
Robert, B., Harris, A., Gurioli, G., Medard, E., Sehlke, A., and Whittington, A., 2014, Textural and rheological evolution of basalt flowing down a lava channel: Bulletin of Volcanology, v. 76, p. 824, https://doi.org/10.1007/s00445-014- 0824-8.
Rowland, S.K., and Walker, G.P.L., 1987, Toothpaste lava: Characteristics and origin of a lava structural type transition between pahoehoe and ‘a‘a: Bulletin of Volcanology, v. 49, p. 631–641, https:// doi.org/10.1007/BF01079968.
Soule, S.A., Cashman, K.V., and Kauahikaua, J.P., 2004, Examining flow emplacement through the surface morphology of three rapidly em- placed, solidified lava flows, Kīlauea Volcano, Hawai’i: Bulletin of Volcanology, v. 66, p. 1–14, https://doi.org/10.1007/s00445-003- 0291-0
Sparks, R.S.J., and Pinkerton, H., 1978, Ef- fect of degassing on rheology of basaltic lava: Nature, v. 276, p. 385– 386, https://doi.org/10.1038/276385a0.
7
Wright, H.M.N., and Weinberg, R.F., 2009, Strain localization in vesicular magma: Implications for rheology and fragmentation: Geology, v. 37, p. 1023–1026, https://doi.org/10.1130/ G30199
1GSA Data Repository item 2020045, full description of the eruption (DR1); thermal image data collection and image details, measurements of surface velocities, modeling of velocity profiles and channel profile measurements in the field (DR2); heat loss and cooling rate calculations (DR3); sample analyses and lava viscosity calculations and results (DR4); and the full thermal image data set for all stations (DR5), is available online at http://www.geosociety.org/ datarepository/2020/, or on request from editing@ geosociety.org.
8
Figure 1. Map of lava flow field (yellow out- line), fissures (green outline), main vent (red outline), and stable channel (pink outline) of July–August 2015 eruption of Piton de la Four- naise, La Réunion, France.
9
Figure 2. (A) Mean (squares) and standard deviation (given as error bars) for all velocity mea- surements at Piton de la Fournaise (La Réunion, France) on 1 August 2015. Lines are best-fit velocity profiles across channel width at stations 1 (red), 2 (orange), and 3 (blue) using the approach given in Supplement DR2 (see footnote 1). (B) Modeled vertical velocity profiles at stations 1 (red) and 3 (blue). For clarity, mean and standard deviation of the total data set at three stations was plotted and fitted here. Results are the same if we fit through the individual measurement sample sets that make up the population that the mean describes, where (for any one measure- ment set) there is always a lower velocity at station 1 than at stations 2 and 3. The full data set, for each station, is described and plotted in Supplement DR2. Note that the asymmetry of measurements at stations 2 (S2) and 3 (S3) is due to the missing far-bank shear zone, which we could not resolve from our low oblique viewing angle (see Supplement DR2).
10
Figure 3. Surface temper- ature across the channel at stations 1 (red) and 3 (orange) at Piton de la Fournaise (La Réunion, France) on 1 August 2015.
Figure 4. Binary images of thin sections and backscattered electron images for (A) near-vent sample of day 1, plus (B) shear zone, and (C) plug zone of sample taken on day 2 of the July–August 2015 eruption of Piton de la Fournaise (La Réunion, France) (white—matrix, gray—phenocrysts, and black—vesicles).