ORIGINAL PAPER
Body condition and ruminal morphology responses
of free-ranging impala (
Aepyceros melampus) to changes in diet
Emily P. Lane&Marcus Clauss&Nancy D. Kock&
F. W. Graham Hill&Aggrey A. Majok&
Antoinette Kotze&Daryl Codron
Received: 9 December 2013 / Accepted: 30 April 2014 / Published online: 15 May 2014 # Springer-Verlag Berlin Heidelberg 2014
Abstract Variation of the intraruminal papillation pattern with diet quality has been described in many ruminant species, but the use of papillation measures as a proxy for habitat quality and nutritional status of animals has not been evaluated. We compared various measures of body condition (body mass,
body condition score, kidney fat index, bone marrow fat index, adrenal mass, kidney to adrenal mass ratio), diet quality (%browse, protein and fibre content) and rumen papillation in 106 impalas (Aepyceros melampus) from four different loca-tions in Zimbabwe. The various condition proxies indicated that periods of low diet quality are characterised by a high proportion of browse in the diet of this species. Animals with a high proportion of browse had more voluminous rumens, suggesting a compensation for lower diet quality by increased intake. Macroscopic papillation indices did not yield meaning-ful significant correlations with diet quality or body condition proxies, and hence, their use for estimating habitat or body condition cannot be advocated. In contrast to previous histo-logical reports, ballooning cells of the Stratum corneum of the ruminal mucosa were more prominent in animals on lower-quality diets. There were significant correlations of the kidney to adrenal mass ratio with other body conditions and with diet quality indices, suggesting that poor body condition and low diet quality represent stressful situations.
Keywords Browse . Grass . Habitat . Assessment . Adrenal . Rumen . Histology
Introduction
The assessment of nutritional status is a valuable tool for veter-inarians concerned with the health care of, and optimal produc-tion from, antelope on wildlife management enterprises. Where-as the quality of food available to domestic ruminants—either fed in the stable or offered as pasture—is readily identified, appraisal of diet quality is more complex in free-ranging wild ruminants, which may choose from a large variety of natural vegetation. Correspondingly, many different methods to identify diet quality indicators both in the habitat (Walker1970,1975)
Communicated by H. Kierdorf E. P. Lane
:
N. D. KockDepartment of Paraclinical Veterinary Studies, Faculty of Veterinary Medicine, University of Zimbabwe, Harare, Zimbabwe
M. Clauss (*)
:
D. CodronClinic for Zoo Animals, Exotic Pets and Wildlife, Vetsuisse Faculty, University of Zurich, Winterthurerstr. 260, 8057 Zurich, Switzerland e-mail: [email protected]
N. D. Kock
Wake Forest School of Medicine, Department of Pathology/ Comparative Medicine, Winston-Salem, NC, USA F. W. G. Hill
:
A. A. MajokDepartment of Clinical Veterinary Studies, Faculty of Veterinary Medicine, University of Zimbabwe, Harare, Zimbabwe F. W. G. Hill
Benmore House, Elgin, Morayshire, UK A. A. Majok
Dr. John Garang Memorial University of Science & Technology (JG-MUST), Bor, Republic of South Sudan
A. Kotze
Genetics Department, University of the Free State, Bloemfontein, South Africa
D. Codron
Florisbad Quaternary Research, National Museum, Bloemfontein, South Africa
Present Address: E. P. Lane
:
A. Kotzeand from the animals themselves (Monro and Skinner1979) have been evaluated.
Impala (Aepyceros melampus) are one of the most numerous antelope on wildlife management enterprises in Zimbabwe and South Africa (Hoffman 2000). Impala feed preferentially on grasses but include a wide range of dicotyledonous plants in their diet as a response to declining grass quality during the dry season (Hofmann and Stewart 1972; Dunham 1980, 1982; Attwell and Bhika1985; Van Rooyen1992; Sponheimer et al. 2003; Codron et al. 2006; Kos et al. 2012). Such seasonal changes in diet composition are reflected in changes of body composition. For example, animals show lower kidney fat index or bone marrow fat index in the dry season (Hanks et al.1976; Dunham and Murray1982; Gallivan et al.1995; Marshal et al. 2012). Such seasonal changes are also related to other seasonal observations such as the colonisation of the ruminal epithelium by bacteria (Hill 1982), the seasonal presence of intestinal parasites (Ocaido et al.1999) or the seasonal differences in rumination behaviour (Blanchard and Fritz2008). In contrast to species from temperate environments, which usually ingest more food when food quality is high (reviewed in Meyer et al. 2010), one might expect species from tropical and subtropical environments, with a less pronounced seasonality of body fat stores, to either compensate for reduced diet quality by increasing food intake or at least show less seasonal variation in food intake, as indicated for impala by Meissner et al. (1996). Hofmann (1973) described seasonal variation in the intraruminal papillation pattern in impalas, with distinct dif-ferences in the surface enlargement by the papillae according to the locally predominant diet and season. Intraspecific dif-ferences in the intraruminal papillation pattern have been described between seasons, between free-ranging and captive specimens and between different rumen regions; higher-quality diet is commonly associated with more prominent papillae, i.e. a higher surface enlargement factor (SEF) (reviewed in Clauss et al.2009). Additionally, differences in the pattern between species have been linked to their rumen physiology (reviewed in Clauss et al.2009). However, more detailed intraspecific studies, linking rumen papillae morphol-ogy to the diet of individual animals, are mostly lacking.
In this study, we recorded indicators of body mass, body condition, rumen volume and intraruminal papillation as well as papillae histology, and linked these to the diet of individual animals, in order to assess the usefulness of intraruminal papillation as an indicator of the nutritional status in impala. The following predictions guided our analysis:
1. With decreasing diet quality, i.e. with increasing propor-tion of browse in the diet, we expected increased rumen fill (indicating an attempt of the animals to compensate for the lower quality by increasing intake), decreasing body condition indices (indicating that the attempted compen-sation was not completely successful) and decreasing
ruminal SEF values (as lower diet quality leads to a reduced papillae size and density).
2. In animals with a higher proportion of browse in the diet, we expected a less distinct rumen contents stratification, as visible in a lower difference in the SEF of the dorsal rumen and the atrium (Codron and Clauss2010). 3. In correspondence to previous reports on free-ranging
wild ruminants, we expected histological changes in ru-men papillae with changes in diet in free-ranging animals, in particular a decrease of ballooning cells in the stratum corneum of the ruminal mucosa with decreasing diet quality (Hofmann1973; Hofmann and Schnorr1982).
Materials and methods
Animal sampling and measurements
Data were collected from 106 impala (57 females, 49 males) shot during cropping operations held between February 1992 and March 1993 at four locations in Zimbabwe: Cecil Kop Nature Reserve (18° 56′ S 18° 41′ E), Iwaba Wildlife Estate (18° 43′ S 30° 04′ E), Omay Communal Land (17° 00′ S 28° 03′ E) and Buffalo Range Ranch (20° 55′ S 31° 25′ E). Cecil Kop Nature Reserve is a small densely stocked urban nature reserve close to the city of Mutare (1,240–1,735 m). It has broken terrain and high annual rainfall (750–1,000 mm/year). Vegetation is mixed broadleaf woodland savanna with some grassland, abundant leguminous shrubs and riverine evergreen forest. Iwaba Wildlife Estate is a privately owned multi-species safari hunting and game viewing property (1,130–1,230 m) with gently undulating terrain and variable rainfall (330–1,130 mm/year). Vegetation is a mixed broadleaf woodland savanna with small areas of open grassland and legume-rich riverine tree-bush savanna. Omay Communal Land is a communally owned gently undulating grassland on the shores of Lake Kariba (480–520 m) and woodland and scrub savanna inland with variable rainfall (480–1,000 mm/year). Buf-falo Range Ranch is a largely flat safari hunting estate (410 m) with rocky outcrops and erratic rainfall (260–550 mm/year). Vegetation is a mix of woodland and scrub savanna. At the time of sampling, a severe drought was in place with almost no vegetation available as food and impala were dying of starvation. Observations were grouped by season (dry—April to October; wet—February and March). Animals were processed within 2 h after death. Relative age (<2 years or >2 years, n=106) was assigned based on examination of mandibular teeth (Lane et al. 1994). Body mass (n=102) was estimated from body length and heart girth using gender-specific equations from Howells and Hanks (1975). The kidney fat index (KFI, n=97) (Riney1960), the bone marrow fat index (BMI, n=49) (Brooks et al.1977), the ratio of kidney to adrenal weight (KA, n=93) (Smith1970) and a body condition score
(BCS, n=104) based on the palpation of the muscle cover over the lumbar vertebrae (Honhold et al.1989) were used as body condition indicators. Rumen volume (n=86) was calculated by multiplying length, breadth and depth of the organ as placed on the flat surface on its right side with a constant depth. The SEF was calculated from the rumen papillae length, width and density measured on mucosa sections taken from the dorsal (n=96) and ventral (n=94) rumen wall as well as the atrium ruminis (n=96) (Schnorr and Vollmerhaus1967). From the same areas, mucosa samples were fixed in formalin, embedded in paraffin, cut at 4–6 μm and stained with haematoxylin and eosin. The histological appearance of the papillae was described using scores for the degree of epithelial hyperplasia (1–4), the dilation of the submucosal sinusoidal sinuses (1–4), the fre-quency of vesicular cells in the epithelium (1–4) and the amount of cell ballooning in superficial layers of the stratum corneum (1–4). For each animal and score, an average of the three mucosal samples evaluated was calculated, using only animals for which all three areas had been investigated.
Representative samples (n=50) of rumen contents (mixed from several locations of the rumen) were analysed for neutral detergent fibre (Goering and Van Soest 1970) and crude protein (AOAC 1997), and sieved through a sieve of 1.7-mm pore size; the residue on the sieve was used to estimate the proportion of browse (Gwynne and Bell1968).
Statistics
The ultimate aim of this study was to determine whether body condition proxies could be used as indicators of variation in intraspecific nutritional status in free-ranging ruminants, and in particular whether ruminal papillae stratification and histology reflect changes in body condition and nutritional status. Initially, we compared diet (% browse) and nutritional characteristics (%NDF and %CP) of impala across the four study sites, and did the same for the various body condition indices so as to be able to infer whether changes in one variable were mirrored by habitat changes in another. Impala are well known to shift proportions of grass to browse intake not only across seasons but also across habitats (Codron et al.2006; Copeland et al. 2009). Relative proportions of grass and browse in an animal diet are expected to be related to changes in dietary NDF and CP content (Dunham 1980); thus, we expected these latter two variables would also differ across habitats. Similarly, if body condition indices do indeed reflect changes in diet or nutritional status, these measures should also vary spatially. For compari-sons across habitats, we used Kruskal-Wallis H tests with mul-tiple comparisons (StatSoft Inc. 2007). The non-parametric test was used because uneven sample sizes across groups meant parametric assumptions were not met in our data. These analyses were repeated within the sexes, and again within the dry season only—the period for which the vast majority of data was avail-able (82.5 % of all females and 87.8 % of all males sampled; i.e.
data for the wet season were too few to make meaningful comparisons across seasons). We then tested the prediction that diet and nutritional variables are related, using simple linear correlation to assess these relationships, as well as to evaluate relationships amongst the various body condition indices (piece-wise linear regression was used to evaluate the relationship between BMI and KFI; seeResults). We did not perform other non-linear tests in order to keep our approach simple.
For investigating relationships between diet/nutritional char-acteristics with body condition indices, for which we had limited a priori information on which to build testable hypotheses, we used an information-theoretic approach so as to be able to identify models and variables that most likely influence body condition. Our approach is based on Akaike’s Information Criterion adjusted for small sample sizes (AICc), following
guidelines specific to wildlife research (Burnham and Anderson 2001, 2002). We used generalised linear models (StatSoft Inc. 2007) incorporating either %browse, %NDF or %CP as effect variables, and either BCS, KFI, BMI, adrenal mass, KA or rumen volume as dependent variables. We included BM (continuous), sex (fixed effect), age (fixed effect, < or >2 years old) and the interaction between sex and age, as covariates, so that possible effects of these variables were accounted for in the final analysis. Iterative procedures yielded results for all possible combination of predictor variables and covariates, which were then compared for goodness-of-fit based on the AICc. No two nutritional or body condition indices were
ever included in the same model, since one of our predictions was that these would be related to each other (see above). Similarly, age and BM were never included in the same model. Models withΔAICcscore≤2, where ΔAICc=AICc−minimum
AICcwithin the candidate model set, were selected as the most
likely sources of variation in the relevant dependent variable (Burnham and Anderson2001,2002). In addition, we calculated the Akaike weights (wi) for each candidate model i relative to
that of the whole set of r models, representing the probability of each model and providing the best-fit to the data on a scale of 0 (poor fit) to 1 (best model). Moreover, since our objective was not to build predictive models for body condition indices per se but rather to determine which variables affect the body condition indices the most, we evaluated the importance of each variable by summing the wi for all models including the variable of
interest and by dividing the sum of wifor all models where that
variable was absent. This multi-model inferential approach is considered superior to making inferences based only on the best-fit model, since in many cases it may be difficult to separate the goodness-of-fit amongst several models, e.g. if multiple models haveΔAICcvalues <2 (Burnham and Anderson2001,2002).
Thus, we also determined parameter estimates by multi-model inference, which involves calculating wi-weighted estimates
across all models, and accounting for error both within and across models in the resultant standard errors and 95 % confi-dence intervals (Burnham and Anderson2001,2002).
Finally, we assessed relationships between rumen papilla stratification and histology with diet/nutritional characteristics, and with body condition indices. Similar information-theoretic approaches as described above were used for this purpose, except that effects of diet/nutritional characteristics and body condition indices were evaluated separately, i.e. two groups of models were evaluated for each response variable. The depen-dent variables for these analyses were SEFatrium, SEFdorsal
(expressed as a percentage of SEFatrium), and the observed
frequencies of hyperplasia, dilatation, vesicular cells and cell ballooning, respectively. Note that we present results only for SEFatrium, as this variable was related to both SEFdorsal and
SEFventral (r=0.33, p<0.01 in both cases); hence, data for all
three rumen regions yielded comparable results.
Results
Relationships between habitat, diet and body condition In line with the prediction that impala diets vary across hab-itats, we found significant spatial effects for diet (%browse)
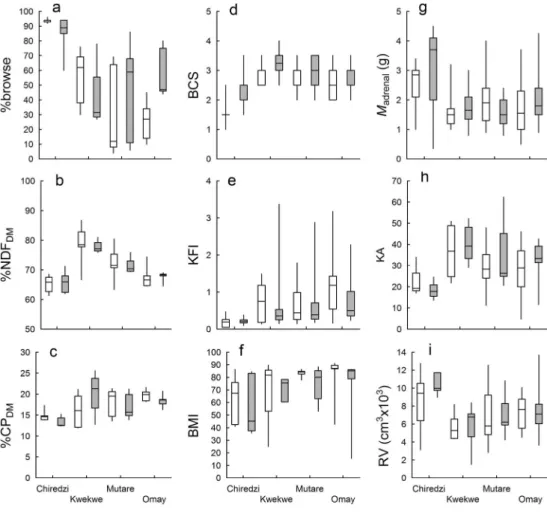
and nutritional parameters (%NDF, %CP) and generally in both sexes (H=8.157 to 15.293; p<0.01 to 0.043; Fig.1a–c). One exception was %CP amongst females (H3,29=5.517; p=
0.138), but an effect was observed when the analysis was limited to dry season data (H3,20=12.731; p<0.01), implying
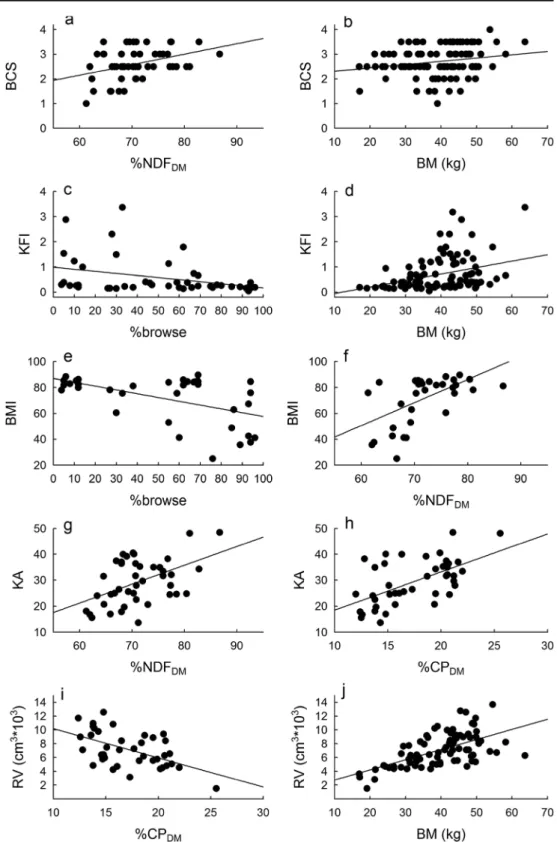
that shifts may have been rarer in the wet season when resources are more or less evenly available across locations. Differences in diet across habitats generally matched changes in nutritional characteristics: at Chiredzi, %browse in rumen contents was significantly higher than in the other habitats (p<0.0001 to 0.022; Fig.1a), and Chiredzi had amongst the lowest %NDF and %CP of rumen contents (p<0.0001 to 0.034; Fig. 1b, c). Similar trends were evident when only dry season data were analysed (not shown). Accordingly, %browse was significantly negatively correlated with %NDF and %CP of rumen contents (Fig.2a, b), and the two nutritional parameters were significantly positively related (Fig.2c). Body mass was not significantly related to any of the nutritional variables studied (Fig.2d–f).
Body condition indices also differed spatially, and generally consistently for both sexes, with the exception of adrenal mass (H=8.699 to 13.107; p<0.01 to 0.034; Fig.1d–i). Impala from
Fig. 1 Box plots showing changes in diet (%browse) and nutritional characteristics (%NDF and %CP), and in body condition indices, of impala across the four habitats included in this study. Horizontal lines indicate medians; boxes indicate 25th– 75th interquartile ranges; whiskers indicate minimum– maximum ranges. BCS body condition score, KFI kidney fat index, BMI bone marrow fat index, KA kidney to adrenal mass ratio, RV rumen volume
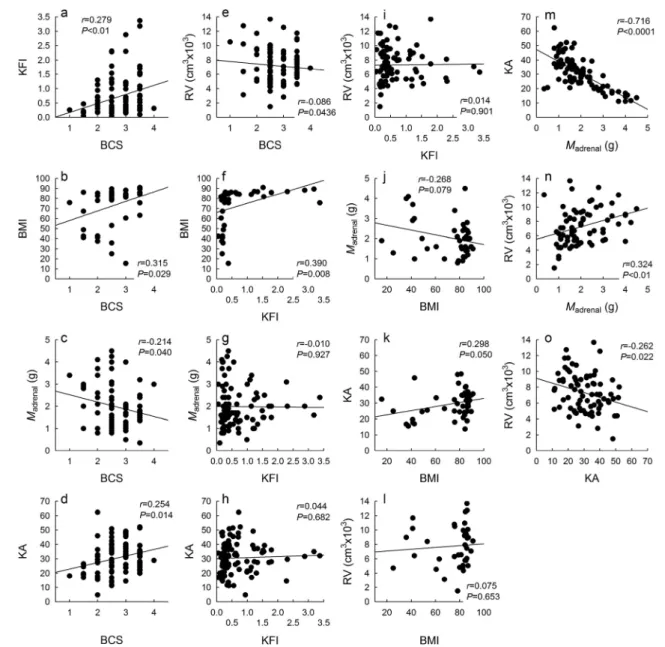
Chiredzi were again the most common to differ from the others—having amongst the lowest BCS, KFI, BMI and KA, and amongst the highest adrenal masses and rumen volumes. All body condition indices were significantly related to the BCS (Fig.3a–d), but not to the KFI or BMI (Fig.3g–l). The latter two, however, appear to be nonlinearly related around a threshold (Fig.3f). A piecewise regression model fitted to these data (Quasi-Newton method, non-linear estimation module of STATISTICA v8.0; StatSoft Inc. 2007) reveals that variation in KFI actually explains 87.2 % of the variation in BMI around a breakpoint at a BMI of 73 %: below this level, when KFI is also low, BMI drops off rapidly. Larger adrenals generally had lower KA (Fig.3m), and a higher rumen volume was linked both to larger adrenals and lower KA (Fig.3n, o).
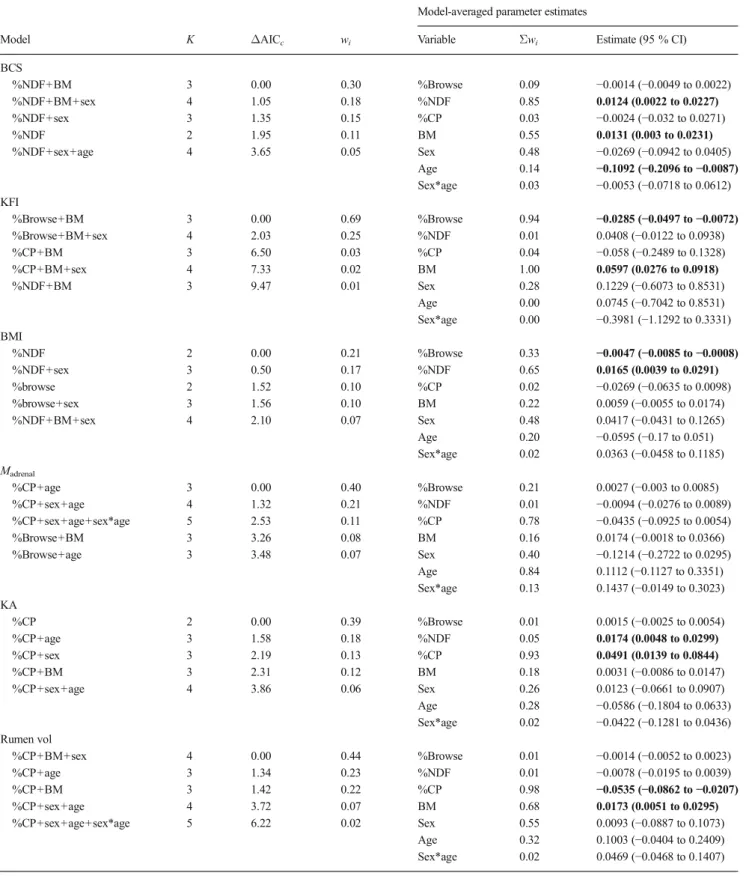
Effects of diet on body condition
All body condition proxies were related to one or more diet (%browse) and diet quality characteristics (%NDF and %CP) (Table1). BCS was positively related to %NDF (Fig.4a), as was KA, although for the latter %NDF was poorly supported
as a predictor variable (Table1∑wi=0.05; Fig.4g). Stronger
support was found for an effect of %CP on KA (Table1∑wi=
0.93; Fig.4h). KFI and BMI were both negatively related to %browse (Fig. 4c, e), and rumen volume was negatively related to %CP (Fig.4i). Only adrenal mass did not appear to be influenced by any of the nutritional variables included here. Body mass was positively related to most body condition indices (Fig.4b, d, j), and appeared in all the best-supported models except for those involving adrenal mass and KA (Table 1). Age and sex, as well as the interaction between the two, seldom had significant effects on our body condition indices (unconditional 95 % confidence limits generally in-cluded zero, and∑wiwere generally low).
Rumen papillation: macroanatomy and histology
Neither nutritional nor body condition proxies had major effects on heterogeneity of ruminal papillation (Table 2). Models tended to have similar levels of support (similar AICc
values, with numerous models havingΔAICcscores <2), and
unconditional parameter estimates generally did not exclude
Fig. 2 Pearson correlations between diet (%browse) and nutritional characteristics (%NDF and %CP) of rumen contents, and for each of these related to body mass body mass (BM, in kg). DM indicates that %NDF and %CP data are presented in terms of dry matter content
zero at 95 % confidence. One exception was that KFI was related to SEFdorsal(expressed as a % of SEFatrium), but
sup-port for this pattern was weak (∑wi=0.16).
Similarly, models incorporating effects of diet and nutri-tional characteristics, and body condition indices, on papilla histology, as measured by the degrees of hyperplasia, dilata-tion and the frequency of vesicular cells, generally had low levels of support (indicating poor fits to our data), and indi-vidual variables had weak and/or non-significant effects (Tables 3 and 4). Cell ballooning was, however, positively related to %browse, which featured in all models withΔAICc
<10 (an indication of at least medium-level support; see Burnham and Anderson2001), and which had a∑wi=1.00.
Of the body condition parameters included here, the only possible meaningful effects were that BCS and KFI were
negatively and positively, respectively, related to hyperpla-sia, although support for these effects was only moderate (∑wi=0.25). Body mass and other covariates (age and sex)
had only weak or negligible influences on histological scores.
Discussion
The results of this study confirm several previously demon-strated relationships between body condition indices and hab-itat proxies. The relevance of some body condition indices related to the concept of stress was confirmed, which have so far received only occasional attention in the literature. Rumen papillation proved unsuitable as an indicator of habitat quality or population status.
Fig. 3 Pearson correlations between all five body condition indices used in this study, and rumen volume.BCS body condition score, KFI kidney fat index, BMI bone marrow fat index, KA kidney to adrenal mass ratio, RV rumen volume
Table 1 Best-supported models and multiple-model parameter estimates for relationships between body condition indices and rumen volume with diet and nutritional characteristics. Body mass, sex and age are covariates. Sex*age indicates the interaction term
Model-averaged parameter estimates
Model K ΔAICc wi Variable Σwi Estimate (95 % CI)
BCS %NDF+BM 3 0.00 0.30 %Browse 0.09 −0.0014 (−0.0049 to 0.0022) %NDF+BM+sex 4 1.05 0.18 %NDF 0.85 0.0124 (0.0022 to 0.0227) %NDF+sex 3 1.35 0.15 %CP 0.03 −0.0024 (−0.032 to 0.0271) %NDF 2 1.95 0.11 BM 0.55 0.0131 (0.003 to 0.0231) %NDF+sex+age 4 3.65 0.05 Sex 0.48 −0.0269 (−0.0942 to 0.0405) Age 0.14 −0.1092 (−0.2096 to −0.0087) Sex*age 0.03 −0.0053 (−0.0718 to 0.0612) KFI %Browse+BM 3 0.00 0.69 %Browse 0.94 −0.0285 (−0.0497 to −0.0072) %Browse+BM+sex 4 2.03 0.25 %NDF 0.01 0.0408 (−0.0122 to 0.0938) %CP+BM 3 6.50 0.03 %CP 0.04 −0.058 (−0.2489 to 0.1328) %CP+BM+sex 4 7.33 0.02 BM 1.00 0.0597 (0.0276 to 0.0918) %NDF+BM 3 9.47 0.01 Sex 0.28 0.1229 (−0.6073 to 0.8531) Age 0.00 0.0745 (−0.7042 to 0.8531) Sex*age 0.00 −0.3981 (−1.1292 to 0.3331) BMI %NDF 2 0.00 0.21 %Browse 0.33 −0.0047 (−0.0085 to −0.0008) %NDF+sex 3 0.50 0.17 %NDF 0.65 0.0165 (0.0039 to 0.0291) %browse 2 1.52 0.10 %CP 0.02 −0.0269 (−0.0635 to 0.0098) %browse+sex 3 1.56 0.10 BM 0.22 0.0059 (−0.0055 to 0.0174) %NDF+BM+sex 4 2.10 0.07 Sex 0.48 0.0417 (−0.0431 to 0.1265) Age 0.20 −0.0595 (−0.17 to 0.051) Sex*age 0.02 0.0363 (−0.0458 to 0.1185) Madrenal %CP+age 3 0.00 0.40 %Browse 0.21 0.0027 (−0.003 to 0.0085) %CP+sex+age 4 1.32 0.21 %NDF 0.01 −0.0094 (−0.0276 to 0.0089) %CP+sex+age+sex*age 5 2.53 0.11 %CP 0.78 −0.0435 (−0.0925 to 0.0054) %Browse+BM 3 3.26 0.08 BM 0.16 0.0174 (−0.0018 to 0.0366) %Browse+age 3 3.48 0.07 Sex 0.40 −0.1214 (−0.2722 to 0.0295) Age 0.84 0.1112 (−0.1127 to 0.3351) Sex*age 0.13 0.1437 (−0.0149 to 0.3023) KA %CP 2 0.00 0.39 %Browse 0.01 0.0015 (−0.0025 to 0.0054) %CP+age 3 1.58 0.18 %NDF 0.05 0.0174 (0.0048 to 0.0299) %CP+sex 3 2.19 0.13 %CP 0.93 0.0491 (0.0139 to 0.0844) %CP+BM 3 2.31 0.12 BM 0.18 0.0031 (−0.0086 to 0.0147) %CP+sex+age 4 3.86 0.06 Sex 0.26 0.0123 (−0.0661 to 0.0907) Age 0.28 −0.0586 (−0.1804 to 0.0633) Sex*age 0.02 −0.0422 (−0.1281 to 0.0436) Rumen vol %CP+BM+sex 4 0.00 0.44 %Browse 0.01 −0.0014 (−0.0052 to 0.0023) %CP+age 3 1.34 0.23 %NDF 0.01 −0.0078 (−0.0195 to 0.0039) %CP+BM 3 1.42 0.22 %CP 0.98 −0.0535 (−0.0862 to −0.0207) %CP+sex+age 4 3.72 0.07 BM 0.68 0.0173 (0.0051 to 0.0295) %CP+sex+age+sex*age 5 6.22 0.02 Sex 0.55 0.0093 (−0.0887 to 0.1073) Age 0.32 0.1003 (−0.0404 to 0.2409) Sex*age 0.02 0.0469 (−0.0468 to 0.1407)
Bold type indicates parameters where the unconditional 95 % confidence intervals exclude zero
K is the number of parameters in model, withe Akaike weights (model scoring from 0 to 1, where 1 indicates best-fit),Σwithe sum of wifor all models
containing the relevant parameter; %NDF and %CP are presented in terms of dry matter content of the rumen
Relationships between habitat, diet, body condition and body mass
In this study, both between habitats and individuals, diet quality appeared to decline with increases in proportions of browse intake (Fig.2b, c). This corroborates previous results for impala at other locations (Dunham 1980; Van Rooyen
1992; Meissner et al.1996). These findings thus also support more general publications that challenge the common miscon-ception that browse forage is usually of higher quality than grass (Hummel et al.2006; Codron et al.2007). Actually, for intermediate feeders amongst the African ruminants, browse is the fallback food when grass quality is declining, and not the other way round (Codron et al.2006).
Fig. 4 Relationships between diet and nutritional characteristics with body condition indices for cases where the former were found to be likely predictors (based on having higher overallwi
relative to models which excluded them) and for which parameter estimates excluded zero at 95 % confidence (see Table1). Fit lines indicate least squares regressions displayed for visual effect only. BCS body condition score, KFI kidney fat index, BMI bone marrow fat index, KA kidney to adrenal mass ratio, RV rumen volume, BM body mass
Table 2 Best-supported models and multiple-model parameter estimates for relationships between rumen papillae stratification with diet and nutritional characteristics and with body condition indices. Body mass, sex and age are covariates. Sex*age indicates the interaction term
Model-averaged parameter estimates
Model K ΔAICc wi Variable Σwi Estimate (95 % CI)
Diet/nutritional characteristic SEFatrium %CP+BM 3 0.00 0.22 %Browse 0.26 0.0002 (−0.0052 to 0.0056) %Browse+BM 3 1.15 0.12 %NDF 0.35 0.01 (−0.0062 to 0.0262) BM 2 1.31 0.12 %CP 0.20 0.0255 (−0.0198 to 0.0708) %NDF+BM 3 1.31 0.11 BM 0.82 0.0196 (0.0049 to 0.0343) %CP+BM+sex 4 1.99 0.08 Sex 0.34 0.004 (−0.1053 to 0.1132) Age 0.08 −0.0917 (−0.2467 to 0.0634) Sex*age 0.02 −0.046 (−0.1533 to 0.0612) SEFdorsal(% of SEFatrium)
%Browse 2 0.00 0.17 %Browse 0.45 −0.0046 (−0.0144 to 0.0052) %CP 2 0.87 0.11 %NDF 0.28 0.0081 (−0.0213 to 0.0375) %Browse+age 3 1.78 0.07 %CP 0.15 0.0045 (−0.0847 to 0.0937) %Browse+sex+age+sex*age 5 1.99 0.06 BM 0.17 0.0039 (−0.0259 to 0.0337) %NDF 2 2.04 0.06 Sex 0.38 −0.0868 (−0.2832 to 0.1096) Age 0.36 −0.0169 (−0.3111 to 0.2774) Sex*age 0.15 0.1971 (0.0061 to 0.3881) Body condition SEFatrium Rumen vol+BM 3 0.00 0.14 BCS 0.09 −0.2009 (−0.492 to 0.0902) Rumen vol 2 1.07 0.08 KFI 0.08 −0.024 (−0.2511 to 0.2031) Rumen vol+BM+sex 4 1.86 0.06 BMI 0.08 −0.0016 (−0.0111 to 0.0079)
Sex 2 2.06 0.05 Madrenal 0.13 0.1741 (−0.1954 to 0.5436) BM 2 2.36 0.04 KA 0.08 0.0173 (−0.015 to 0.0495) Rumen vol 0.37 −0.0307 (−0.065 to 0.0035) BM 0.38 0.0282 (−0.0005 to 0.0569) Sex 0.38 0.0295 (−0.1412 to 0.2003) Age 0.21 −0.2411 (−0.516 to 0.0337) Sex*age 0.02 −0.0334 (−0.1993 to 0.1324) SEFdorsal(% of SEFatrium)
Sex+age+sex*age 4 0.00 0.13 BCS 0.09 0.0526 (−0.2964 to 0.4016) BMI 2 1.17 0.07 KFI 0.16 −0.4549 (−0.8305 to −0.0793) KFI+sex+age+sex*age 5 1.33 0.07 BMI 0.21 0.0129 (−0.0055 to 0.0313) BMI+sex+age+sex*age 5 1.98 0.05 Madrenal 0.10 −0.3945 (−0.9685 to 0.1794) KA 2 2.05 0.05 KA 0.14 −0.0226 (−0.0605 to 0.0153) Rumen vol 0.09 −0.0237 (−0.0687 to 0.0212) BM 0.14 0.0284 (−0.0106 to 0.0674) Sex 0.55 −0.1431 (−0.401 to 0.1148) Sge 0.52 −0.0097 (−0.3517 to 0.3324) Sex*age 0.39 0.3662 (0.112 to 0.6204) Bold type indicates parameters where the unconditional 95 % confidence intervals exclude zero
K is the number of parameters in model, withe Akaike weights (model scoring from 0 to 1, where 1 indicates best-fit),Σwithe sum of wifor all models
containing the relevant parameter; %NDF and %CP are presented in terms of dry matter content of the rumen
Different body condition indices represent different stages of reserve depletion. Whereas the KFI can fluctuate due to short-term food shortages and hence indicates short-term re-source access, the BMI is a more long-term indicator of body condition that only begins to drop during very late stages of declines in body condition. Therefore, there is no linear cor-relation between the KFI and the BMI but a clear two-stage relationship where kidney fat is mobilised in times of energy deficiency prior to bone marrow fat, whose mobilisation only
occurs when other body fat stores are depleted (Fig.3f). This pattern has been described in a large variety of ungulates (Lochmiller et al. 1985; Nieminen and Laitinen 1986; Shackleton and Granger 1989; Li et al. 2000; Takatsuki 2000; Cook et al. 2001), including impalas (Hanks et al. 1976; Gallivan et al.1995).
The significant relationships between rumen volume and dietary protein with adrenal gland proxies (Figs. 3n, o and 4h) appear informative: Rumen volume
Table 3 Best-supported models and multiple-model parameter estimates for relationships between rumen papillae histology scores with diet and nutritional characteristics. Body mass, sex and age are covariates. Sex*age indicates the interaction term
Model-averaged parameter estimates
Model K ΔAICc wi Variable Σwi Estimate (95 % CI)
Hyperplasia %NDF+sex+age 4 0.00 0.15 %Browse 0.11 −0.0009 (−0.0035 to 0.0017) %NDF+sex 3 0.09 0.14 %NDF 0.14 −0.0082 (−0.0161 to −0.0002) Sex+age 3 0.79 0.10 %CP 0.48 0.0033 (−0.02 to 0.0267) Sex 2 1.25 0.08 BM 0.14 −0.0054 (−0.0138 to 0.0031) %NDF+BM+sex 4 2.13 0.05 Sex 0.83 0.0464 (−0.0073 to 0.1001) Age 0.51 0.0856 (0.0026 to 0.1686) Sex*age 0.11 −0.0186 (−0.0699 to 0.0326) Dilatation %Browse+sex 3 0.00 0.11 %Browse 0.39 0.006 (0.0011 to 0.0108) Sex 2 0.07 0.11 %NDF 0.11 −0.0038 (−0.0199 to 0.0122) %NDF+sex 3 1.01 0.07 %CP 0.19 0.0449 (0.0037 to 0.0862) %Browse+BM 3 1.09 0.06 BM 0.30 0.0108 (−0.004 to 0.0256) %Browse 2 1.16 0.06 Sex 0.71 −0.0067 (−0.1075 to 0.094) Age 0.28 −0.0375 (−0.1905 to 0.1154) Sex*age 0.11 −0.0574 (−0.153 to 0.0381) Vesicular cell frequency
Age 2 0.00 0.12 %Browse 0.20 −0.0005 (−0.0042 to 0.0033) Sex 2 0.58 0.09 %NDF 0.20 0.0005 (−0.011 to 0.0121) %NDF 2 0.91 0.08 %CP 0.20 −0.0073 (−0.0411 to 0.0265) BM 2 0.93 0.08 BM 0.20 −0.006 (−0.0183 to 0.0064) %CP 2 0.93 0.08 Sex 0.39 −0.0051 (−0.0802 to 0.07) Age 0.39 0.0684 (−0.051 to 0.1878) Sex*age 0.06 0.0329 (−0.0395 to 0.1053) Cell ballooning %Browse+sex+age+sex*age 5 0.00 0.38 %Browse 1.00 0.0062 (0.0032 to 0.0091) %Browse 2 1.78 0.16 %NDF 0.00 −0.0053 (−0.0151 to 0.0044) %Browse+sex 3 1.80 0.16 %CP 0.00 0.0165 (−0.0082 to 0.0412) %Browse+sex+age 4 2.51 0.11 BM 0.10 0.0057 (−0.0035 to 0.0149) %Browse+age 3 2.82 0.09 Sex 0.70 −0.0033 (−0.0611 to 0.0545) Age 0.58 −0.0667 (−0.1578 to 0.0244) Sex*age 0.38 −0.0553 (−0.1092 to −0.0015) Bold type indicates parameters where the unconditional 95 % confidence intervals exclude zero
K is the number of parameters in model, wiAkaike weights (model scoring from 0 to 1, where 1 indicates best-fit),Σwithe sum of wifor all models
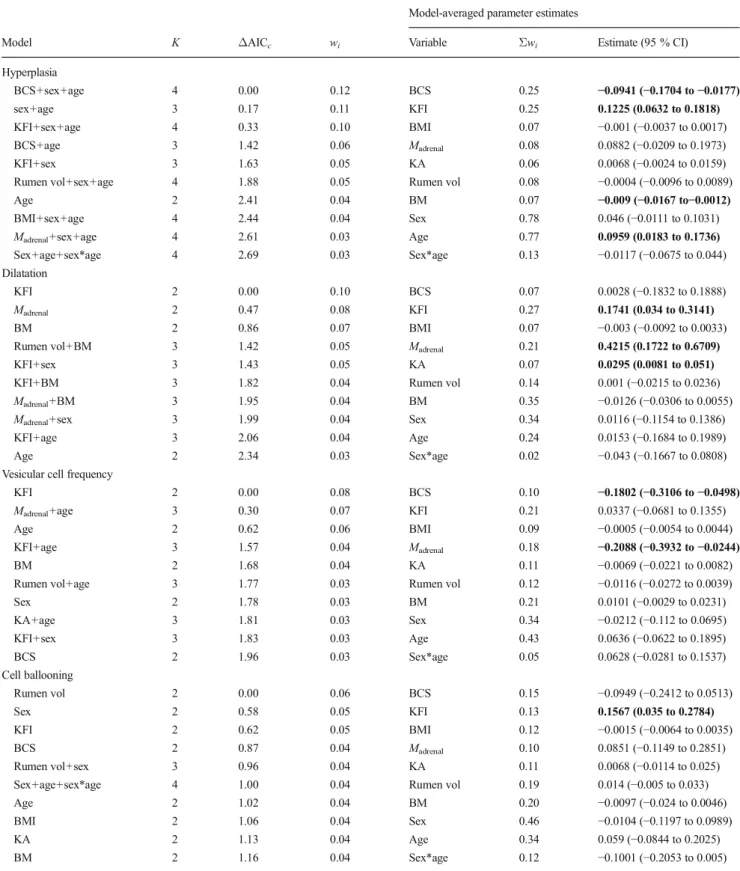
Table 4 Best-supported models, and multiple-model parameter estimates, for relationships between rumen papillae histology scores with body condition indices. Body mass, sex and age are covariates
Model-averaged parameter estimates
Model K ΔAICc wi Variable Σwi Estimate (95 % CI)
Hyperplasia BCS+sex+age 4 0.00 0.12 BCS 0.25 −0.0941 (−0.1704 to −0.0177) sex+age 3 0.17 0.11 KFI 0.25 0.1225 (0.0632 to 0.1818) KFI+sex+age 4 0.33 0.10 BMI 0.07 −0.001 (−0.0037 to 0.0017) BCS+age 3 1.42 0.06 Madrenal 0.08 0.0882 (−0.0209 to 0.1973) KFI+sex 3 1.63 0.05 KA 0.06 0.0068 (−0.0024 to 0.0159)
Rumen vol+sex+age 4 1.88 0.05 Rumen vol 0.08 −0.0004 (−0.0096 to 0.0089)
Age 2 2.41 0.04 BM 0.07 −0.009 (−0.0167 to−0.0012)
BMI+sex+age 4 2.44 0.04 Sex 0.78 0.046 (−0.0111 to 0.1031)
Madrenal+sex+age 4 2.61 0.03 Age 0.77 0.0959 (0.0183 to 0.1736) Sex+age+sex*age 4 2.69 0.03 Sex*age 0.13 −0.0117 (−0.0675 to 0.044) Dilatation
KFI 2 0.00 0.10 BCS 0.07 0.0028 (−0.1832 to 0.1888)
Madrenal 2 0.47 0.08 KFI 0.27 0.1741 (0.034 to 0.3141)
BM 2 0.86 0.07 BMI 0.07 −0.003 (−0.0092 to 0.0033)
Rumen vol+BM 3 1.42 0.05 Madrenal 0.21 0.4215 (0.1722 to 0.6709)
KFI+sex 3 1.43 0.05 KA 0.07 0.0295 (0.0081 to 0.051)
KFI+BM 3 1.82 0.04 Rumen vol 0.14 0.001 (−0.0215 to 0.0236)
Madrenal+BM 3 1.95 0.04 BM 0.35 −0.0126 (−0.0306 to 0.0055) Madrenal+sex 3 1.99 0.04 Sex 0.34 0.0116 (−0.1154 to 0.1386)
KFI+age 3 2.06 0.04 Age 0.24 0.0153 (−0.1684 to 0.1989)
Age 2 2.34 0.03 Sex*age 0.02 −0.043 (−0.1667 to 0.0808)
Vesicular cell frequency
KFI 2 0.00 0.08 BCS 0.10 −0.1802 (−0.3106 to −0.0498)
Madrenal+age 3 0.30 0.07 KFI 0.21 0.0337 (−0.0681 to 0.1355)
Age 2 0.62 0.06 BMI 0.09 −0.0005 (−0.0054 to 0.0044)
KFI+age 3 1.57 0.04 Madrenal 0.18 −0.2088 (−0.3932 to −0.0244)
BM 2 1.68 0.04 KA 0.11 −0.0069 (−0.0221 to 0.0082)
Rumen vol+age 3 1.77 0.03 Rumen vol 0.12 −0.0116 (−0.0272 to 0.0039)
Sex 2 1.78 0.03 BM 0.21 0.0101 (−0.0029 to 0.0231) KA+age 3 1.81 0.03 Sex 0.34 −0.0212 (−0.112 to 0.0695) KFI+sex 3 1.83 0.03 Age 0.43 0.0636 (−0.0622 to 0.1895) BCS 2 1.96 0.03 Sex*age 0.05 0.0628 (−0.0281 to 0.1537) Cell ballooning Rumen vol 2 0.00 0.06 BCS 0.15 −0.0949 (−0.2412 to 0.0513) Sex 2 0.58 0.05 KFI 0.13 0.1567 (0.035 to 0.2784) KFI 2 0.62 0.05 BMI 0.12 −0.0015 (−0.0064 to 0.0035) BCS 2 0.87 0.04 Madrenal 0.10 0.0851 (−0.1149 to 0.2851) Rumen vol+sex 3 0.96 0.04 KA 0.11 0.0068 (−0.0114 to 0.025)
Sex+age+sex*age 4 1.00 0.04 Rumen vol 0.19 0.014 (−0.005 to 0.033)
Age 2 1.02 0.04 BM 0.20 −0.0097 (−0.024 to 0.0046)
BMI 2 1.06 0.04 Sex 0.46 −0.0104 (−0.1197 to 0.0989)
KA 2 1.13 0.04 Age 0.34 0.059 (−0.0844 to 0.2025)
BM 2 1.16 0.04 Sex*age 0.12 −0.1001 (−0.2053 to 0.005)
Bold type indicates parameters where the unconditional 95 % confidence intervals exclude zero
K is the number of parameters in model, withe Akaike weights (model scoring from 0 to 1, where 1 indicates best-fit),Σwithe sum of wifor all models
containing the relevant parameter; %NDF and %CP are presented in terms of dry matter content of the rumen
was not related to any other measure of body condition; the data suggest that conditions (of low diet quality) that lead impala to ingest increasing amounts of food also represent stress factors. These findings support personal observations cited in Grant et al. (1995) that link periods of lower diet quality to higher urinary cortisol levels. BCS and KFI were significantly posi-tively related to body mass (Table 1), which mainly suggests that mature animals can accrete more body stores than younger animals. The data plots show, cor-respondingly, a large range of body condition proxies at mature body masses (Fig. 4b, d). By contrast, the inde-pendence of KA from body mass suggests that his proxy can indicate various stressful states irrespective of the maturity of the animals.
A general trend emerging in our data is that %browse intake was negatively, and %NDF and %CP positively, related to body condition. This finding supports the above interpretation that an increased dietary browse component is associated with a decrease in diet quality. Notably, rumen volume was negatively related to diet quality (%CP), implying that a large rumen volume might indicate poor nutritional status. In contrast to many animals from temperate environments, where food intake is commonly increased with increased diet quality (Meyer et al. 2010), these data suggest that impala ingest a higher amount of the lower-quality diet, and hence try to compensate for low diet quality with increasing intake.
Rumen papillation patterns
We predicted that the general intraruminal papillation pattern would show less heterogeneity with an increase in %browse intake, based on an interspecific analysis (Codron and Clauss (2010)) which revealed more homogenous rumen contents, and hence less stratification of both contents and the corre-sponding papillation pattern, in species ingesting higher levels of browse in their natural diet. However, the present data provide poor support for such a relationship at the intraspecies level. Similarly, no proxy for body condition appeared to be significantly correlated with papillation patterns. Therefore, irrespective of the enormous variation documented in papillation patterns (reviewed in Clauss et al.2009), rumen papillation appears to be a poor diagnostic for an intraspecific evaluation of the nutrition status of wild ruminants.
Rumen histology
These results indicate that the histological morphology of the ruminal mucosa offers little potential to evaluate the nutrition-al status of the animnutrition-al or habitat qunutrition-ality. The only exception could be the presence of cell ballooning, which appears to be related to low-quality diets in the impalas of this study. This apparently contrasts with observations by Hofmann (1973, p.
307), who found increased ballooning after the onset of fresh grass availability, and also described most distinct develop-ment of balloon cells in other wild ruminants with the onset of the rainy season (Hofmann and Schnorr 1982). Similar findings were made for other wild and domestic ruminants by Hofmann et al. (1976) and Urban (1990). On the other hand, experimental work with domestic cattle showed that ballooning cells became more prominent in a dairy cow when switched from a high-concentrate diet (crude fibre content 10 % of dry matter) to a silage (crude fibre content 21 %) (Kauffold1975; Kauffold et al.1975). Similarly, Liebich et al. (1987) found an increasing amount of ballooning cells in the stratum corneum over time in cattle switched from a typical dairy ration (crude fibre 10 %) to a low-energy dry period ration (crude fibre 25 %); after switching to a high-energy ration (crude fibre 16 %) again, ballooning cells progressively disappeared. The apparent contradiction with the findings in wild ruminants (Hofmann1973; Hofmann and Schnorr1982) could potentially be explained by the fact that in wild rumi-nants sampled at the very onset of the rainy season, the status of the stratum corneum could still reflect the lower-quality food of the preceding dry period. It is tempting to interpret the presence of ballooning cells in the stratum corneum as an indication for a comparatively slow cell turnover on low-energy diets, which allows cells to increase in size; the ab-sence of such cells could indicate a higher proliferation rate of the epithelium (Sakata and Tamate 1978, 1979; Shen et al. 2004), which is sloughed off before its cells can increase in size. However, more experimental work is needed to elucidate whether ballooning of epithelial cells is linked to a single cause. As a proxy of nutritional status, it is evidently impractical.
Conclusions
The results of this study indicate that papillation patterns of the ruminal mucosa, and histological evaluations of the rumen papillae, are not suitable proxies for habitat or nutritional status evaluation in impala and, possibly, other wild rumi-nants. Many of the various body condition indicators in this study confirm that a high proportion of browse in the digestive tract indicates a scarcity of high-quality food in impala. Amongst the various body condition proxies, no distinct ad-vantage of a particular score is evident. However, due to the consistent correlation with other scores and the ease of appli-cation, a simple body condition score (Honhold et al.1989) appears the most practical, and could even be modified to be based on visual clues only (Gaidet and Gaillard2008). When using most condition proxies, the effect of body mass (and hence age in general) needs to be considered. In general, the use of body condition indices for habitat evaluation may be difficult because control groups of the same age, sex and
reproductive status are needed (Gallivan et al.1995). Addi-tionally, the body condition of impala can additionally be affected by between-year effects (such as rainfall) and by density (Gaidet and Gaillard 2008), which further complicates comparisons between habitats. The fact that the ratio of kidney to adrenal mass was independent of body mass, and correlated well with other body condition and diet quality proxies, indicates that this proxy has more potential than initially concluded by Smith (1970) and suggests that assessing parameters related to the stress status of animals may be a fruitful area of further research.
Acknowledgments This study was funded by the J.F. Kapnek Chari-table Trust, the John Wakeford Scholarship Trust and International Wild-life Veterinary Services. Field assistance from M. Hitschman, P. and J. Seymour-Smith, R. Style and E. Nabula, is gratefully acknowledged. The finalisation of this manuscript was facilitated by the Zoo Research Camp of the National Zoological Gardens of Pretoria and the Vetsuisse Faculty of Zurich University. We thank two anonymous reviewers for their comments on the manuscript.
References
AOAC (1997) Official methods of analysis. Association of Official Analytical Chemists, Arlington
Attwell CAM, Bhika M (1985) Feeding ecology of impala on Starvation Island, Lake Kariba. S Afr J Wildl Res 15:41–48
Blanchard P, Fritz H (2008) Seasonal variation in rumination parameters of free-ranging impalas (Aepyceros melampus). Wildl Biol 14:372– 378
Brooks PM, Hanks J, Ludbrook JV (1977) Bone marrow as an index of condition in African ungulates. S Afr J Wildl Res 7:61–66 Burnham KP, Anderson DR (2001) Kullback-Leibler information as a
basis for strong inference in ecological studies. Wildl Res 28:111– 119
Burnham KP, Anderson DR (2002) Model selection and multimodel inference: a practical information-theoretic approach. Springer, New York
Clauss M, Hofmann RR, Fickel J, Streich WJ, Hummel J (2009) The intraruminal papillation gradient in wild ruminants of different feed-ing types: implications for rumen physiology. J Morphol 270:929– 942
Codron D, Clauss M (2010) Rumen physiology constrains diet niche: linking digestive physiology and food selection across wild rumi-nant species. Can J Zool 88:1129–1138
Codron D, Codron J, Lee-Thorp JA, Sponheimer M, de Ruiter D, Brink JS (2006) Dietary variation in impala (Aepyceros melampus) record-ed by carbon isotope composition of faeces. Acta Zool Sin 52:1015– 1025
Codron D, Lee-Thorp JA, Sponheimer M, Codron J (2007) Nutritional content of savanna plant foods: implications for browser/grazer models of ungulate diversification. Eur J Wildl Res 53:100–111 Cook RC, Cook JG, Murray DL, Zager P, Johnson BK, Gratson MW
(2001) Development of predictive models of nutritional condition for Rocky Mountain elk. J Wildl Manag 65:973–987
Copeland SR, Sponheimer M, Spinage CA, Lee-Thorp JA, Codron D, Reed KE (2009) Stable isotope evidence for impala (Aepyceros melampus) diets at Akagera National Park, Rwanda. Afr J Ecol 47:490–501
Dunham KM (1980) The diet of impala (Aepyceros melampus) in the Sengwa Wildlife Research Area. J Zool 192:41–57
Dunham KD (1982) The foraging behaviour of impala (Aepyceros melampus). S Afr J Wildl Res 12:36–40
Dunham KM, Murray MG (1982) The fat reserves of impala (Aepyceros melampus). Afr J Ecol 20:81–87
Gaidet N, Gaillard J-M (2008) Density-dependent body condition and recruitment in a tropical ungulate. Can J Zool 86:24–32
Gallivan GJ, Culverwell J, Girdwood R (1995) Body conditions indices of impala (Aepyceros melampus): effect of age class, sex, season and management. S Afr J Wildl Res 25:23–31
Goering HK, Van Soest PJ (1970) Forage fiber analyses. Agriculture Handbook 379. Agricultural Research Service, USDA, Washington DC
Grant CC, Meissner HH, Schultheiss WA (1995) The nutritive value of veld as indicated by faecal phosphorous and nitrogen and its relation to the condition and movement of prominent ruminants during the 1992–1993 drought in the Kruger National Park. Koedoe 38:17–31 Gwynne MD, Bell RHV (1968) Selection of vegetation components by grazing ungulates in the Serengeti National Park. Nature 220:390–393 Hanks J, Cumming DHM, Orpen JL, Parry DF, Warren HB (1976) Growth, condition and reproduction in the impala ram (Aepyceros melampus). J Zool 179:421–435
Hill RH (1982) Effect of dietary extremes on impala (Aepyceros melampus) rumen epimural flora. Appl Environ Microbiol 44: 198–202
Hoffman LC (2000) The yield and carcass chemical composition of impala (Aepyceros melampus), a southern African antelope species. J Sci Food Agric 80:752–756
Hofmann RR (1973) The ruminant stomach, vol 2. East African mono-graphs in biology. East African Literature Bureau, Nairobi Hofmann RR, Schnorr B (1982) Die funktionelle Morphologie des
Wiederkäuer-Magens. Ferdinand Enke Verlag, Stuttgart
Hofmann RR, Stewart DRM (1972) Grazer or browser: a classification based on the stomach-structure and feeding habit of East African ruminants. Mammalia 36:226–240
Hofmann RR, Geiger G, König R (1976) Vergleichend-anatomische Untersuchungen an der Vormagenschleimhaut von Rehwild (Capreolus capreolus) und Rotwild (Cervus elaphus). Z Säugetierkd 41:167–193
Honhold N, Petit H, Halliwell RW (1989) Condition scoring scheme for small East African goats in Zimbabwe. Trop Anim Helath Prod 21: 121–127
Howells WW, Hanks J (1975) Body growth of the impala (Aepyceros melampus) in Wankie National Park, Rhodesia. J S Afr Wildl Manag Assoc 5:95–98
Hummel J, Südekum K-H, Streich WJ, Clauss M (2006) Forage fermen-tation patterns and their implications for herbivore ingesta retention times. Funct Ecol 20:989–1002
Kauffold P (1975) Strukturen und Funktionen der Pansenschleimhaut und ihre Beeinflussung durch Nahrungsfaktoren. Dissertation thesis, University of Rostock
Kauffold P, Voigt J, Piatkowski B (1975) Studies of the influence of nutritional factors on the ruminal mucosa. 1. Structure and function-al state of the ruminfunction-al mucosa after feeding of extreme rations and abrupt change in nutrition. Arch Anim Nutr 25:247–256
Kos M, Hoetmer AJ, Pretorius Y, de Boer WF, de Knegt H, Grant CC, Kohi E, Page B, Peel M, Slotow R, van der Waal C, Van Wieren SE, Prins HHT, van Langevelde F (2012) Seasonal diet changes in elephant and impala in mopane woodland. Eur J Wildl Res 58: 279–287
Lane EP, Kock ND, Hill FWG (1994) Age determination in free-ranging impala (Aepyceros melampus). Zimb Vet J 25:14–25
Li J-S, Zhou H-L, Yuan L, Zhang D-M (2000) A comparison of several indices for assessing body condition of Mongolian gazelle. J For Res 11:245–248
Liebich HG, Dirksen G, Arbel A, Dori S, Mayer E (1987) Feed-dependent changes in the rumen mucosa of high-producing cows from the dry period to eight weeks post partum. J Vet Med A 34:661–672 Lochmiller RL, Hellgren EC, Grant WE, Varner LW (1985) Bone marrow
fat and kindey fat indices of condition in collared peccaries. J Mammal 66:790–795
Marshal JP, Grange S, Marneweck D (2012) Seasonal variation in body condition of impala at Manyeleti Game Reserve, South Africa. S Afr J Wildl Res 42:128–137
Meissner H, Pieterse E, Potgieter JHJ (1996) Seasonal food selection and intake by male impala (Aepyceros melampus) in two habitats. S Afr J Wildl Res 26:56–63
Meyer K, Hummel J, Clauss M (2010) The relationship between forage cell wall content and voluntary food intake in mammalian herbi-vores. Mammal Rev 40:221–245
Monro RH, Skinner JD (1979) A note on condition indices for adult male impala (Aepyceros melampus). S Afr J Anim Sci 9:47–51 Nieminen M, Laitinen M (1986) Bone marrow and kidney fat as
indica-tors of condition in reindeer. Rangifer Spec Issue 1:219–226 Ocaido M, Siefert L, Baranga J (1999) Seasonal changes of impala
(Aepyceros melampus) faecal helmith egg counts through a one-year period. Afr J Ecol 37:327–333
Riney T (1960) A field technique for assessing physical condition of some ungulates. J Wildl Manag 24:92–94
Sakata T, Tamate H (1978) Rumen epithelial cell proliferation accelerated by rapid increase in intraruminal butyrate. J Dairy Sci 61:1109–1113 Sakata T, Tamate H (1979) Rumen epithelial cell proliferation accelerated
by propionate and acetate. J Dairy Sci 62:49–52
Schnorr B, Vollmerhaus B (1967) Das Oberflächenrelief der Pansenschleimhaut bei Rind und Ziege [The surface relief of the ruminal mucosa in the ox and goat]. J Vet Med Ser A 14:93–104 Shackleton CM, Granger JE (1989) Bone marrow fat index and
kidney-fat index of several antelope species from Transkei. S Afr J Wildl Res 19:129–134
Shen Z, Seyfert HM, Löhrke B, Schneider F, Zitnan R, Chudy A, Kuhla S, Hammon HM, Blum JW, Martens H, Hagemeister H, Voigt J (2004) An energy-rich diet causes rumen papillae proliferation associated with more IGF type 1 receptors and increased plasma IGF-1 concentrations in young goats. J Nutr 134:11–17
Smith NS (1970) Appraisal of condition estimation methods for East African ungulates. E Afr Wildl J 8:123–129
Sponheimer M, Grant CC, De Ruiter DJ, Lee-Thorp JA, Codron DM, Codron J (2003) Diets of impala from Kruger National Park: evi-dence from stable carbon isotopes. Koedoe 46:101–106
Takatsuki S (2000) Kidney fat and marrow fat indices of the sika deer population at Mount Goyo, northern Japan. Ecol Res 15:453–457 Urban U (1990) Morphological studies on nutrition-dependent regression
and proliferation of rumen mucosa of wild African ruminants com-pared with Karakul sheep. Dissertation thesis, University of Munich Van Rooyen AF (1992) Diets of impala and nyala in two game reserves in
Natal, South Africa. S Afr J Wildl Res 22:98–101
Walker BH (1970) An evaluation of eight methods of botanical analysis on grasslands in Rhodesia. J Appl Ecol 7:403–416
Walker BH (1975) An approach to the monitoring of changes in the composition and utilization of woodland and savanna vegetation. S Afr J Wildl Res 6:1–13