HAL Id: hal-01344073
https://hal.archives-ouvertes.fr/hal-01344073
Submitted on 11 Jul 2016
HAL is a multi-disciplinary open access
archive for the deposit and dissemination of
sci-entific research documents, whether they are
pub-lished or not. The documents may come from
teaching and research institutions in France or
abroad, or from public or private research centers.
L’archive ouverte pluridisciplinaire HAL, est
destinée au dépôt et à la diffusion de documents
scientifiques de niveau recherche, publiés ou non,
émanant des établissements d’enseignement et de
recherche français ou étrangers, des laboratoires
publics ou privés.
The Package Server Location Problem
Arnaud Malapert, Jean-Charles Régin, Jean Parpaillon
To cite this version:
Arnaud Malapert, Jean-Charles Régin, Jean Parpaillon. The Package Server Location Problem.
ICORES 2013, Feb 2013, Barcelona, Spain. �hal-01344073�
The Package Server Location Problem
Arnaud Malapert
1, Jean-Charles Régin
1and Jean Parpaillon
21Laboratoire d’Informatique, Signaux et Systèmes de Sophia-Antipolis (I3S) CNRS UMR7271, Université Nice Sophia Antipolis, Sophia Antipolis, France
2Mandriva, 32 rue Trevise, 75009 Paris, France [email protected], [email protected]
Keywords: Multi-objective Optimization, Mixed Integer Linear Programming, Network Location Model.
Abstract: In this paper, we introduce a new multi-objective optimization problem derived from a real-world application: the package server location problem. A number of package servers are to be located at nodes of a network. Demand for these package servers is located at each node, and a subset of nodes are to be chosen to locate one or more package servers. Each client is statically associated to a package server. The objective is to minimize the number of package servers while maximizing the efficiency and the reliability of the broadcast of packages to clients. These objectives are contradictory: the broadcast becomes more efficient as the number of servers increases. This problem is analyzed as a multi-objective optimization problem and a mathematical formulation is proposed. In addition, the criteria combination can be specified via a small dedicated language. Results for exact multi-objective solution approaches based on mixed integer linear programming are reported.
1
INTRODUCTION
Allocating services to servers of an existing com-puter network is a complex and difficult task for the administrators. Indeed, services are interrelated on nodes of the network under several constraints (node capacities, incompatibilities between services . . . ). Moreover, the administrators consider simultaneously multiple and contradictory objectives or preferences (cost, performance, reliability, energy consumption). Thus, a decision tool which can provide solutions meeting these goals is valuable. Mandriva1, a French software company, must accomplish such a task in the deployment of one of their product. This com-pany is well-known for its public open source dis-tribution of operating system: Mandriva Linux. It also offers product solutions for companies to manage their computer network infrastructure. Pulse2 is an open-source tool that simplifies application deploy-ment, inventory, and maintenance of computer net-works. It helps organizations ranging from a few computers to more than 100 000 heterogeneous com-puters spread over more than 1000 facilities to inven-tory, maintain, update and take full control on their facilities. On one hand, Pulse2 helps manage net-works of french governmental agencies or real estate offices. On the other hand, it also helps manage
net-1http://www.mandriva.com/
work mainly composed of gaming or ATM terminals. The user can supervise large-scale facilities through a single web interface console, create and deploy hard disk images of its computers, perform software and hardware inventory, and deploy new softwares and updates. Pulse2 is installed on the top of an existing infrastructure and provides a cross-platform software distribution service even for remote locations with a limited bandwidth. The architecture of Pulse2 is dis-tributed: Pulse2 is composed of agents communicat-ing with each other by various protocols (http, ssh, xml-rpc, etc). An agent is a piece of software that is replicated and distributed over hosts of the network, and is usually continuously connected to a central job scheduler. Distributed agents improve the robust-ness and the scalability of Pulse2, but have two major drawbacks: finding a feasible deployment of agents on hosts is difficult; upgrading them can cause severe production downtime. Features of Pulse2 are imple-mented through client-server models where comput-ers and agents respectively play the role of clients and servers. In other words, Pulse2 is a distributed ap-plication that allows the management by a central au-thority of application deployment and maintenance in a heterogeneous network.
An essential functionality of Pulse2 is the man-agement of software installations and updates, which can lead to network congestion and failures. A pack-age server, abbreviated as pserver, maintains the list
of software packages and serves them to its clients (computers). Each client is statically associated to a unique pserver by the central authority. Pulse2 al-lows to manage groups of clients thanks to its com-patibility with other resource-manager such as GLPI2. For instance, research and administration computers can have different software suites or security require-ments.
The deployment of pservers involves strategic de-cisions that are fundamental since they impact the ef-ficiency and reliability of the broadcast of packages from pservers to clients when large software pack-ages are installed or updated (such as an office suite) on hundreds or thousands of clients. An efficient broadcast reduces the completion time for serving all clients while avoiding network congestion. A reliable broadcast reduces the impact of link failures. Note that the flexibility of the design is important in view of uncertain scope of future additions to the network. The main contribution of the paper is twofold. We describe a new multi-objective optimization problem derived from a real-world application: the package server location problem (PSLP). Then, we propose a flexible and efficient decision support tool based on operational research methods for multi-criteria opti-mization. This paper is organized as follows. In Sec-tion 2, we describe the package server locaSec-tion prob-lem and discuss an example. In Section 3, we dis-cuss related works in the field of mixed integer lin-ear programming, cloud management, network de-sign and facility location, especially server location in computer networks. In Section 4, we present some concepts and discuss related works in the field of multi-objective optimization. In Section 5, we intro-duce a mathematical formulation and discuss in Sec-tion 6 our method to handle multi-objective optimiza-tion within an integer programming framework. Fi-nally, in Section 7, we show the interest of our ap-proach on a realistic use case and evaluate systemat-ically the impact of the criteria combination on the solving process.
2
THE PACKAGE SERVER
LOCATION PROBLEM
Description, Notations, and DefinitionsTree Network. According to the Mandriva Team, tree network is the most frequent structure adopted by its customers. Let N = [1, n] be the indices of the facilities organized as an oriented tree network
2http://www.glpi-project.org/
T
= (N, E). The pservers can be located at nodes (facilities) and the root node is called the central fa-cility. Each network link (i, j) ∈ E between a pair of facilities i ∈ N and j ∈ N is characterized by a real bandwidth Bi j and a boolean reliability ri j. The link bandwidth and reliability respectively allow to model network congestion and the probability of failure.Client-server Model. Each client must be associ-ated to a single pserver. Clients are locassoci-ated at facilities and partitioned into g groups, i.e. each client belongs to a unique group. Let ds
i be the demand at the facil-ity i ∈ N for the group s (s = 1, . . . , g). We assume that groups are treated independently by the central authority, i.e. packages are never installed or updated simultaneously for two groups.
For each type k ∈ K(= [1, m]) of pserver, the central authority determines its maximal number of clients (its capacity) Ckin order to provide the same service quality. Let Mikbe the maximal number of pservers of type k ∈ K which can be located at facility i. The cen-tral authority determines Mik by monitoring the net-work.
Package Broadcast. A package is broadcasted in two steps as follows. First, the root pserver located at the central facility receives the original package and broadcasts it to other pservers. As soon as they have received the full copy of the original package, pservers serve their clients. The broadcast is oriented, i.e. a pserver can only serve clients located at the same facility or in its descendants. Let define a spe-cial group (s = 0) for which the demand di0is equal to the number of pservers located at the facility i. Let S = [0, g] denote the stages where the initial stage (s = 0) represents the broadcast from the root pserver to other pservers and next stages represent the broad-cast from pservers to groups of clients.
Broadcast Model. We consider only the steady state of the broadcast of the traffic rather than the tran-sient state, i.e. we do not take into account sion times and path latencies (the sum of all transmis-sion times as well as the queuing inside the facilities). Indeed, the duration of the transient state is dominated by the maximal latency which is usually lower than the total duration of the broadcast. Furthermore, path latencies are hard to measure and more useful for op-erational decisions which affect the day-to-day imple-mentation of these strategic decisions.
We assume that the steady state of the broadcast of the traffic follows a model such that a) transfers are synchronous, b) a bandwidth is allocated to each transfer path in the network, c) the path bandwidth is
consumed simultaneously along its links during the transfer, d) the path bandwidth is shared equally by clients. Unlike distance, link bandwidths do not sum up in the path bandwidth. The path bandwidth is lim-ited by the minimum of link bandwidths, as this is the fastest any traffic can make through the path. The link bandwidth is shared by the traffic under consideration. The total bandwidth allocated to paths sharing a link must not exceed the link bandwidth.
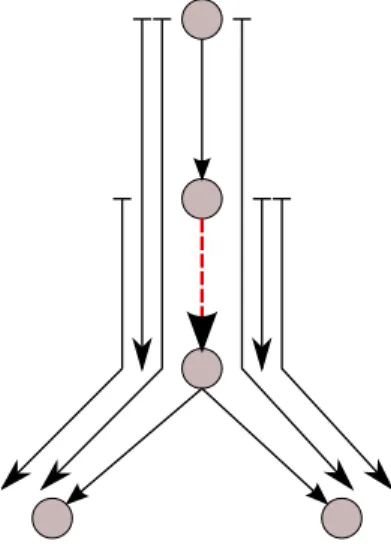
Figure 1 illustrates the broadcast model where fa-cilities are represented as nodes, links as arcs between nodes, and paths as arrows besides the tree. In this example, the traffic passing through the dashed link is composed of the paths from its origin, or its ances-tors, to its destination, or its descendants. The sum of path bandwidths must not exceed the bandwidth of the dashed link.
Similarly, the path reliability is limited by the less reliable link. If the path from the central facility to an-other facility is reliable, then the facility is said to be reliable. Note that we assume that local connections (the pserver and the client are located at the same fa-cility) are reliable and more efficient than connections between facilities.
Objectives. In summary, solving the problem boils down to a) select the number of pservers, b) select the type of pservers, c) select the location of pservers, d) associate pservers to clients subject to various ca-pacity and broadcast constraints. In general, we have several measures for the quality of the solutions. First, we aim to minimize the number of pservers or a cost function associated to their deployment. Then, we also aim to maximize the reliability of the transfer, i.e. maximizing the number of pservers located at reliable facilities and the number of reliable
connec-Figure 1: Broadcast model.
tions between pservers and clients. Besides, we aim to maximize the efficiency of the broadcast of pack-ages from pservers to clients by minimizing the total distance or maximizing the total allocated bandwidth. These objectives are contradictory: the broadcast be-comes more efficient as the number of pservers in-creases. That is to say that PSLP, in its generality, is a multi-objective optimization problem. The ability to express the kind of trade-off we want depends on the solving method.
Illustrative Example
Figure 2 gives a complete example composed of a small instance and several solutions. The instance contains 6 facilities, 3 levels, 1 type of pservers, and 1 group of 2500 clients. We can install as many pservers as needed in facilities and each pserver provides 500 connections. The tree network is represented in Fig-ure 2(a) where each facility i is drawn as a record in which the left cell contains its index i and the right cell contains its demand. There are two categories of link: strong links (bold arrows) are reliable and have a high bandwidth; weak links (dot-head arrows) are not reliable and have a low bandwidth.
To solve this problem, Mandriva’s engineers com-bine solutions obtained by different heuristics to build a “balanced” solution. First, let’s build two reliable solutions in which each pserver is connected to the root pserver located at the central facility by a reli-able path. The first centralized solution consists in 5 pservers located at the central facility (i = 1). In this case, 400 clients benefit from local connections while the central facility provides 550 and 1550 con-nections to its left and right subtrees respectively. Fig-ure 2(b) shows a solution as reliable but more efficient in which the facilities 1 and 3 respectively contain 2 and 3 pservers (indicated in the bottom cell). The link (i, j) is now labeled with the number of connections provided by the pservers of facility i to clients of the facility j. The dashed arrows are connections between a pair of facilities passing through a path rather than a single link. Thus, the total number of connections passing through link (1, 2) is the sum of connections of transfer paths (1, 2) and (1, 4). In this case, 1250 clients benefit from local connections and the central facility still provides 550 connections to its left sub-trees. This solution provides more local connections and the broadcast is more efficient in the right sub-tree. The traffic passing through the link (1, 3) de-creases from 1550 to 50 connections while the traffic passing through (3, 5) and (3, 6) remains unchanged. Moreover, several transfer paths have been shortened whereas no one has been lengthened.
efficiency rather than reliability. The facilities 1, 2, 5 contain a single pserver whereas the facility 3 con-tains 2 pservers. In this case, the pservers located at the facilities 2 and 5 are not connected to the cen-tral facility by a reliable path. However, 1850 clients benefit from local connections and only 650 connec-tions pass through the network. The solution in Fig-ure 2(d) reduces the number of connections passing through the network from 650 to 550. Note that a fur-ther analysis is required to determine which of the two last solutions is preferred.
To conclude, it would be very difficult to express trade-offs between the reliability and the efficiency using a heuristic because these objectives are contra-dictory. Indeed, installing pservers in highest levels of the tree network gives solution more robust, scalable (if the numbers of clients increases), and reliable, but possibly less efficient.
3
RELATED WORK
Our problem is related to research about mixed inte-ger linear programming, network design, cloud man-agement, and facility location, especially server loca-tion in computer networks.
Mixed Integer Linear Programming
A mixed-integer program is the minimization or max-imization of a linear function subject to linear con-straints. Since more than 50 years, Mixed Integer Linear Programming (MILP) theory and practice has been significantly developed and is now an indispens-able tool in Operations Research and Management Science (Guignard-Spielberg and Spielberg, 2005). Two reasons for the success of MILP are Linear Pro-gramming (LP) based solvers and the modelling flex-ibility of MILP. We now have several extremely ef-fective state of the art solvers (IBM, 2012; Gurobi Optimization, 2012) that incorporate many advanced techniques and, since its early stages, MILP has been used to model a wide range of applications (Dantzig, 1960). Since then, MILP has been applied in dif-ferent industrial application areas, such as supply chain management (Beamon, 1998), production plan-ning (Wu and Shi, 2011), healthcare (Ferris et al., 2006), and airline fleet scheduling (Sherali et al., 2010).
Network Design
In the network design problem (Johnson et al., 1978), a weighted undirected graph is given. We wish to find
a subgraph which connects all the original nodes and minimizes the sum of the shortest path weights be-tween all nodes pairs, subject to a budget constraint on the sum of its edge weights. Usually, the cost of an edge is a concave function of its capacity. Addition-ally, there can be a demand between pairs of nodes of the network that corresponds to sending some product along a path between these two nodes. The quantities that pass through an edge are subject to an edge ca-pacity constraint.
There is a relation between the bandwidth of PSLP and the edge capacity of the network design problem. However, it is also quite different because we need to determine the number of pservers, their types and lo-cations. Moreover, the demand between pservers and clients has also to be determined whereas it is given in the network design problem. Last, the criteria com-bination used for PSLP is different because links al-ready exist and it does not make any difference to use it or not.
Cloud Management
Cloud computing industry faces many decision prob-lems where operations research could add tremen-dous value (Iyoob et al., 2012). Indeed, the paradigm shift from IT as a product to IT as a service and the accompanying flexibility gives rise to a vast ar-ray of resource management decisions. The flexibil-ity and elasticflexibil-ity of cloud computing is enabled by virtualization, which allows to the control of comput-ing resources to be physically separated from the re-sources themselves. There are three major players in the Cloud IT Supply Chain: a) providers (compute, storage, and network) b) consumers (individual and enterprises) c) brokers (equivalent of third-party lo-gistics).
Cloud providers costs are primarily tied to their assets and the maintenance of these assets. Some of these strategic problems are related to PSLP as they involve capacity, location planning and service levels. But, they concern physical resources (servers, infras-tructure, power draw, network) whereas we focus on the deployment of a distributed application.
The operational problem of assigning virtual ma-chine to hosts subject to capacity constraints for sev-eral dimensions (CPUs, memories . . . ) is very differ-ent because the optimization criteria concern load bal-ancing or scheduling. Consumer problems concern the capacity planning and scheduling of virtual ma-chines in order to minimize subscription costs. Last, broker problems concern the provider’s choice as well as inter-provider transformation and migration abili-ties.
1 400 2 200 3 850 4 350 5 500 6 200 (a) Instance 1 400 2 2 200 200 3 850 3 0 4 350 350 6 200 50 0 5 500 500 150 (b) Reliable solution 1 400 1 2 200 1 50 3 850 2 50 4 350 350 5 500 1 0 6 200 200 (c) Efficient solution 1 400 1 2 200 1 0 3 850 2 0 4 350 50 6 200 50 300 5 500 1 0 150
(d) More efficient solution? Figure 2: Instance and solution examples.
Facility Location
In network location models (Berman and Krass, 2002), the underlying topology is that of a net-work, with the possible location of facilities includ-ing nodes, as well as edges of the network. These problems often extend the classical median and p-center problems in different directions, including: in-corporating interactions between facilities; consider-ing multi-objective models, integratconsider-ing location and routing decisions; and considering problems with ro-bust decision criteria. In the p-center problem, we aim to minimize the maximum distance between a client and the facility to which he is allocated. In the p-median problem, we aim to minimize the sum of the shortest demand weighted distance between clients and facilities. In both cases, each client selects the closest facility.
In discrete location models, the set of potential fa-cility locations is discrete – often consisting of nodes of the underlying network. Due to the restricted lo-cation set, the underlying problem is somewhat eas-ier – allowing for greater realism in the models. In stochastic demand/congestion models, this sub-class of discrete location models allows for demand to be stochastic and explicitly models congestion (queuing) at the facilities. In a stochastic environment, demand for service generated at nodes of the network are ran-dom variables and the time to service calls is also probabilistic. The location of servers has been
ad-dressed as stochastic models (Berman and Drezner, 2007; Aboolian et al., 2009) in which servers are modeled as stochastic queues for which the theory enables the mathematical analysis of several related processes, including arriving at the queue, waiting in the queue, and being served at the front of the queue. PSLP is strongly related to network location mod-els because we want to choose locations hosting pserver in an existing network with opening costs. However, the optimality criteria are different, espe-cially when it involves the concept of bandwidth. Fur-thermore, each client selects the closest facility in fa-cility location models whereas a client is explicitly as-sociated to a pserver by the central authority in the PSLP.
4
MULTI-OBJECTIVE
OPTIMIZATION
Multi-objective optimization (or multi-objective pro-gramming or "pareto optimization") (Sawaragi et al., 1985; Steuer, 1986) also known as multi-criteria or multi-attribute optimization, is the process of simul-taneously optimizing two or more conflicting objec-tives subject to certain constraints. Many interac-tive and non-interacinterac-tive methods have been proposed for multi-objective mixed integer programming prob-lems (Alves and Clímaco, 2007). In the last years,
there have been many developments devoted to par-ticular multi-objective combinatorial problems (such as location, scheduling, knapsack, shortest-path prob-lems, etc). The researchers’ attention has also focused on the use of meta-heuristics to solve these problems such as ant colony optimization, memetic algorithm, genetic algorithm, particle swarm optimization (Hu and Eberhart, 2002), and nested partitions (Wu et al., 2011).
Multi-objective Methods without Trade-off The simplest approach, the lexicographic optimality, defines a first kind of trade-off: do not make any trade-off. It amounts to prefer any improvement of the most important criterion (objective), even a very small improvement, to any improvement of the sec-ond criterion, even a huge improvement. We have a strong hierarchical preference between criteria. In other words, the criteria are ordered lexicographi-cally: a solution s is better than s0 if and only if it is equivalent for criteria 1, . . . , i − 1, and is better for the i-th criterion. This approach has a great advan-tage, it does not need the values of the criteria to be compared. Indeed, the comparison of the values of different criteria is a difficult task that can be specific to a user and a problem. Another approach is simply to generate all the solutions which may be preferred. A solution may be preferred if and only if it is not dominated by another one. Such a non dominated so-lution is called a pareto-soso-lution. A soso-lution s is bet-ter than s0if and only if for each criterion, s is at least equivalent to s0, and there exists a criterion such as sis strictly better than s0. Intuitively, we cannot im-prove a criterion of a pareto-solution without a loss for another criterion. In practice, the set of pareto so-lutions is huge, and the usual approach is to compute an approximation of this set.
Multi-objective Methods with Trade-off
The comparison of the values of different criteria is needed in order to define a good trade-off. In general, this comparison is made thanks to a utility function associated to each criterion.
A utility function uz maps a value v of the criteria z to a number uz(v). A utility function uzshould satisfy an intuitive property: v1< v2⇒ uz(v1) < uz(v2). The aim of utility functions is to make possible the com-parison between different criteria. The utility func-tions of different criteria are strongly related, in such a way that the numbers coming from different crite-ria can be compared: let z1, z2be two criteria and v1, v2be the values of z1, z2in a given solution. We can know that, in this solution, the criterion z1 is more
favored than the criterion z2when uz1(v1) > uz2(v2).
Given the values u1, . . . , ukand u01, . . . , u 0
kof the utility functions for two solutions s and s0 , we want now to define when s is preferred to s0 , noted s >ms0. Many different preference orders >m, and many cor-responding multi-criteria methods exist. We will con-sider the following methods.
Weighted Sum. An extremely frequent approach is to maximize a weighted sum ∑ wi× ui where u1, . . . , uk are weights associated to each criterion. This approach seems to be quite intuitive and satis-factory. Nevertheless, despite its general use in many domains, this approach has some strong drawbacks. The function ∑ wi× uiis linear, and, when maximiz-ing this function for a concave set of solutions, many good solutions are not reachable. Furthermore, its sensitivity to the weights is very high.
Maximizing the Minimum. Another frequent ap-proach is to maximize the minimum value among the criteria. s >ms0 iff min ui > min u0i. This approach unfortunately produces many indistinguishable solu-tions, and some of them are not pareto solutions. Multi-objective Methods with Trade-off and Dynamic Ordering of the Criteria
The weighted sum method, as well as the method of maximizing the minimum have clear drawbacks. In-deed, these two methods can be greatly improved by integrating in them the following idea: order the cri-teria depending on the values they take in a solution. Then, aggregation of the criteria can be done depend-ing on the rank of the criteria. Let p1, . . . , pk be the sorted permutation of u1, . . . , ukin increasing order of values.
Ordered Weighted Average. Let w be a vector of weights such that wi≥ wi+1. The idea is to maximize ∑ wi× pi. We can see that if w1= w2= . . . = wk, we get the sum. If w1= 1, w2= w3= . . . = 0, we get the methods which maximize the minimum. This method has been introduced by (Yager, 1988).
Leximin/Leximax. A leximin solution is simply a lexicographic optimal solution on p1, . . . , pk. Lexim-in/leximax have nice properties, that make them in-tuitive for the user: a) they produce only pareto so-lutions; b) they are egalitarist (leximin solutions are always solutions for the method which maximizes the minimum); c) they verify the property of reducibility (if a criteria is set to a value it has in an optimal solu-tion, we get the same set of optimal solutions). This
method has been introduced in social choice com-munity and then used for multi-objective optimiza-tion (Ehrgott, 2000).
5
MATHEMATICAL
FORMULATION
Let’s now define a MILP formulation of the problem. Let P(i1, in) = [i1, . . . , ip, . . . , in] denote the unique path of the tree network
T
between i1and inif any.Location of the Pservers. Let xik denote the num-ber of pservers of type k ∈ K located at the facility i∈ N. Constraints (1) impose a maximal number Mik of pservers of type k located at facility i.
xik≤ Mik ∀i ∈ N, ∀k ∈ K (1)
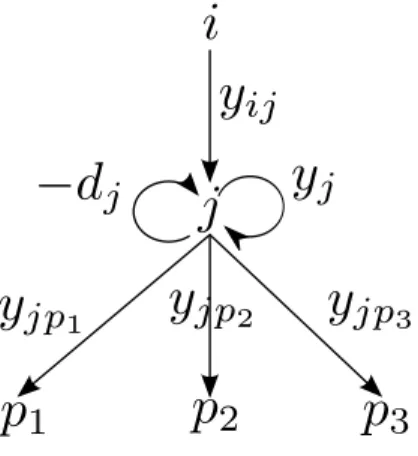
Traffic Flow. Let ysi denote the number of connec-tions provided to clients by pservers located at the fa-cility i ∈ N for the stage s ∈ S. Let ysi jdenote the num-ber of connections passing through the link (i, j) ∈ E for the stage s. Constraints (2) enforce that the num-ber of connections provided by the facility i stays below the cumulated capacity of its pservers. Con-straints (3) enforce the flow conservation of connec-tions at facility j, i.e. incoming (ys
i j) and provided (ys
j) connections satisfy the demand (dsj) while enough outgoing connections (ysj p) remain to serve its descen-dants.
∑
k∈K Ckxik≥ ysi ∀i ∈ N, ∀s ∈ S (2)∑
( j,p)∈E ysj p= ysi j+ ysj− ds j ∀(i, j) ∈ E, ∀s ∈ S (3) These constraints are illustrated in Figure 3 for a fa-cility j with three children p1, p2and p3(the stage is omitted).Figure 3: Traffic flow.
Client-server Model. Let zsi denote the number of local connections at the facility i for the stage s. Con-straints (4) enforce that the number of local connec-tions at the facility i is equal to the demand minus the number of incoming connections (from its ancestors). Let zsi jdenote the number of connections from facil-ities i to j for the stage s, i.e. passing through the transfer path P(i, j). Constraints (5) enforce that the number of connections passing through the link (i, j) is equal to the total number of connections of transfer paths taking this link.
zsi= dis−
∑
p∈A(i) zspi ∀i ∈ N, ∀s ∈ S (4) ysi j=∑
(i, j)∈P(u,v) zsuv ∀(i, j) ∈ E, ∀s ∈ S (5)Broadcast Model. Let bsi j denote the path band-width from facilities i to j for the stage s. Con-straints (6) enforce that the sum of path bandwidths consumed at the link (i, j) is lower than its capacity. Let Bmin and Bmax be respectively the minimum and maximum bandwidth allocated to a single connection from a pserver to a client. The central authority de-termines their values depending on the network archi-tecture (clients, pservers and links). Constraints (7) and (8) enforce that the bandwidth per connection be-tween facilities i and j belongs to a given range.
∑
(i, j)∈P(u,v)
bsuv≤ Bi j ∀(i, j) ∈ E, ∀s ∈ S (6)
bsi j≥ Bmin× zsi j ∀(i, j) ∈ E, ∀s ∈ S (7) bsi j≤ Bmax× zsi j ∀(i, j) ∈ E, ∀s ∈ S (8) Initial Broadcast. The last constraints handle the broadcast from the root pserver to other pservers, i.e. the stage s = 0. Constraint (9) enforces that the root pserver, which broadcasts packages to other pservers, is located at the central facility (i = 1). Con-straints (10) enforce that demand at a facility i for the stage 0 is equal to its number of pservers. Con-straints (11) enforce that the root pserver serves all other pservers. x11≥ 1 (9) di0=
∑
k∈K xik ∀i ∈ N (10) y0i = z0i j= b0i j= 0 ∀i ∈ N\{1}, ∀ j ∈ N (11)6
COMBINING MULTIPLE
OBJECTIVES
Sec-tion 4 offers much more possible criteria combina-tions than expected. We refer the reader to (Guttierez et al., 2011) for an explanation of how to handle mul-tiple criteria in an integer programming framework. Their approach is the basis of a flexible system of cri-teria combination which provides a useful mean to ad-dress some user’s needs. A key observation is that all these combinations can be viewed as a variation of the lexicographic algorithm.
We describe here a general approach for lexico-graphic optimization that can be implemented on top of any existing optimization solver. The underlying optimization solver is only required to be able to max-imize an objective function F subject to the set of constraints C. Let max(F,C) be the minimal value of F among all the feasible solutions of the constraint system C. This optimal value is computed by calling the underlying optimization solver. The lexicographic optimization problem amounts to maximize lexico-graphically n criteria F1. . . , Fnwhile satisfying a set of constraints C. A lexicographic optimization prob-lem P can be solved by solving a sequence of (sin-gle criterion) optimization problems {Pi}i∈[1,n] with an underlying optimization solver. Each problem Pi consists of maximizing Fi while satisfying the con-straints Ci where: a) C1 = C, b) ∀i ∈ [2, n], Ci = Ci−1∪ {Fi−1= max(Fi−1,Ci−1)} The solution of the optimization problem Pn is the solution of the lexi-cographic optimization problem P. The leximin/lexi-max optimization relies on a similar approach.
A Language for User Defined Combination. We provide a small dedicated language to let the user de-fine its own criteria combination. The key idea is to map, at least, virtually, any possible criteria combi-nation to an underlying lexicographic order. Indeed, mono-objective criteria combinations, like a simple aggregation, fits directly to a lexicographic algorithm reduced to one criteria and the leximin/leximax or-der implementation do rely on an unor-derlying lexico-graphic order implementation. Therefore, the basic criteria combination is the lexicographic one:
-lexicographic[<lccriteria>{,<lccriteria>}*] -lex[<lccriteria>{,<lccriteria>}*]
The next level of criteria combination gives access to the leximin/leximax order:
<lccriteria> ::=
{+,-}leximax[<ccriteria>{,<ccriteria>}*] {+,-}leximin[<ccriteria>{,<ccriteria>}*] <ccriteria>
As a consequence, one, two or more leximin/lex-imax orders can be lexicographically ordered, mean-ing that, for instance, the user does not want to
or-der the two first criteria, neither he wants to oror-der the third and fourth criteria, while he clearly wants the set of the two first criteria to be handled before the rest of the criteria. Note that the leading sign gives the opti-mization direction, i.e., a leading - for a miniopti-mization and a leading + for a maximization.
The final level of combiners gives access to the agregate and lexagregate combination:
<ccriteria> ::= {+,-}agregate[<ccriteria>{,<ccriteria>}*]{[ lambda]}? {+,-}lexagregate[<ccriteria>{,<cccriteria >}*]{[lambda]}? <criteria>
This recursive definition allows the user to de-fine agregate of agregate or lexagregate. The lex-agregate combiner uses only one objective function which could be solved using the lexicographic algo-rithm. An optional lambda value gives the opportu-nity to attach a weight to the agregate by means of a positive integer. All coefficients of the criteria will be multiplied by this weight. At last, the user can choose among the predefined criteria which one he wants to optimize: <criteria> ::= {+,-}pserv{[<property>,<value>]}*{[lambda]}? {+,-}local{[<property>,<value>]}*{[lambda]}? {+,-}conn{[<property>,<value>]}*{[lambda]}? {+,-}bandw{[<property>,<value>]}*{[lambda]}?
The language allows to specify a range property as a single integer value or an inter-val matching the following regular expression: <range>::=int(-|-int)?. So, the user can specify a subset of facilities Ncby using [level,<range>] which restricts to facilities located at given levels of the network and [reliable,<bool>] which restricts to facilities for which the path from the central facility are (non-)reliable. Similarly, the user can specify a subset of pserver types or stages by using [type,<range>] and [stage,<range>] respec-tively. Last, the user can restrict the length of transfer paths (number of arcs) by using [length,<range>] and select only (non-)reliable paths by using [reliable,<bool>]. If a property is not given, then the condition is satisfied.
Predefined Criteria
Several criteria are predefined. Let Nc⊆ N, Kc⊆ K, Sc⊆ S and Pc⊆ N2respectively be some subsets of the facilities, pserver types, stages and paths specified by the user.
The pserv criterion counts the number of pservers for a subset of facilities and for a subset of pserver
types:
∑
i∈Nck∈K
∑
cxik
The local criterion counts the number of local connections at a subset of the facilities for a subset of stages:
∑
i∈Ncs∈S
∑
czsi
The conn criterion counts the number of connec-tions for a subset of the transfer paths and for a subset of stages:
∑
(i, j)∈Pcs∈S
∑
czsi j
The bandw criterion sums the path bandwidths for a subset of the transfer paths and for a subset of stages:
∑
(i, j)∈Pcs∈S
∑
czsi j
Examples. The listing 1 gives aliases for crite-ria combinations used in Section 7. First, we de-fine a linear cost function cost_pserv associated to the number of deployed pservers of each type by using the agregate combiner. Another agregate combiner dist_pserv allows to sum the lengths of transfer paths as in facility location models. The sum_bandwcriterion estimates the total bandwidths allocated to the broadcast by distinguishing local and remote connections. The capa_pserv criterion com-putes the total capacity of the deployment whereas the bad_pservcriterion returns a vector with the number of non-reliable, new and “proxy” pservers.
7
EXPERIMENTAL RESULTS
This section presents computational experiments con-ducted to evaluate our approach. First, we describe a method for generating realistic instances on which the experiments have been done. Then, a use case shows that playing with criteria combination allows to ex-hibit different solutions which are then improved by incrementally refining the criteria combination. Last, the performance of our approach is evaluated depend-ing on the size of the instances as well as the criteria combination.An application provides a MILP platform to solve PSL problems. It translates a PSL problem and a set of criteria in one or more integer programs that are then solved by an underlying integer programming solver. It has been developed at UNS in C++ and is available at http://github.com/arnaud-m/opossum un-der a modified BSD license. It actually offers in-terfaces to two integer programming solvers: IBM
Ilog CPLEX (IBM, 2012), GLPK (GLPK, 2012). All the experiments were conducted on a Linux machine, with 32GB of RAM and 6 processors (3.2GHz) with CPLEX 12.3.0 (mono-thread).
Generating Realistic Instances
Mandriva’s team have provided useful information to generate realistic instances. First, the tree networks have about four levels. In complex scenario, the av-erage numbers of facilities and clients are equal to 1000 and 100000 respectively. The characteristics of a facility are defined by its type (about ten types) which is associated to a level of the network. We consider two groups of clients, i.e. the problem has three stages. We assume that the bandwidth of links is one of the following: 2MB (low-end DSL), 20MB (high-end DSL), 100MB end LAN), 1GB (low-end LAN).
There are five types of servers which provide dif-ferent number of connections.The best alternative is to install package servers on existing Unix servers of the network, but we can buy and install new Unix servers (C1= C2= 500). The pservers can also be in-stalled on Unix (C3= 300) and Windows (C4= 100) clients, but they provide less connections and are more expensive. As a last resort, it is possible to acti-vate the “proxy mode” of any client (C5= 20) which is thereby temporary transformed, at great expense, into a pserver with limited capacity.
There are twelve types of facility characterized by their demands and server capacities as well as some probabilities used for the network generation. The generation of the tree network relies on a breadth-first algorithm. For a given node, its children are generated as follows. First, the number of facilities is drawn ran-domly for each type of the next level using a binomial distribution B(n, p). Second, the bandwidth and reli-ability of the links between the node and its children are drawn randomly using uniform distributions. Ad-ditionally, we can enforce that the structure of the net-work is strictly hierarchical: a link has a lower band-width and is less reliable than its predecessors. In this case, the bandwidth probabilities are normalized ac-cording to the bandwidth of its predecessor in order to fulfill the hierarchical condition.
Use Case
We discuss a realistic use case based on a synthetic instance for which we apply two scenarios. The net-work is composed of 769 facilities and 24320 clients. There is a total of eight available Unix servers and it is possible to buy at most one new Unix servers at each facility of levels 0 and 1 (a total of 16 new
cost_pserv="-agregate[-pserv[type,0][10],-pserv[type,1][18],-pserv[type,2][6],-pserv[type,3][4],-pserv[type,4][1]]" dist_pserv="-agregate[-conn[length,1][1],-conn[length,2][2],-conn[length,3][3]]"
sum_bandw="+agregate[-local[stage,1-][5000],-bandw[stage,1-]]"
capa_pserv="+agregate[-pserv[type,0-1][500],-pserv[type,2][300],-pserv[type,3][100],-pserv[type,4][20]]" bad_pserv="-pserv[reliable,0],-pserv[type,1],-pserv[type,4]"
Listing 1: Aliases of several criteria combinations.
Unix servers). In the first scenario, we aim to min-imize the number of deployments while maximizing the reliability but also taking into account preferences between pserver types. In this scenario, the broadcast model only checks the feasibility constraints, i.e. the minimal bandwidth allocated to a single client. In the second scenario, we aim to minimize a cost function associated to the deployment while maximizing the broadcast performance.
The user must deploy at least 30 pservers spread over 16 facilities (-lex[-pserv]). The solution vec-tor (8, 14, 8, 0, 0) is composed of 8 Unix servers, 14 new Unix servers, 8 Unix clients, 0 Windows clients, and 0 proxy clients. The spare capacity of a deploy-ment is defined as the minimal spare capacity among groups. So, the user determines the maximal spare ca-pacity equal to 6.2% (-lex[-pserv,capa_pserv]) whereas it was only equal to 3.2% in the previous so-lution. Now, the user want to increase the reliability of the deployment modeled by the bad_pserv crite-ria. The user first determines an egalitarist solution (-lex[-pserv,-leximax[bad_pserv]]) in which the number of reliable pservers is improved from 22 to 24 and the number of new Unix servers is re-duced from 14 to 12. The solution vector is now (8, 12, 10, 0, 0), but the deployment has a low spare capacity of 0.5%. Then, the user determines an alternative solution (-lex[-pserv,bad_pserv]) in which it is preferred to increase the number of reli-able pservers (from 22 to 25) rather than reducing the number of new Unix servers (from 14 to 13). This last solution (8, 13, 9, 0, 0) is preferred to the previous one because of its better spare capacity (2%). In all previous solutions, pservers are spread over facilities of the levels 1 and 2.
The user must deploy 41 pservers spread over 20 facilities for a total cost of 284 (lex[cost_pserv]). The solution (7, 2, 28, 2, 2) uses all types of pservers and has a low spare capacity (1.5%). From now on, pservers are spread over facilities of the levels 1 to 3. Note that the two best solutions of the first scenario have a cost of 356 and 368 respec-tively. Then, the user determines that improving the reliability (lex[cost_pserv,bad_pserv] or lex[cost_pserv,-leximax[bad_pserv]]) only results in increasing the number of re-liable pservers from 27 to 31 while leaving
the solution vector unchanged. Finally, the user prefers to improve the broadcast per-formance (lex[cost_pserv,sum_bandw] or lex[cost_pserv,dist_pserv]) which changes the solution vector to (6, 2, 29, 3, 2). The 42 pservers are spread over more facilities (21) and more levels (1-3) than in the first scenario, but has less spare capacity (0.8%)
Note that solving times significantly depend on criteria combinations. Indeed, solving times of the first scenario remain lower than 5 seconds whereas those of the second scenario increases until 5 minutes (from the second to the fourth criteria combinations). Intuitively, subproblems with a minimal number of pservers are easier to solve than those with a minimal cost because there are less feasible deployments.
This use case has showed that our approach can provide a flexible and efficient decision support tool for the deployment of package servers in a tree net-work. In the next section, we will evaluate the perfor-mance and benefits of our approach in a systematic way.
Performance Evaluation
Our approach has been tested on 40 synthetic in-stances. The number of facilities ranges from 300 to 1700 with the average around 1000. The total demand (2 groups) ranges from 10000 to 50000. The average number of existing and new Unix servers is 33.
We discuss here the impact of the criteria combi-nation on the solving time of the problem. We com-pare families of combinations which concern simi-lar aspects of the deployment. Then, we study the influence of the criteria ordering before a compari-son of the primary criterion (see below). Let recall that the listing 1 page 10 gives aliases for several criteria combinations. The basic criteria combina-tion is -lex[(criteria,lccriteria]. The primary criteria is either -pserv or cost_pserv in order to restrict the number of pservers. The Secondary lccriteriaare presented gradually and concern the efficiency and the reliability. For each of 24 criteria combinations, instances were tested with a time limit set to 1000 seconds per subproblems. The number of subproblems depends only of the criteria combina-tion. 835 of 960 problems were optimally solved. The graphics of Figure 4 show percentages of instances
0 20 40 60 80 100 1 10 100 1000 % Optim u m Time (s) dist_pserv sum_bandw
(a) Distance versus bandwidth
0 20 40 60 80 100 1 10 100 1000 % Optim u m Time (s) lexicographic leximax
(b) Lexicographic versus leximax
0 20 40 60 80 100 1 10 100 1000 % Optim u m Time (s) rel_perf perf_rel
(c) Reliability versus performance
0 20 40 60 80 100 1 10 100 1000 % Optim u m Time (s) pserv cost_pserv
(d) Size versus cost Figure 4: Experimental results for criteria combinations.
solved optimally as a function of the time in seconds for groups of criteria combinations.
Distance versus Bandwidth. We compare bi-criteria combinations related to the efficiency of the broadcast. Figure 4(a) compares the resolution of problems where lccriteria is either sum_bandw or dist_pservwith both primary criteria. More than 80% of the dist_pserv problems are solved within 10 seconds whereas only about 30% of sum_bandw problems. The solver takes advantage of additional time for solving up to 80% of the sum_bandw prob-lems within 1000 seconds whereas the resolution of the dist_pserv problems has reached a floor around 20 seconds. So, the dist_pserv criterion can be used for discovering quickly good solution before using the sum_bandwcriterion for solution refinement.
Lexicographic versus Leximax. We compare 4-criteria combinations related to the reliability of the broadcast. Figure 4(b) compares the resolution of problems where lccriteria is either bad_pserv or -leximax[bad_pserv]with both primary criteria. It is worthwhile to use leximax to smooth the values
of the criteria. More than 80% of the problems are solved within 10 seconds for both criteria and the re-sults are similar.
Reliability versus Performance. Now, we evalu-ate the impact on the solving time of the relative ordering between the efficiency and reliability crite-ria. Figure 4(c) compares the resolution of problems where, for instance, lccriteria is on the one hand bad_pserv,sum_bandw (rel_perf) and on the other hand sum_bandw,bad_pserv (perf_rel). The results indicate that is preferable to improve the reliability of the deployment, and then its efficiency.
Size versus Cost. Last, Figure 4(d) compares the resolution of problems depending on the primary cri-terion for all secondary criteria described above. The results confirm the intuition that pserv subproblems where the number of pservers is fixed are more con-strained (and easier) than cost_pserv subproblems where only the installation cost is fixed. Though, cost_pserv problems allow to discover more vari-ous solutions by playing with criteria combinations.
8
CONCLUSIONS
We have introduced a new multi-objective optimiza-tion problem derived from a real-world applicaoptimiza-tion: the package server location problem. We have pro-posed a first mathematical formulation of this multi-objective optimization problem as well as a method for the generation of realistic instances. In addition, a small dedicated language allows virtually to define any possible criteria combination.
Results for exact multi-objective solution ap-proaches based on mixed integer linear programming have been reported. First, a realistic use case has shown the efficiency and flexibility of our approach for quick prototyping of deployments with various structural properties. Second, solving times are really satisfactory for realistic problem’s sizes. Last, some criteria combinations are “easier” to solve than others to obtain solutions with similar characteristics.
In further work, we will compare different linear programming solvers, and investigate approximations of the pareto set.
ACKNOWLEDGEMENTS
The authors would like to thank Claude Michel, Mo-hamed Rezgui (UNS CNRS), and Yvan Manon (Man-driva). This work was supported by the Agence Na-tionale de la Recherche (Aeolus project – ANR-2010-SEGI-013-01). To end, we would like to thank the anonymous referees for their remarks.
REFERENCES
Aboolian, R., Berman, O., and Drezner, Z. (2009). The mul-tiple server center location problem. Annals of Oper-ations Reseach, 167:337–352.
Alves, M. J. and Clímaco, J. (2007). A review of interactive methods for multiobjective integer and mixed-integer programming. European Journal of Operational Re-search, 180(1):99 – 115.
Beamon, B. M. (1998). Supply chain design and analysis:: Models and methods. International Journal of Pro-duction Economics, 55(3):281 – 294.
Berman, O. and Drezner, Z. (2007). The multiple server location problem. The Journal of the Operational Re-search Society, 58(1):91–99.
Berman, O. and Krass, D. (2002). Recent Developments in the Theory and Applications of Location Models: A Preview. Annals of Operations Reseach, 111:15–16. Dantzig, G. B. (1960). On the significance of solving linear
programming problems with some integer variables. Econometrica, 28:30–44.
Ehrgott, M. (2000). Multicriteria optimization. Springer-Verlag.
Ferris, M., Meyer, R., and D’Souza, W. (2006). Radia-tion Treatment Planning: Mixed Integer Programming Formulations and Approaches. In Appa, G., Pitsoulis, L., and Williams, H., editors, Handbook on Modelling for Discrete Optimization, volume 88 of International Series in Operations Research & Management Sci-ence, pages 317–340. Springer US.
GLPK (2012). GNU Linear Programming Kit. http:// www.gnu.org/software/glpk.
Guignard-Spielberg, M. and Spielberg, K., editors (2005). Integer Programming: State of the Art and Recent Advances-Part I, volume 139. Annals of Operations Reseach.
Gurobi Optimization (2012). The Gurobi Optimizer. http: //www.gurobi.com.
Guttierez, G., Janota, M., Lynce, I., Lhomme, O., Man-quinho, V., Marques-Silva, J., and Michel, C. (2011). Final version of the optimizations algorithms and tools. Technical report, Project Mancoosi: Managing the Complexity of the Open Source Infrastructure. Hu, X. and Eberhart, R. (2002). Multiobjective
Optimiza-tion Using Dynamic Neighborhood Particle Swarm Optimization. In Congress on Evolutionary Compu-tation (CEC’2002), volume 2, pages 1677–1681, Pis-cataway, New Jersey. IEEE Service Center.
IBM (2012). IBM Ilog Cplex Optimizer. http: //www-01.ibm.com/software/integration/ optimization/cplex-optimizer/.
Iyoob, I., Zarifoglu, E., and Dieker, A. B. (2012). Cloud computing operations research. Service Science, Ac-cepted.
Johnson, D. S., Lenstra, J. K., and Kan, A. H. G. R. (1978). The Complexity of the Network Design Problem. Net-works, 8:279–285.
Sawaragi, Y., Nakayama, H., and Tanino, T. (1985). The-ory of Multiobjective Optimization. Mathematics in Science and Engineering. Academic Press.
Sherali, H. D., Bae, K.-H., and Haouari, M. (2010). In-tegrated Airline Schedule Design and Fleet Assign-ment: Polyhedral Analysis and Benders’ Decompo-sition Approach. INFORMS Journal on Computing, 22(4):500.
Steuer, R. E. (1986). Multiple Criteria Optimization: The-ory, Computation and Application. John Wiley, New York.
Wu, T. and Shi, L. (2011). Mathematical models for capac-itated multi-level production planning problems with linked lot sizes. International Journal of Production Research, 49(20):6227–6247.
Wu, T., Shi, L., Geunes, J., and Akartunali, K. (2011). An optimization framework for solving capacitated multi-level lot-sizing problems with backlogging. European Journal of Operational Research, 214(2):428 – 441. Yager, R. R. (1988). On ordered weighted averaging
aggre-gation operators in multicriteria decision making. Sys-tems, Man and Cybernetics, IEEE Transactions on, 18:183–190.