HAL Id: tel-00423342
https://tel.archives-ouvertes.fr/tel-00423342
Submitted on 9 Oct 2009
HAL is a multi-disciplinary open access archive for the deposit and dissemination of sci-entific research documents, whether they are pub-lished or not. The documents may come from teaching and research institutions in France or abroad, or from public or private research centers.
L’archive ouverte pluridisciplinaire HAL, est destinée au dépôt et à la diffusion de documents scientifiques de niveau recherche, publiés ou non, émanant des établissements d’enseignement et de recherche français ou étrangers, des laboratoires publics ou privés.
péri-granitiques :Modélisation numérique couplée
2D/3D, Applications au District minier de Tighza
(Maroc-Central).
Khalifa Eldursi
To cite this version:
Khalifa Eldursi. Minéralisations et Circulations péri-granitiques :Modélisation numérique couplée 2D/3D, Applications au District minier de Tighza (Maroc-Central).. Minéralogie. Université d’Orléans, 2009. Français. �tel-00423342�
Central). (Eldursi, 2009)
ÉCOLE DOCTORALE SCIENCES ET TECHNOLOGIES
LABORATOIRE ISTO
THÈSE
présentée par :Khalifa ELDURSI
Soutenue le : 29 mai 2009
pour obtenir le grade de :
Docteur de l’université d’Orléans
Discipline/ Spécialité
: Sciences de la Terre et de l’Atmosphère
THÈSE dirigée par :
Mr. Eric MARCOUX Professeur, ISTO Université d’Orléans Mr. Laurent GUILLOU-FROTTIER Ingenieur-Chercheur, (HDR) BRGM-Orléans
RAPPORTEURS :
Mr. Jean-Jacques ROYER Ingenieur-Chercheur, ensg-inpl-Nancy Mr. Michel JEBRAK Professeur, Université du Québec-Montréal
JURY:
Mr. Bruno SCAILLET Directeur de recherche, CNRS-ISTO-Orléans (Président du jury)-Examinateur
Mr. Michel JEBRAK Professeur, Université du Québec-Montréal Mr. Jean-Jacques ROYER Ingenieur-Chercheur, ensg-inpl-Nancy Mr. Alain BONNEVILLE Professeur, IPGP-Paris-Examinateur
Mr. Fabrice FONTAINE Chargé de recherche, CNRS-IPGP-Paris-Examinateur Mr. Eric MARCOUX Professeur, ISTO Université d’Orléans
Mr. Laurent GUILLOU-FROTTIER Ingenieur-Chercheur, BRGM-Orléans
Mr. Yannick BRANQUET Maître de conférences, ISTO Université d’Orléans
UNIVERSITÉ
D’ORLÉANS
Minéralisations et Circulations péri-granitiques :
Modélisation numérique couplée 2D/3D,
Applications au District minier de Tighza
(Maroc-Central).
Peri-granitic circulations and mineralization: 2D/3D
Coupled Numerical Modeling, applications in the Mining
Chapter I : General Introduction: ... (10)
Résumé français 1. Introduction: ... (10)
1.1 L'origine des fluides hydrothermaux: ... (10)
1.2 Le système de fractures: ... (11)
1.3 L’âge des gisements et d'intrusion parent: ... (11)
1.4 La géométrie du pluton: ... (11)
2 L’application numérique dans les domaines géologiques: ... (12)
1. General Introduction: ... (13)
1.1 The Origin of hydrothermal fluids related ore deposits: ... (16)
1.1.1 The first hypothesis (magmatic origin): ... (16)
1.1.2 The second hypothesis (meteoric origin): ... (17)
1.1.3 The third hypothesis (meteoric and magmatic origin): ... (20)
1.2 Hydraulic fracturing: ... (21)
1.3 Age dating of ore deposits: ... (22)
1.4 Intrusion geometry: ... (23)
2. Classification of ore deposits: ... (24)
3. Peri-granitic Mineralization (ore related to igneous activity): ... (26)
4. Numerical modeling: ... (28)
5. Numerical application in geological fields: ... (29)
6. Aims of this research: ... (30)
Chapter II: Numerical modeling and physical properties of magma: ... (33)
Résumé français 1. Paramètres physiques : ... (33) 1.1 Conductivité thermique: ... (33) 1.2 La Capacité calorifique: ... (33) 1.3 Densité: ... (34) 1.4 Viscosité: ... (34)
1.5 La perméabilité et La pression du fluide: ... (34)
2. La construction de modèle: ... (35)
1. The Code: ... (37)
2. Parameters and free convection mode: ... (37)
2.1 Physical Parameters: ... (38)
2.1.1 Thermal Conductivity (λ): ... (38)
2.1.1.1 The influence of porosity and the dominant mineral phase: ... (38)
2.1.1.2 The influence of surround temperature: ... (39)
2.1.2 Specific Heat Capacity (cP): ... (41)
2.1.3 Density: ... (42)
2.1.4 Viscosity: ... (45)
2.1.5 Permeability and fluid pressure: ... (46)
2.2 Free convection theory: ... (48)
2.2.1 Rayleigh Number: ... (49)
2.2.3 Heat Transfer: ... (51) 2.2.3.1 Conduction: ... (51) 2.2.3.2 Convection: ... (51) 2.2.3.3 Advection: ... (52) 2.2.3.4 Radiation: ... (52) 2.2.3.5 Production: ... (52)
2.3 Free convection in numerical view: ... (52)
2.3.1 Heat Transfer: ... (52) 2.3.2 Fluid Flow: ... (53) 2.3.2.1 Navier-Stokes equation: ... (53) 2.3.2.2 Richard’s equation: ... (53) 2.3.2.3 Brinkman equation: ... (53) 2.3.2.4 Darcy’s Low: ... (53) 3. Model Setup: ... (54) 3.1 Model Construction: ... (54) 3.1.1 Numerical Simplification: ... (54)
3.1.2 Parameters and numerical procedures: ... (55)
3.1.3 Models Classification: ... (56)
3.1.3.1 The first part (Theoritical and natural cases): ... (58)
3.1.3.2 The second part (Tigzha example): ... (59)
3.2 Validation and applications: ... (59)
3.2.1 The first validation test (Rabinowicz Model): ... (59)
3.2.2 The second validation test (Gerdes Model): ... (60)
Chapter III: Numerical investigation of transient hydrothermal processes around intrusions: heat transfer and fluid circulations leading to mineralization patterns. ... (63)
Résumé français Résumé: ... (64)
Abstract ... (66)
1. Introduction: ... (67)
2. Intrusion-related ore deposits: tested natural examples: ... (71)
3. Hydro-thermal modeling: governing equations and parameters: ... (72)
4. Defining a Restricted Rock Alteration Index: ... (73)
5. Model construction: geometry, timing, boundary conditions and rock properties: ... (74)
5.1 Geometry: ... (74)
5.2 Timing: ... (76)
5.3 Boundary conditions and rock properties: ... (76)
6. Fluid flow pattern: results and discussion: ... (76)
6.1 Benchmark: ... (76)
6.2 Spatial-temporal evolution of the fluid flow pattern and heat transfer: ... (77)
6.3 Influence of emplacement depth: ... (81)
6.4 Effects of apexes: ... (82)
7. Probable mineralization patterns: ... (84)
7.1 Potential mineralization zones for theoretical models: ... (85)
7.2 Effects of permeable fractured aureoles: ... (86)
7.3 Effects of apexes: ... (87)
7.4 Effects of faults: ... (88)
7.6 Model time evolution vs. age of mineralization and genetic link: ... (89)
8. Concluding remarks: ... (91)
9. References: ... (92)
10. Supplementary results: ... (98)
Chapter IV: The W-Au granite related mineralization of Tighza (Jbel Aouam, Morocco) 3D modeling of pluton shape and hydrothermal fluid flow: ... (102)
Résumé français 1. Introduction: ... (104)
2. The Geology and metallogeny of Tighza area: ... (104)
2.1 Location and morphology: ... (104)
2.2 Geology of Tighza: ... (105) 2.2.1 Ordovician: ... (105) 2.2.2 Silurian: ... (107) 2.2.3 Devonian: ... (107) 2.2.4 Carboniferous: ... (108) 2.3 Magma activity: ... (108) 2.4 Aureole of metamorphism: ... (110) 2.5 Tectonic history: ... (111)
2.6 Tighza District (Pb/Ag, Sb and Au-W veins): ... (112)
2.7 Vein W1: ... (112)
3. Gravity anomalies of Tighza pluton, processing, interpretation and 3D modelling: ... (113)
3.1 Processing of Gravity Data: ... (115)
3.1.1 The theoretical value: ... (115)
3.1.2 How to modify the theoretical value: ... (116)
3.1.2.1 Free air correction: ... (116)
3.1.2.2 Bouguer correction (simple Bouguer): ... (116)
3.1.2.3 Terrain Correction: ... (117)
3.2 Interpretation: ... (117)
3.2.1 Gravity Data: ... (117)
3.2.2 3D modeling of granite shape: ... (125)
3.3 Model construction: ... (127)
3.4 Numerical modeling of hydrothermal fluid flow and thermo-chronological constraints around Tighza pluton: ... (128)
3.4.1 Model setup: ... (128)
3.4.2 Results: ... (131)
3.5 Discussion and conclusion: ... (133)
3.5.1 Time-Lag: ... (133)
3.5.2 Difinition of closure Temperature: ... (136)
Chapter V: General Conclusion: ... (142)
Résumé français 1. Modélisation numérique couplée hydro-thermale et probabilité de minéralisation : nouveaux apports: ... (142)
2. Le rôle de la profondeur d’emplacement du pluton: ... (143)
3. Les effets de la géométrie du pluton et des apex: ... (143)
4. Le rôle des zones de haute perméabilité : les auréoles fracturées et les failles: . (143) 5. La thermo-chronologie et le lien génétique de l’intrusif dans le processus de minéralisation: ... (144)
6. Un cas naturel spécifique : le système W-Au associé
au granite de Tighza (Maroc central): ... (144)
1. Hydro-thermal numerical modeling and ore deposition probability (new insights): ... (147)
2. The role of emplacement depth of pluton: ... (148)
3. Effects of pluton geometry and apexes: ... (149)
4. The role of high permeability zones: fractured thermal aureoles and faults: ... (149)
5. Time evolution and the genetic link of intrusion in the ore deposition: ... (150)
6. The natural case: granite-related W-Au deposits (Tighza-Morocco): ... (150)
7. Future Work: ... (151)
Chapter VI: References: ... (152)
Chapter VII: Appendix: ... (173)
1. Numerical construction of M4 as an example to explain the numerical procedures followed in this research: ... (173)
1.1 Geometry: ... (173)
1.2 The Meshing: ... (174)
1.3 Boundary and initial conditions: ... (176)
Figure I.1 Some features of a geothermal system. ... (19)
Figure I.2 Formation of Carlin-type deposits. ... (20)
Figure I.3 Diagram of a shear zone where metamorphic water from a large volume of rock is rising to higher levels. ... (22)
Figure I.4 Schemas for the formation of two types of epithermal precious metal deposits in volcanic terranes. ... (24)
Figure I.5 Porphyry orebody morphologies. ... (25)
Figure I.6 Generalized geological section through the Climax mine, Colorado. ... (25)
Figure I.7 Some examples of ore deposits associated to intrusions of gold deposits. ... (27)
Figure I.8 The different mineralization styles spatially associated to intrusions. ... (28)
Figure II.1 Thermal conductivities for different types of rocks, a) for magmatic and metamorphic rocks, b) for sedimentary rocks, c) for water. ... (40)
Figure II.2 Specific heat capacity varies with temperature for a) magmatic, metamorphic, sedimentary rock, b) and water. ... (42)
Figure II.3 The idea of thermal convection in a fluid layer heated from within and cooled from above. ... (43)
Figure II.4 Densities of common rock-forming minerals and rocks at atmospheric P and T and melts at 1 atm. ... (44)
Figure II.5 Newtonian viscosities of some crystal and melts as a function of T at 1 atm. ... (46)
Figure II.6 Permeability related depth curve based on geothermal data. ... (48)
Figure II.7 Hypothetical fluid pressure profiles. ... (49)
Figure II.8 Critical Rayleigh Number for the onset of convection in a layer heated from below. ... (50)
Figure II. 9 Schmatic diagram of hydrothermal numerical coupling ... (57)
Figure II.10 Boundaries and initial conditions of our numerical modeling ... (58)
Figure II 11 Rabinowicz model. ... (60)
Figure II 12 An identical model of Gerdes et al (1998). ... (61)
Figure III.1 Compilation of the geometries, emplacement depth (ED) and geological context for different tested studies. ... (69)
Figure III.2 Simplified forms and boundary conditions for different models. ... (75)
Figure III.3 Benchmark test of our coupled hydro-thermal modeling. ... (78)
Figure III.4 Snapshots of different time steps of M1 ... (79)
Figure III.5 Snapshots of different time steps of M2 ... (80)
Figure III.6 Horizontal component of fluid velocity along horizontal cross section ... (80)
Figure III.7 Hydrodynamics and illustration of local Peclet number ... (81)
Figure III.8 Snapshots of different time steps of M4 ... (83)
Figure III.9 Snapshots of different time steps of M5 ... (83)
Figure III.10 Snapshots to study the effects of an apex ... (84)
Figure III.11 Snapshots show the effects of an apex ... (84)
Figure III.12 R²AI application around each pluton ... (85)
Figure III.13 Focused snapshots during the warming and the cooling phases ... (87-88) Figure III.14 Simplified numerical models of Grasberg porphyry ... (90)
Figure III.15 Four different shapes of pluton emplaced at the same depth ... (99)
Figure III.16 Temperature and fluid velocity curves at constant depth ... (100)
Figure IV.1 The main geological features of Morocco. ... (105)
Figure IV.2 The main geological features of Tighza district. ... (106)
Figure IV.3 (a) W1 extends about 1200m WE, (b) stockworks in Mine granite and (c) the Greisen. ... (114)
Figure IV.4 Processing procedures to extract the real geometry of Tighza pluton ... (118)
Figure IV.5 Gravity data of the study area. ... (120)
Figure IV.6 Extracting DEM from STRM ... (121)
Figure IV.7 The form of Tighza pluton in 2D ... (124)
Figure IV.8 N-S (a) and NE-SW (b) cross sections show the most probable model based on gravity inversion. ... (129)
Figure IV.9 Map view of the most probable form of Tighza pluton. ... (130)
Figure IV.10 Model setup of Tighza example; a) the simplification of Tighza pluton in 3D, b) thermal gradient of the whole area as a result of 20Myr of computational time. c) Slice snapshot of the hottest phase. ... (132)
Figure IV.11 The history of RA2I during emplacement and cooling phases. ... (134)
Figure IV.12 Correlation between numerical map of probable mineralization patterns and the recent field observations. ... (135)
Figure IV.13 Different theoretical forms of age perturbations. ... (137)
Figure IV.14 A correlation between biotite-muscovite closure temperatures and the probable zone of mineralization (RA2I). ... (139)
Figure A.1 Application of Peclet number in M4 ... (173)
Figure A.2 Two rectangles simulate the country rock and the intruded body ... (174)
Table II.1 Radiogenic heating per mass of some rock types. ... (52)
Table III.1 Units and symbols of parameters and variables used in this study ... (97)
Table IV.1 Different results of Cheillez (1984) and Nerci (2006) based on K/Ar and Ar/Ar respectively. ... (110)
Table IV.3 Measured densities of granite and host rocks. ... (126)
Table A.1 The mathematical expressions used for different parameters ... (174)
Table A.2 The boundary and initial conditions of heat transfer and fluid flow ... (176)
Table A.3 Mesh Statistics of M4 ... (177)
Acknowledgement
Remerciements
I am deeply indebted to my supervisors Mr. MARCOUX Eric, GUILLOU-FROTTIER Laurent and BRANQUET Yannick for their constructive remarks, availability, assistance and looked closely at the final version of the thesis for English style and grammar, correcting both and offering suggestions for improvement. I also extend my gratitude to the jury’s members for their acceptance to judge and evaluate this work.
I would like to express my gratitude to all those who gave me the possibility to complete this thesis (Mr MARTELET Guillaume, CALCAGNO Phillipe, GLOAGUEN Eric, GUMIAUX Charles, VIDAL Max and BURGISSER Alain.
I expand my sincerest gratitude to my family in Libya for their stimulating support, and to my host family (Auberger’s family) in Vichy for their hospitality, friendship and assistance during my stay in France. I am grateful to my colleagues in ISTE and ISTO whose offer me helps, stimulating suggestions, support, interesting and valuable hints and encouragement to go ahead all the time of research and writing.
Chapter (I) General Introduction
Résumé français du chapitre (I)
1. Introduction Générale
L'objectif de cette thèse consiste à étudier les systèmes hydrothermaux en tant que processus créé par la mise en place de magma et responsables de la genèse de gisements de minerai. Ce travail adopte une approche qui est basée sur la modélisation numérique pour caractériser le transfert de chaleur et l'écoulement des fluides hydrothermaux dans la croûte. Nous présentons ci-dessous les quatre problèmes principaux liés à cette recherche, ces problèmes seront traités ou au moins abordés par notre approche numérique. Les sections suivantes sont destinées à présenter quelques principes sur la connaissance de la minéralisation, la modélisation numérique et on finit en récapitulant nos objectifs de cette recherche.
1.1 L'origine des fluides hydrothermaux
Depuis le siècle dernier, il a été confirmé que les fluides hydrothermaux étaient responsables de beaucoup de gisements de minerai, mais l'origine de ces fluides reste toujours discutée. Plusieurs hypothèses ont été proposées: 1) l’origine météorique : il a été suggéré que l'eau météorique puisse jouer un rôle significatif dans la composition des fluides hydrothermaux responsables de la formation de minéralisations liées à l’intrusion. Grace à la mise en place de magma, le gradient thermique installe une circulation convective de l'eau dans l’encaissant, et peut être responsable de la formation de minéralisations (Taylor, 1981). En plus, la taille et la forme de quelques dépôts suggèrent que les solutions hydrothermales lessivent un volume très grand de la roche, y compris des roches encaissantes; ainsi la taille de pluton parent reflète que le volume énorme de fluide vient de l’encaissant plutôt que du corps magmatique, ce qui fait que l'origine météorique des fluides est une hypothèse plus réaliste. 2) l’origine magmatique : grâce au rapport spatial qui existe entre beaucoup de dépôts hydrothermaux et de roches magmatiques, une école pense que le magma consolidé est la source de beaucoup (si ce n’est pas tout) de solutions hydrothermales (Khitarov et al. 1982 ; Manning, 1984 ; Strong, 1981). Cameron et Hattori (1987) ont produit des évidences pour la présence des fluides oxydés pendant la formation d'un certain nombre de dépôts canadiens et australiens d’or; ils ont contesté l'hypothèse orthodoxe qui dit que l'origine des fluides peut seulement être magmatique. 3) l’origine mélange (origine météorique-magmatique) : Un des mécanismes hypothétiques célèbres est le mélange entre deux types d'eau, (magmatique et météorique).
Des évidences actuelles prouvent que les mêmes dépôts peuvent être formés par des différents types d'eau. Au moins des eaux de deux origines ont pu avoir joué un rôle important dans la formation de quelques minéralisations.
Notre première question consiste à tester numériquement l'hypothèse de l'origine météorique des fluides hydrothermaux pour former des gisements de minerai. Notre question principale est : l’origine météorique des fluides est-elle suffisante pour former des gisements de minerai? 1.2 Le système de fractures
Il a été suggéré que tous les processus hydrothermaux exigent des perméabilités suffisantes dans l’encaissant qui permettent aux fluides de s'écouler de leur source jusqu’à la place du dépôt minéral. Cette perméabilité a été réalisée par des roches se fracturant sur des échelles microscopiques à des échelles de grandes failles. Ces systèmes sont censés avoir une capacité de faire circuler une grande diversité de composants comprenant les matériaux minéralisateurs (Yardley, 1983 ; Fischer and Paterson, 1985).
La deuxième question vient du rôle des failles ou des systèmes de fracturation où la perméabilité est relativement élevée par rapport à la zone encaissante. Quel est le rôle des failles et/ou des systèmes de fractures? Jouent-ils un rôle de valve pour transporter des constituants de minerai loin de zone chaude (autour du corps magmatique), ou bien jouent-ils également un rôle de piège structural pour les gisements?
1.3 L’âge des gisements et de l’intrusion parent
Brimhall (1979) a démontré qu'il y a deux étapes de minéralisation : pré-principal et principal. La minéralisation pré-principale, composée par de grandes tailles de minéralisations disséminées de cuivre-molybdène du type porphyre, formée entre 600-700°C, pourrait se mettre en place par un système intrusif plus jeune. Pendant l'étape principale plus tardive, un système géothermique impliquant les fluides hydrothermaux à des températures entre 200-350°C, redépose une grande partie du cuivre disséminé pour former des veines riches en minéraux. Si nous avons un lien génétique entre une minéralisation et un corps magmatique, pourquoi avons-nous un décalage d'âge entre la minéralisation et le pluton parent ? Dans certains cas la minéralisation serait plus ancienne que le pluton parent? D'ailleurs, pouvons-nous prendre ce phénomène comme un argument pour montrer qu'il n'y a aucun lien génétique entre le pluton et la minéralisation? Et s'il y a plus d'un cycle de minéralisation, combien de cycles pourraient être liés à un corps magmatique, et eux dépendant de quels facteurs ?
1.4 La géométrie du pluton
A partir de différentes études (par exemple White, 1981, et Wallace, 1991), il a été proposé trois morphologies générales de minéralisations dépendant de la morphologie ou de la forme
de l'intrusion. Dans d'autres cas (ex: gisement d'Henderson) la géométrie compliquée de l'intrusion reflète des effets très compliqués sur la morphologie des gisements de minerai. Par conséquent, la question principale concerne le rôle de la géométrie du pluton pour piéger ou localiser des gisements de minerai ?
2. L’application numérique dans les domaines géologiques
Les observations sur le terrain peuvent souvent être insuffisantes pour mesurer l'évolution temporelle des systèmes hydrothermaux. Par conséquent, le développement récent dans le domaine informatique s'est traduit par un progrès dans la modélisation numérique. Les convections hydrothermales liées à des intrusions magmatiques ont été étudiées numériquement par différents auteurs (e.g. Norton and Knight, 1977 ; Cathles, 1977 ; Norton 1979 ; Candela and Holland, 1986 ; Cook et al., 1997 ; Gerdes and Baumgartner, 1998, Barrie et al., 1999 ; Cui et al., 2001 ; Norton and Hulen, 2001 ; Gow et al., 2002 ; Oliver et al., 2006). Ils ont soutenu que la modélisation numérique constitue une méthode valide pour simuler les systèmes hydrothermaux autour des plutons et étudier la probabilité de former des gisements de minerai autour d'eux.
Les questions suivantes sont les objectifs principaux de cette recherche :
Comment l’emplacement de magma peut-il créer une convection hydrothermale?
Comment la géométrie (la forme) de l’intrusion impacte les systèmes convectifs, la distribution de chaleur, et le R2AI (Restricted Rock Alteration Index, un paramètre développé pour localiser la zone favorable pour la minéralisation)?
Quel est le rôle de la zone perméable (des fractures et des failles) lors de la formation des gisements de minerais?
Comment la modélisation numérique peut-elle aider à expliquer le lien génétique entre l’intrusion et la minéralisation associée et les problèmes de datation?
Pour répondre à ces questions, nous avons divisé notre travail en deux parties principales représentant :
1) L'examen de modèles théoriques de circulations hydrothermales autour d'un pluton, et la compréhension du rôle de différents paramètres tels que la variation de la perméabilité, la variation de la forme des intrusions et le rôle des zones perméables telles que des failles et des systèmes de fracturation.
2) L'application de nos modèles numériques sur des exemples naturels pour interpréter les observations sur le terrain.
1. General Introduction
The objective of this thesis is to study hydrothermal systems as identified processes accompanied magma emplacement and ore genesis. It includes a numerical approach to characterize heat transfers, hydrothermal fluid flow as results of magma emplacement. The thesis also includes a 3D modeling of a hercynian example from Central Morocco. The example was chosen to study the relationships between intrusions and ore deposition. We also present the numerical modeling as a successful method to examine different hypotheses and natural examples concerning intrusion-related ore deposits.
In the 19th century, a debate on the source of metals has been launched. Hydrothermal deposits have shown that the source can be derived from either purely magmatic solutions or pure meteoric solutions. It is also during this century that J.A. Phillips introduced the concept of mixtures of fluids and the difficulty of determining various contributions.
Later, some scientists have recognized that meteoric and magmatic fluids could both play a role in the mineralization process, and that metals could come from various sources as solutions could move over large distances. At the middle of 20th century, the fact that several sources could coexist in fluids and dissolved species was finally accepted. Definitive proof of this multiplicity has been given by the analysis of radiogenic and stable isotopes allowing to track the source of fluids. Finally, the process of mineralization was defined as a result of a combination of different factors interacting with each other. The main mechanisms include: tectonic deformation, fluid flow, chemical reactions involving mineral dissolution, transport of ions, and precipitation and mixtures of different fluid sources.
In addition, changes in temperature or pressure could be a cause of chemical reactions and precipitation of mineralization too. For example, temperature changes are responsible for changes in fluid density which may lead to the hydrothermal fluid flow where chemical reactions dominate between the rock and hydrothermal solution.
To study these processes, many approaches were proposed; one of these methods deals with numerical simulations which have helped to understand fluid circulation, heat transfer and the zones where chemical reactions can occur. Numerical studies have been varied from simple models, in which the authors observe only one variable such as temperature variation, to complicated models such as coupled models in which the authors observe different variables such as temperature, pressure, fluid velocity and so on. However, numerical modeling was as a key to solve different geological problems in different domains, for example in hydrology (Wu et al., 2002; Garavito et al., 2006; Peratta and Popov, 2006 ; Yin et al., 2007) where models simulate hydraulically and chemically driven fluid and solute transport to calculate
stresses and pressure flow changes and transient solute transport in fractured porous media. In geochemistry field, the numerical modeling ofOndrak and Möller (1999)ofcoupled heat and mass transport was applied to simulate the temporal and spatial evolution of temperature and quartz precipitation in a hydrothermal vein system. In detail, their computer model simulates the time-dependent temperature evolution of a shear zone and its vicinity by convective and conductive heat transport. They attempted to distinguish zones of precipitation and dissolution of vein minerals due to flow-controlled mass transport. Polyansky and Poort (2000) have proposed 2D modelling study of sedimentation, fluid flow and heat flow in the Baikal rift basin undergoing flank uplift and basin subsidence. It has been performed in order to understand the impact of these processes on the surface heat flow and hydrothermal anomalies. Their model suggests that fluid flow in the sedimentary basin combined with a topographically driven heat advection in the surrounding basement is a sufficient mechanism to account for the increased heat flow within the basin and the main features of the hot springs distribution. Garven et al., (2003) modeled brine migration and heat transport in the Kuna Basin, to evaluate flow patterns and heat transport in faulted rift basins and the effects of buoyancy-driven free convection on reactive flow and ore genesis. Moreover, Schardt et al., (2003)simulated numerically seafloor hydrothermal systems based on the Lau back-arc basin. They investigate conditions that lead to the formation of economic massive sulfide ore deposits in seafloor environments. Kühn et al., (2006) have investigated the 3D geological architecture around the Mount Isa lead–zinc–silver and copper deposits to study fluid flow patterns due to free thermal convection in permeable rock masses. Ma et al., (2006) have carried out anumerical model to investigate hydrothermal fluid flow in the Wabamun Group, Parkland field, northeastern British Columbia, Canada. Their numerical results indicate that
faults play the most critical role in controlling hydrothermal fluid flow. Zhu and Yang (2006)
introduced their 2D numerical conceptual model to represent the volcanic facies architecture of part of the submarine Mount Read Volcanic successions in western Tasmania. Their numerical results reveal that a synvolcanic fault strongly controls fluid migration paths.
The pumice and volcanic breccias are also important, focusing on hydrothermal fluid circulation and implying that alteration and mineralization may occur preferentially in such facies. In addition, the syn-volcanic intrusion significantly alters the preexisting regime of fluid flow and temperature distribution. They proposed that vigorous fluid circulation is initiated near the intrusion and then shifts to the more permeable host facies (Zhu & Yang, 2006). Furthermore, Yang (2006) presented the first fully 3D numerical modeling of fluid flow and heat transport in the McArthur Basin, and reveals that fluid flow tends to circulate
within more permeable fault zones and form a series of planar convection cells over the fault
plane rather than in less permeable host rocks.
In geothermal studies, Wisian and Blackwell (2004) have attempted to construct their basic model of extensional geothermal systems that include structure, heat input, and permeability distribution. Their two-dimensional simulation models were used to evaluate the effect of permeability and structural variations in the Basin and Range geothermal system of the western U.S. They have concluded that a permeable fault in one valley can induce flow if there are no equally good upflow paths in the adjacent valleys. Similarly, when bulk permeability is high enough, additional deep circulation cells develop in adjacent valleys, diverting heat and fluid from the fault and consequently reducing temperatures in the fault itself. Guillou-Frottier et al. (2000)simulated porphyry-type ore deposits hosted by ash-flow calderas, using a thermo-mechanical model of upper crustal and study magmatic system behavior during the pre- and post-caldera formation stages. They have shown that in the presence of regional extension, the development of caldera border faults may be suppressed to the advantage of deep-seated fractures, and clustered above the central part of the magma chamber, thus forming favorite conditions for the formation of porphyry-type ore deposits. Stimac et al. (2001) have used 2D numerical model for complex host rocks and multiple emplacements of magma to simulate conductive and convective heat transport around magma bodies, they concluded that high conductive thermal gradients are enhanced locally by fault-controlled zones of convective heat (geothermal fluid) transport. Dobson et al. (2004) and McKenna and Blackwell (2004) characterized a reservoir by utilizing several parameters, including temperature along the producing fault and the predicted surface heat flow. Time scales are on the order of 0.1 Myr for development of maximum reservoir temperatures. They explained that young faults are frequently associated with extensional geothermal systems. Harcouët et al., (2007) computed pressure–temperature paths, compared to thermobarometric data of the area of the Ashanti belt southern Ghana in West Africa. Zhao et al, (1998) presented finite element simulations of temperature gradient driven rock alteration and mineralization in fluid saturated porous rock masses. They explored the significance of production/annihilation terms in the mass balance equations and the dependence of the spatial patterns of rock alteration upon the ratio of the roll over time of large scale convection cells to the relaxation time of the chemical reactions. Special concepts such as the gradient reaction criterion or rock alteration index (RAI) were used, (Ondrak and Möller, 1999 ; Guillou-Frottier et al., 2000 ; Collin et al., 2002 ; Garven et al., 2003 ; Regenauer-Lieb and Yuen, 2004 ; Oliver et al., 2006 ; Yang, 2006 ; Ma et al., 2006). In ore exploration, numerical
modelling was mostly applied in volcanic systems and sedimentary basins (Papale, 1999 ; Yasukawa et al., 2003 ; Simms and Garven, 2004 ; Ma et al., 2006 ; Oliver et al., 2006 ;Gerya and Burq, 2007).
From all the works mentioned above, it is clear that numerical modeling is widely used because of rapid progression of computer technology to solve complicated problems. For that reason, numerical simulation is chosen to answer the following subtitles which represent some questions concerning hydrothermal fluid flow and ore genesis which are not yet clarified enough.
1.1 The origin of hydrothermal fluids related ore deposits
As mentioned above, in the last century, it has been definitively confirmed that hot aqueous solutions have played a part in the formation of many different types of mineral and ore deposits, for example veins, stockworks of various types, volcanic-exhalative deposits and others. Such fluids are usually called hydrothermal solutions and many lines of evidence attest to their important role in carrying a wide variety of materials and of depositing these to form minerals as diverse as gold and muscovite. One of the main arguments faces geologists is the origin of hydrothermal fluids. It was difficult in different sites of ore deposits to determine the origin of hydrothermal fluids, i.e. their meteoric or magmatic origin.
However, homogenization of fluid inclusion in minerals from hydrothermal deposits and other geothermometers have shown that the depositional range for all types of deposit is approximately 50-650°C.
Analysis of the fluid has shown water to be the common phase (Skinner, 1979). Different geochemical studies propos different sources for the origin of hydrothermal fluids (Evans, 1997):
1) Surface and ground water, referred to by geologists as meteoric water. 2) Oceanic water.
3) Formation and deeply penetrating meteoric water. 4) Metamorphic water.
5) Magmatic water.
Three hypotheses were proposed to reconstruct the scenario of the origin of hydrothermal fluids based on geochemical data:
1.1.1 The first hypothesis (magmatic origin)
Based on a spatial relation between many hydrothermal deposits and magmatic activities, a strong team of geologists hold that consolidating magmas are the source of many hydrothermal solutions. The fluids were considered as low temperature residual fluids left
over after pegmatite crystallization. Different scenarios were proposed by different authors based on field and laboratory studies, who flow to the same postulate, propose that magma may be the main source of water, the metals and other elements, as well as, the heat to drive the mineralizing system (Strong, 1981 ; Manning, 1984). More evidences come from stable isotope investigations (Sheppard, 1977). The precise analysis of Bowman et al. (1987) on the Bingham Canyon, Utah deposit demonstrates that the hydrothermal fluids that formed the potassic and propylitic alteration there were magmatic in origin. In addition, Bowman et al. (1987) have used carbon isotope data from Archaean gold vein and shear zone systems Hollinger-McIntyre in Canada and the golden Mile in Western Australia, to sustain the hypothesis of a magmatic origin of the mineralizing solutions. In contrast, Cameron & Hattori (1987)offered an evidence to confirm the presence of oxidized fluids during the formation of Canadian and Australian Archaean gold deposits; they contended the hypothesis that the magmatic origin is the unique source of fluids to form ore deposits.
1.1.2 The second hypothesis (meteoric origin)
In contrast, another school of thought supposed that geothermal systems form where a heat engine (usually magmatic) at depths of a few kilometres sets deep ground waters in motion figure (I.1a). These waters were supposed to be meteoric in origin but in some systems formation or other saline waters may be present. The different kinds of a hydrothermal system are demonstrated in figure (I.1a). Where meteoric water sinking to deep into a zone of high temperature, it absorbs heat and rises into one or a succession of permeable zones (A, B & D). Outflows in (C) depend on the permeability of surrounded rocks and the pressure at the top of the zone (BD). One of the most interesting types is the emplacement of magma, where pluton are the main heat source to boiling water, and consequently, the development of convection currents (convective cells) in the water. Figure (I.1b) illustrates the structure of a geothermal system in a volcanic terrain (aupo Volcanic zone, New Zealand). In figure (I.1c, d) geothermal systems are assumed to be responsible of forming vein tin and copper mineralization in and adjacent to the Land’s End Granite in south-west England. In figure (I.1e) we have a wide picture, with geothermal systems being responsible of some of the different types of mineralization in south-west England (Evans, 1998). This general example shows how the meteoric water and the geothermal systems can be a plausible mechanism to form ore deposits. Another point we need to think about, the most striking characteristic of porphyry copper deposits comparing with other hydrothermal ore deposits is their massive dimensions. The size and shape of these deposits imply that the hydrothermal solutions rise from large volumes of rock, counting host rocks, as well as the parent intrusion. This
supposes that the large volume of hydrothermal fluid comes from the host rocks than from intruded body which makes the meteoric origin of hydrothermal fluids more realistic.
Furthermore, out of intrusions, thermal perturbations made by magma emplacement set up a convective circulation of water in the country rocks, and this may be responsible for the propylitic alteration (diorite model conditions), as Taylor (1981) has shown for the diorite model deposit of Bakirçay, Turkey. In this study, he used Sr isotopes to demonstrate that fluids that formed the potassic alteration were magmatic-hydrothermal and those that caused the propylitic alteration were meteoric-hydrothermal, but he did not show the mechanism of convective circulation or how this can be related to fluid forming ore deposits. Previous works have shown that estimating water concentrations in felsic magmas vary from 2.5 to 6.5 wt%, at depths around 4.5 km fluid remains in liquid case in melts due to high containing pressure (> 0.1GPa), (Evans, 1998). As magmas crystallize to form anhydrous minerals, a huge volume of water can be released by a cooling magma,1km3 of felsic magma with 3% water could exsolve approximately 100Mt (1011 l), (Brimhall & Crerar, 1987). Whether any granitic magma can create economic ore deposits under good conditions, or whether the ability to release a significant amount of mineralizing fluids is dependent on the source of magma itself to have high concentrations of metals, is today under active debate (Evans, 1998).
In addition, during the cooling phase of intruded magma, the meteoric fluids may mix with magmatic system and leading to the development of low temperature minerals: sericite, pyrophyllite and clay minerals. Taylor & Fryer (1982, 1983) have used geochemical analysis to demonstrate that the meteoric-hydrothermal fluids had the potential to remobilize and reconcentrate copper and molybdenum at both Bakirçay and Santa Rita, New Mexico. Moreover, Nesbitt et al. (1989) and Madu et al. (1990) discussed and produced isotopic evidence for regarding these mineralizing fluids as evolved meteoric water that had gained hydrogen and oxygen isotopic values close to those of magmatic and metamorphic water by interaction with sedimentary rocks. A cross section shows the formation of Carlin deposits is given in figure (I.2).
Berger & Bagby (1991) and other authors favor intrusion-driven hydrothermal convection cells as the mineralizing mechanism. They suggest that meteoric fluid is the responsible to form gold deposits. Fluid inclusion work proposes that boiling phase was not an important precipitation process, and perhaps, a mixing with cooler meteoric water having a different chemical composition was the mechanism of ore formation.
Figure (I.1) (a) Some features of a geothermal system. (b) structure of a geothermal system like that of the Taupo volcanic zone, NZ. (after Henley & Ellis 1983.) (c and d) evolution of some of the mineralization in a flank of the Land’s End Granite; (e) (after Moore 1982) possible fossil geothermal systems associated with the granite batholith of south-west England, illustrating the different types and settings of mineralization in that region, and the district zoning developed there. (1) Dines (1956) type emanative canters. (2) cross course mineralization (succinctly described by Alderton 1978). (3) Kaolin deposits (weathering may have played a part in their formation).
1.1.3 The third hypothesis (meteoric and magmatic origin)
One of the famous hypothetical mechanisms is the mixing of waters, e.g. magmatic and meteoric waters. Recent evidence confirms that some deposits can be created by different types of fluids. Those fluids with at least two different parentages may have played a major role in the formation of some ore deposits.
Figure (I.2) Formation of Carlin-type deposits, (modified after Sawkins 1984).
The meteoric origin has been proposed of different fluids, but the reaction and long burial give them different chemical characters. Moreover White (1974) has proposed a meteoric origin for both metamorphic and formation fluids but chemical reactions between rock and fluids may change the chemical character.
The mixture fluid was also shown in different natural examples, where intrusions were only interpreted as the main heat source to provide the driving force for the circulation of fluids. Silver veins of the Hualgayoc district, Peru, were discussed by MacFarlane & Petersen (1990); their investigations showed that intrusions were the main heat source in the ore-forming solutions, but the source of fluid was mixed between meteoric, magmatic and metamorphic origin. Plimer (1985) has also postulated a mixed source for metals in huge Broken Hill orebodies of New South Wales. As well as, Hall (1990) demonstrates that some ore deposits Cornish deposits such as boron, lithium and tin in were derived from the granites, whereas the copper and sulphur was leached from the country rocks. A similar scenario was proposed by Cathelineau (1982) to explain the epigenetic uranium mineralization of the Variscan Metallogenic Province of western Europe.
Ore geology, like in other topics of earth sciences, we study and model the evidence and data collected in the field and from lecture survey and try to reconstruct the story, but in many analytical studies the evidences and results are sometimes partial and open to a variety of interpretations. Therefore, a worth further research concerning the best investigated deposits and their modes of genesis are still modified continually.
Based on the lecture survey, we can here introduce our first series of questions: what are the most important, meteoric or magmatic fluids? Are the meteoric fluids enough to form ore deposits or do we need magmatic fluids to create them? What is the role of magmatic body in the generation of ore deposits, is it a genetic or a structural role?
Newberry et al. (1990) contended that a major factor controlling metallogeny is the depth of emplacement?
How could the circulation of hydrothermal fluid be around magmatic bodies during and after emplacement?
1.2 Hydraulic fracturing
It was suggested that any hydrothermal process requires the development of sufficient rock permeability to permit the mineralizing solutions to flow far from their source to the depositional zones. Therefore, for flow to take place in such systems regional permeability must be developed. This permeability is realized by fractures on micro scales to major crustal faults. Additionally, under such conditions such as shear zones or fractures, ore constituents may be accumulated in zones of low pressure. In this way, the assemblages of many gold veins may have been formed (Saager et al., 1982). Much of the fracturing is due to the solutions themselves, it is now well known that fluids under high pressure can dramatically influence the mechanical behaviour of the crust (Phillips, 1972) and develop sites for precipitation of material held in solution. The fracturing of rocks by water under high pressure is known as hydrofracturing or hydraulic fracturing. These systems were supposed to have a capacity to leach a wide range of components including ore-forming materials from a very large volume of crust (Yardley, 1983 ; Fischer & Paterson, 1985).
It is now known that major roles in enhancing rock permeability are played by the development of fracture systems on very different scales. Such a model, and variations of it, has been used to explain the formation of a number of gold deposits (see, Kerrich & Fryer (1979), Phillips et al. (1984), Shepherd & Allen (1985), Annels & Roberts (1989) and Williams (1990).
Figure (I.3) Diagram of a shear zone where metamorphic water from a large volume of rock is rising to higher levels. (modified after Fyfe & Henley 1973).
Some of these and other authors have advanced the results of isotopic studies in support of their models. Based on the discussion above, hydraulic fracturing plays an important role in the circulation of fluids in the zone around intrusions. Consequently, it leads to the formation of veins in which may host different economic deposits, figure (I.3).
The second series of questions then comes from the role of fracture systems or faults where the permeability is relatively high comparing to the surrounding zone.
What is the role of faults and/or fracture systems? Do they play a role of valve to transport ore constituents far from hot zone (around intruded body) or do they also play a role of structural trap for ore deposits?
1.3 Age dating of ore deposits
When orebodies represents part of a stratigraphical succession, like the Mesozoic ironstones of north-western Europe, their age is absolutely defined. On other hand, syn-genetic deposits are sometimes difficult to date, especially when there are evidences that many of them may
have formed from polyphase mineralization, with epochs of depositions being separated by intervals of several Myr.
Brimhall (1979) has shown that there are two mineralization cycles: pre-main and main. The mineralization of the pre-main cycle consisted of mineralization formed at 600-700°C, and possible set in motion by a younger intrusive system. During the main cycle, relating to hydrothermal fluids, achieved temperature of 200-350°C and leached much of the disseminated copper, to form the rich vein ore deposits.
Hayba et al. (1986) and Heald et al. (1987) have classified these types of deposits into two groups: acid sulphate and adularia-sericite. Heald et al. (1987) proposed that these two groups of deposit reflect their distance from their main heat source; the acid sulphate type being spatially and temporally related to a shallow hydrothermal system Figure (I.4a). Conversely, the adularia-sericite deposits are later than the magmatic activity. Consequently, it becomes spatially unrelated to intrusive volcanic and have formed above a deeper heat source, (figure I.4b).
A third series of questions thus arises: if we have a genetic link between mineralization and intruded bodies, why do we have a gap in age between mineralization and parent pluton, is that related to the period of emplacement? Why the mineralization appears to be older than parent pluton in certain cases?
Moreover, can we take this phenomenon as an argument to prove that there is no genetic link between the pluton and mineralization? Furthermore, if there is a long period of deposition, on which factor(s) does it depend?
1.4 Intrusion geometry
Sillitoe (1973) showed that porphyry copper deposits that occur in a subvolcanic environment associated with stocks (apexes). Christie & Braithwaite (1986) and other workers have pointed out that apexes or high portions of intrusive body may be responsible for the formation of epithermal gold mineralization. In porphyry copper deposits, different evidences suggest that porphyry is connected to an equigranular intrusion of similar composition with much larger dimensions.
Within this complicated form, the mineralization (development of oligoclase and actinolite) has been trapped because of pluton’s form (Carten, 1986). After Carten et al. (1988), Seedorff (1988) has shown that the existence of 12 stocks related to three intrusive bodies is the responsible of forming of different hydrothermal alteration assemblages in numerous cycles in Henderson deposits. Each apex was surrounded by an ore shell. Moreover, from different studies (e.g. White 1981, and Wallace, 1991), three general orebody morphologies were
recognized and may depend on the morphology or the shape of related intrusion, figures. (I.5 & I.6). From the data mentioned above, the fourth question is what is the role of pluton geometry in trapping or localizing ore deposits?
Figure (I.4) the formation of two types of epithermal deposits in a volcanic system, based on Heald et al (1987) with modifications from Henley (1991). (a) acid sulphate type. (b) Adularia-sericite type. The heat source is represented by an intrusion several kilometers below the mineralized zone. (a) is drawn at the same scale as (b).
We presented above the main four problems concerning this research which will be answered or at least more clarified by our numerical approach. The following sections are to present some of principle knowledge in mineralisation classifications in order to show the diversity of ore deposits. Then we focus our interest in ore related igneous activity and more precisely in ore felsic association because it is considered economically as one of the main purposes in ore geology.
2. Classifications of ore deposits
Many classifications were made by different authors to classify ore deposits. The first classification was proposed by Lindgren’s in 1913 and improved in 1933. The classification was based on the type of process forms ore deposits:
2. Deposits formed by chemical processes of concentration.
(A) In surface waters: (i) by reactions (between solutions), and (ii) by evaporation (of solutions).
Figure (I.5) Porphyry orebody morphologies. Modified after (Evans, 1998).
After that we present the major concepts in numerical modelling and finished by summarizing our aims of research.
Figure (I.6) Generalized geological section through the Climax mine, Colorado (modified from Hall et al. 1974).
(B) in bodies of rock: (i) by concentration of substances contained within rocks by (a) weathering, (b) ground water and (c) metamorphism; (ii) by introduced substances (a) without igneous activity, and (b) related to igneous activity by (I) ascending hydrothermal waters, i.e. epithermal, mesothermal and hypothermal deposits, and (II) by direct igneous emanations, i.e. pyrometasomatic and sublimate deposits. (C) In magma by differentiation: (i) magmatic deposits, and (ii) pegmatites.
Epigenetic hydrothermal deposits are classified according to their depth and temperature of formation: 1) hydrothermal deposits correspond to deep-high temperature deposits; 2) mesothermal deposits formed at low temperatures and medium depths, 3) epithermal deposits formed near surface, 4) leptothermal deposits located in the transitional zone between
mesothermal and epithermal and 5) telethermal deposits correspond to very low temperature deposits formed far from the source of the hydrothermal solutions.
In addition, Stanton (1972) classified ores as rocks; he recognized seven important worldwide associations as follows:
1) Ore in igneous rocks:
(A)Ores of mafic with ultramafic associations. (B)Ores of felsic association.
2) Iron concentrations of sedimentary affiliation.
3) Manganese concentrations of sedimentary affiliation.
4) Stratiform sulphides of marine and marine-volcanic association. 5) Strata-bound ores of sedimentary affiliation.
6) Ores of vein association.
7) Ore deposits of metamorphic affiliation.
Finally, another classification was proposed by (Jébrak & Marcoux, 2008), where ore deposits were arranged based on their environment to:
1) Ores associated to plutons: a) mafic and ultramafic, b) felsic, c) alcalan plutons and d) in metamorphic settings.
2) Ores associated to volcanic activities (Marin and continental volcanic activities). 3) Ores in sedimentary basins
4) Ores related to continental hydrothermalism.
In this research, we focus on ore deposits associated to felsic intrusions. 3. Peri-granitic Mineralization (ore related to igneous activity)
The mineralizations associated to granitic plutons are the main types of mineral deposits on our planet, figure (I.7). This type is a major supplier of metals such as Au, W, Ag, Pb, Zn., Through many types of deposits (porphyry copper, pre-granitic veins, skarns ...). It is therefore of major economic targets.
Thompson et al. (1999), Thompson & Newberry (2000) and Lang & Baker (2001) have attempted to identify the following characteristics in ore-related intrusions:
1) Granitoids which are spatially associated to gold mineralizations are predominantly poor in calcium and metaluminous to peraluminous.
2) In a geodynamic frame, these granitoids are located on active continental margins. 3) These intrusions are late-orogenic.
4) The mineralization is located in the granitoids, and / or their edges in both intrusions and host rock.
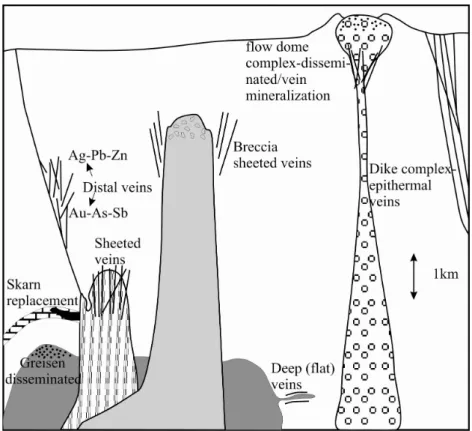
5) The morphology of the mineralization is highly variable: it occurs most often in the form of quartz veins, parallel to each other or stockwork. However, the mineralization is also present in both veins and disseminated in the granite (Fig. I.8), as breccia (Kidston, Australia,), in the form of Greisen (Salavas, Spain, (Harris, 1980)) or as a skarn contact.
Figure (I.7) Some examples of ore deposits associated to intrusions of gold deposits. Modified after Thompson et al. (1999), Thompson & Newberry (2000) and Lang & Baker (2001).
6) The amount of sulphide represented in mineralization is always low (less than 3%), they occur frequently as an identical metal characterized by the presence of arsenic, tungsten, tin, bismuth, tellurium, gold, silver and antimony. Quantitatively, pyrite and / or arsenopyrite are dominant. The gold is in the form of electrum or maldonite with bismuthinite and bismuth. 7) The alterations associated to the mineralization are marked by the appearance, in varied proportions qualitatively and quantitatively of quartz, potassium feldspar, albite, sericite, carbonates.
8) The composition of fluids is mainly low salinity-CO2 dominant, (Thompson et al., 1999).
Some of these points are not included in our models, where geochemical model is needed to verify them. In contrast, the physical relationship between mineralization and pluton can be simulated using our approach. Later, we will attempt to verify also the points (4 and 5) by observing the spatial relation between intrusion and ore deposits (where and when could they be formed comparing with emplacement period of magma), the morphology of ore deposits as a consequence of pluton geometry, these points and the questions mentioned above will be
answered, either by hypothetical and/or field observations of natural examples where pluton related ore deposits is still debated.
Fig. (I.8) The different mineralization styles spatially associated to intrusions. (modified after Thompson & Newberry 2000).
4. Numerical modeling
During the nineteenth century, scientists started to use simple models that were essentially mechanical (analogical modeling) to simulate and study the regional deformations in the upper crust. In twentieth century, the computer science arises, and the numerical modeling invaded almost all the scientific domains, because it resumes time, effort and gives more detailed results with simple modifications.
The principal role of numerical modeling is that if the laws of a new phenomenon have the same form with those of another which has already been studied, then the consequences of the latter can be transferred to the new phenomena. Therefore, examining physical laws with simple models is necessary to understand the simple consequences. Afterward, the validation of the model by simulate a physical phenomena and published models are also essential to verify that the model is able to reproduce the same results and bring insights that can often be answers or explanations about real complicated models. For that reason, progression and attempt to find an explanation for numerical solutions each time and simple case is essential before taking a step again forward the physical complexity.
Formulation:
In this part, the modeler tries to express the physical problem in mathematical form. Numerical implementation:
During this period, the mathematical model is ready for solution. An algorithm solution is appropriate for implementation by the computer.
Computation:
This part includes the coding of the solution algorithm by using a computer language. Long and a complicated code may be involved here. thus, the code must be considered carefully at this stage.
Validation:
Simplifications and approximations are the foundations of numerical modeling. As a result, unacceptable errors may be introduced in numerical solution. Thus, it is essential to verify and compare the numerical results with studied physical phenomena.
In this research, which is focused on a single modeling method, it is not possible to present in detail all aspects of numerical modeling. However, by a systematic approach to model building, the basic processes inherent in many similar methods will be presented with numerical procedures and simplification in the next chapter.
5. Numerical application in geological fields
The classical methods such as geochemical analysis may often be insufficient to quantify the temporal evolution of hydrothermal systems. For example, what we observe in the field is a result of numerous coupled processes such as fluid flow, water–rock interaction, and fluid evolution which have taken a long time periods to form an observed mineralization, and at the end the samples bring often the traces of last periods, mixed with deformed traces of previous periods.
Based on this introduction, the development in numerical modelling may brings the answer to separate different processes and examine the duration and controlling factors of a
hydrothermal circulation. In one hand, an oversimplification of the system by decoupling
different processes included in vein mineralization makes the numerical modelling too far from the reality. In the other hand, nonlinearities of the coupled system make analytical solutions difficult or even impossible. For that reason, numerical models simulating coupled heat and mass transport may be the reasonable method to obtain a better understanding in time scales at which hydrothermal vein deposits form. Even though some models decrease the complexity of real systems and replaces them by principal geological units, physical processes and chemical reactions, the solution of running numerical models (in previous works)
emphasises that the numerical results bring insights to better understanding different physical phenomena.
Hydrothermal convections related magmatic intrusions have been studied numerically by different authors (e.g. Norton and Knight, 1977 ; Cathles, 1977 ; Norton, 1979 ; Candela and Holland, 1986 ; Cook et al, 1997 ; Gerdes and Baumgartner, 1998 ; Barrie et al., 1999 ; Cui et al., 2001 ; Norton and Hulen, 2001 ; Gow et al., 2002 ; Oliver et al., 2006). They sustained that the numerical modelling is a valid method to simulate hydrothermal systems around plutons and studying the probability of forming ore deposits around them.
Barrie et al. (1999) reviewed a variety of models simulating active and fossil hydrothermal systems, in different geological settings and concluded that the geometry and depth of the intrusion, the permeability of the host rock and hydrothermal system during and after the emplacement are the four critical factors in determining the style and pattern of alteration and mineralization. More recently, Schardt et al. (2005) investigated the effect of magma intrusion on the genesis of the ore deposit in Western Australia. However, there have been fewer papers dealing with the mechanisms of fluid flow, from metal source regions, transport through a fracture network, to the deposition sites (see Large et al., 2005; Leach et al., 2005; Oliver et al., 2006 and Beaudoin et al., 2006).
We present here our models as a hydrothermal coupled model which has the capacity to be closer to the reality by: 1) varying numerous physical parameters such as viscosity, density, heat capacity and thermal conductivity of fluid and rock which varied with temperature. As
well as the pressure and permeability which are varied with depth. These parameters have not
been varied together before 2) studying the hydro-thermal behaviour before, during and after magma emplacement to examine active and fossil hydrothermal systems 3) arguing different
models with varied pluton’s shapes and depth of emplacement 4) dealing with the
mechanisms of fluid flow, from metal source regions, transport through a fault or fracture network, since it is increasingly recognised as an important mechanism for fluid flow and mass transport in hydrothermal systems (see Zhao et al., 2003, Large et al., 2005; Leach et al., 2005; Oliver et al., 2006) 5) applying RAI (alteration rock index) in our models and use it as an indicator to sites of ore deposits 6) attempting to simulate and simplify natural examples and compare our result with field observations.
6. Aims of this research
Numerical modelling is a method to quantify hydrothermal fluid flow, and to examine the factors that control the hydrothermal circulation induced by magmatic intrusions. Thus, our work is focused on the prospective effects of the geometry of intruded body, depth of
emplacement and the role of apexes and permeable zones (such as fractures and/or faults) in hydrothermal systems during and after emplacement.
The aim of this work is to provide a theoretical background for the interpretation of hydrothermal data showing indications of fluid circulation and heat transfer. The system investigated here is simplified to discuss the relationships between temperature and fluid physical parameters; we acknowledge here that our hydrothermal systems and their equations of enthalpy are lacking for more complex systems. Hereunder, we attempt to simulate and simplify different natural examples by studying only the fluid circulations in the porous media without taking into account the chemical alternation /interactions between meteoric and magma fluids.
Investigation of mineralization in a particular area should begin by considering the following five questions:
1. What is the architecture of the mineralizing system? 2. What is its geotectonic history?
3. What processes were driving fluid flow on the scale of the system? 4. What was the nature of the fluids associated with the mineralization? 5. What was the mechanism for alteration and precipitation of the ore?
Qualitative answers to these questions lead the way to conceptual models, which in turn provide a framework for quantitative, numerical models.
The objective behind this part is to examine the effects of the pluton geometries and the heterogeneous permeability distributions on fluid circulation, heat transfer and subsequently localizing (R²AI), within some different known geological settings, in order to estimate the possible position of ore deposits.
The following questions are the main aims of this research:
1. How does intruded magma affect and/or create a hydrothermal convection?
2. How does the geometry (shape) of intruded body impacts on convective patterns, thermal distribution and R2AI?
3. What is the role of permeable zone (fractures and faults) in forming ore deposits? 4. How does the numerical modelling explain the genetic link between intruded magma
and related mineralization and the age dating problems as well?
1) Examine theoretical cases of hydrothermal circulation around a pluton, and study the effects of different parameters such as permeability, shape of intruded bodies and permeable zones (e.g. faults and fracture systems).
2) Applying numerical models to natural cases to compare numerical results with field observations.
Chapter (II) Numerical modeling and physical properties of
magma
Résumé français du chapitre (II)
Dans cette partie de la thèse, nous essayons d'expliquer brièvement les paramètres physiques du magma qui jouent un rôle important pour le transfert de chaleur et l’écoulement de fluide. Puis nous décrivons la construction du modèle et nous terminons avec la validation de notre modèle avant les applications.
1. Paramètres physiques
L'évolution de la distribution de la température en n'importe quelle structure est régie par les propriétés thermiques du matériel, en particulier par la capacité calorifique et la conductivité thermique.
1.1 Conductivité thermique
C’est la propriété d'un matériel qui indique sa capacité à transférer la chaleur de façon conductive. La conductivité thermique (W.m-1.K-1) varie inversement avec la température. Ainsi des mesures de conductivité thermique en fonction de la température montrent généralement que la conductivité thermique diminue avec l’augmentation de température, jusqu'environ à 1000-1200°C (Clauser, 1988). Les équations suivantes expriment la conductivité thermique en fonction de la température pour les roches magmatiques, métamorphiques, sédimentaires et l'eau :
λroches magmatiques =−0.0016(T)+2.6842 (II.1)
λroches métamorphiques =−0.0023(T)+3.1138 (II.2)
λroches sédimentaires =−0.0044(T)+4.0276 (II.3)
λl’eau =0.0012(T)+0.2557 (II.4)
où T est la température en K. 1.2 La capacité calorifique
Également connu en tant que chaleur spécifique, c’est la quantité de chaleur qu’il faut fournir à un système pour élever sa température d’un kelvin. Dans le Système International d’unités, la capacité calorifique s’exprime en joules par kelvin (J.K-1). Comme nous avons fait pour la conductivité thermique, nous essayons de trouver un rapport mathématique simple expriment la relation entre la capacité calorifique et la température: