HAL Id: hal-00487014
https://hal.archives-ouvertes.fr/hal-00487014
Submitted on 4 Jun 2010HAL is a multi-disciplinary open access archive for the deposit and dissemination of sci-entific research documents, whether they are pub-lished or not. The documents may come from teaching and research institutions in France or abroad, or from public or private research centers.
L’archive ouverte pluridisciplinaire HAL, est destinée au dépôt et à la diffusion de documents scientifiques de niveau recherche, publiés ou non, émanant des établissements d’enseignement et de recherche français ou étrangers, des laboratoires publics ou privés.
Energy deprivation transiently enhances rhythmic
inhibitory events in the CA3 hippocampal network in
vitro.
C. E. Gee, Pascal Benquet, Sophie Demont-Guignard, Fabrice Wendling, U.
Gerber
To cite this version:
C. E. Gee, Pascal Benquet, Sophie Demont-Guignard, Fabrice Wendling, U. Gerber. Energy de-privation transiently enhances rhythmic inhibitory events in the CA3 hippocampal network in vitro.. Neuroscience, Elsevier - International Brain Research Organization, 2010, 168 (3), pp.605-12. �10.1016/j.neuroscience.2010.04.021�. �hal-00487014�
ENERGY DEPRIVATION TRANSIENTLY ENHANCES RHYTHMIC INHIBITORY
EVENTS IN THE CA3 HIPPOCAMPAL NETWORK IN VITRO
C. E. GEEa,1,2, P. BENQUETb,1, S. DEMONT-GUIGNARDc, F. WENDLINGc AND U.
GERBERa*
a
Brain Research Institute, University of Zurich, Switzerland
b
UMR 6026-CNRS, Université de Rennes 1, France
c
INSERM U642; Université de Rennes 1, France
1
CEG and PB contributed equally to this study
2
Present address: Novartis Pharma AG, CH-4002 Basel, Switzerland
*
Correspondence to: U. Gerber, Brain Research Institute, University of Zurich,
Winterthurerstrasse 190, CH-8057 Zurich, Switzerland
Tel: (41) 44 635 33 03,
Abstract–Oxygen glucose deprivation (OGD) leads to rapid suppression of synaptic transmission.
Here we describe an emergence of rhythmic activity at 8 to 20 Hz in the CA3 subfield of
hippocampal slice cultures occurring for a few minutes prior to the OGD-induced cessation of
evoked responses. These oscillations, dominated by inhibitory events, represent network activity,
as they were abolished by tetrodotoxin. They were also completely blocked by the GABAergic
antagonist picrotoxin, and strongly reduced by the glutamatergic antagonist NBQX. Applying
CPP to block NMDA receptors had no effect and neither did UBP302, an antagonist of
GluK1-containing kainate receptors. The gap junction blocker mefloquine disrupted rhythmicity.
Simultaneous whole-cell voltage-clamp recordings from neighboring or distant CA3 pyramidal
cells revealed strong cross-correlation of the incoming rhythmic activity. Interneurons in the CA3
area received similar correlated activity. Interestingly, oscillations were much less frequently
observed in the CA1 area. These data, together with the observation that the recorded activity
consists primarily of inhibitory events, suggest that CA3 interneurons are important for
generating these oscillations. This transient increase in inhibitory network activity during OGD
may represent a mechanism contributing to the lower vulnerability to ischemic insults of the CA3
area as compared to the CA1 area.
Brain ischemia leads to a rapid increase in extracellular glutamate concentration, which triggers
neurotoxic cell death mainly through the excessive activation of calcium-permeable NMDA
receptors (Choi and Rothman, 1990). Neurons react to the decrease in oxygen and glucose by
initiating a series of adaptive responses to mitigate excitotoxicity. Both long term mechanisms
involving alterations in gene transcription and cell metabolism (Lipton, 1999), as well as
immediate effects on electrophysiological properties (Krnjević, 2008) serve to protect neurons,
thereby allowing them to recover from ischemic insults of short duration. Among the best
characterized of the immediate protective mechanisms are neuronal hyperpolarization (Hansen et
al., 1982; Fujiwara et al., 1987; Leblond and Krnjević, 1989; Luhmann and Heinemann, 1992;
Jiang et al., 1994; Fujimura et al., 1997; Erdemli et al., 1998; Tanabe et al., 1999) and
adenosine-mediated inhibition of glutamatergic synaptic transmission (Fowler, 1989; Zeng et al., 1992;
Gribkoff and Baumann, 1992; Katchmann and Hershkowitz, 1993; Zhu and Krnjević, 1997;
Pearson et al., 2006). The neuronal hyperpolarization enhances magnesium block of the NMDA
channel, which impedes calcium influx, thereby reducing excitatory synaptic transmission by
inhibiting glutamate release. In addition, it was recently shown that specific classes of neurons
that are particularly resistant to ischemic cell death express mechanisms to down-regulate NMDA
receptor function (Avignone et al., 2005; Gee et al., 2006; Nakanishi et al., 2009; Zhang et al.,
2009). Changes in membrane properties and in synaptic function are expected also to modify
network activity in neuronal populations. Indeed, ischemia induced an epoch of high frequency
discharge recorded from the hippocampus in anesthetized rats just prior to the suppression of
synaptic activity (Freund et al., 1989). And in an in vitro preparation consisting of the whole
hippocampus from neonatal rats, anoxia induced gamma oscillations originating in the CA3 area
characterized the basic properties of these oscillations by recording from individual hippocampal
neurons and from cell pairs. We find that the rhythmic responses induced in the hippocampus at
the onset of OGD are driven primarily by a powerful activation of the inhibitory network in the
CA3 region.
EXPERIMENTAL PROCEDURES
All experiments used protocols approved by the Veterinary Department of the Canton of Zurich. Hippocampal slice cultures were prepared from 6 day old Wistar rats and maintained for 3-6 weeks in vitro using the roller drum technique as described (Gähwiler et al., 1998). Animals were killed by decapitation. Slice cultures were then transferred to a patch-clamp recording setup and superfused with artificial cerebrospinal fluid (ACSF) equilibrated with 95% O2/5% CO2
containing (in mM): 124 NaCl, 2.5 KCl, 26 NaHCO3, 1.25 NaH2PO4, 10 glucose, 3 CaCl2, 2
MgCl2, pH 7.4. Neurons were visualized with DIC optics and whole-cell patch-clamp recordings
were made with pipettes (2-4 MΩ) containing (in mM): 140 Cs-gluconate, 5 NaCl 10 HEPES, 10 phosphocreatine, 1 mM EGTA, 1 mM MgCl2, 0.1% biocytin, pH 7.2-7.4. Neurons were
voltage-clamped at -50 mV, a potential where the driving force allows visualization of both excitatory postsynaptic currents (EPSCs) and inhibitory postsynaptic currents (IPSCs). Signals were amplified with an Axopatch 200B amplifier (Axon Instruments, Foster City, CA), filtered at 2 kHz, stored and analyzed on a personal computer using pClamp8 or pClamp9 software (Axon Instruments). Series resistance (7-15 MΩ) was monitored regularly. Stimulation (200 μs) was applied with a glass pipette filled with artificial cerebrospinal fluid placed in the stratum lucidum. OGD was induced by superfusing slice cultures with artificial cerebrospinal fluid equilibrated with 95% N2/5% CO2 in which glucose was substituted with 8 mM sucrose plus 2 mM
2-deoxyglucose and 3 mM NaN3 was added. Note that 8 mM sucrose is much below the typical
concentrations of 500 mM sucrose, which are used to induce direct osmotic effects on transmission (Rosenmund and Stevens, 1996).
After recording, slices were fixed 4-12 hours in 4% paraformaldehyde in 0.1 M phosphate buffer pH 7.4. Slices were washed in 0.1 M phosphate buffer then equilibrated overnight with 30% sucrose 12% glycerol quick-frozen in liquid nitrogen cooled isopentane and stored at -80 °C until processed. After thawing, slice cultures were removed from the coverslips, washed in 0.1 M phosphate buffer and permeabilized in 0.1 M phosphate buffer, 0.4% Triton X-100 and 5% heat-inactivated horse serum for 24 hours at 4 °C. Slices were then processed with streptavidin-conjugated AlexaFluor-488 to reveal biocytin-filled neurons. To visualize the layers of the hippocampus, a primary antibody that recognizes mature neurons (neuronal nuclear antigen, mouse α-NeuN 1:400, Chemicon, CA, USA) was incubated for 24 hours at 4 °C in 0.1 M phosphate-buffered saline with 0.4% Triton X-100 and 2.5% heat-inactivated horse serum. Cultures were washed with 0.1 M PB 0.4% Triton X-100 (4 x 30 min) and incubated at 4 °C overnight with donkey α-mouse Alexa 546 (1:350, Molecular Probes) in 0.1 M PB, 0.4% Triton
X-100 and 2.5% heat-inactivated horse serum. After extensive washing sections were air-dried, mounted with Fluorostab mounting medium (Bioscience Products AG, Switzerland), and stored in the dark at 4 °C. Image stacks were collected with a Leica SP2 confocal microscope and interneurons were identified by their morphology and an absence of dendritic spines.
Chemicals
Concentrated stock solutions of drugs were prepared in distilled water or dimethylsulfoxide as appropriate, stored at -20 oC in single-use aliquots, thawed and diluted in ACSF immediately before use. Picrotoxin and mefloquine were purchased from Sigma. NBQX, SYM2206, UBP302, DHPG, YM298198, and MPEP were purchased from Tocris (Bristol, UK). CPP was kindly provided by Novartis AG (Basel, Switzerland). Tetrodotoxin was purchased from Ascent Scientific (Bristol, UK).
Analysis
Two types of analyses were performed to describe the activity induced by OGD. In the first instance autocorrelation functions were used to classify the activity as rhythmic or not. When two cells were recorded simultaneously, cross-correlation functions were also calculated alongside the autocorrelations. Records were examined by eye and the autocorrelation and/or cross-correlation functions were calculated using Clampfit for the 3-4 most rhythmic-appearing 0.6 – 2 s long segments during each condition and averaged. The period was calculated from the time of the second peak in the autocorrelation function (period). When the second peak of the autocorrelation function was at least 0.3 and several regularly spaced peaks appeared, the segment was classified as ‘rhythmic’. The overall activity during a given condition was classified as rhythmic when at least 3 rhythmic segments could be identified during the recording. While performing this analysis we observed that the frequency of the activity typically increased initially and would gradually change during the recording. We therefore used a second method of analysis to show the time course of the change in frequency of IPSCs. This approach involved first a pre-filtering of the postsynaptic current responses followed by a classification of the detected transients into IPSCs versus EPSCs based on their shape (polarity, rise, and decay time). The first step consisted of a detrend operation to remove very slow fluctuations that can contaminate the baseline of the signals. This procedure was performed with a moving average filter (duration of the sliding window: 0.25 s). Non-IPSC events were then removed using a threshold operation in which signals of negative polarity are set to zero, and the amplitude of the remaining signals was squared to increase the signal-to-noise ratio. The squared signal was compared to a threshold . To minimize false negatives and false positives, an algorithm was employed that allowed the user to easily adjust the threshold and to immediately view the generated graphed data. Thus, the threshold was adjusted manually and data output was reviewed visually. The frequency of the IPSPs was then plotted against time using a sliding window with 1 second duration.
Statistical analysis
Data are presented as mean percentage of control ± SEM. Paired Student’s t-tests were used to compare responses under the various conditions.
RESULTS
All experiments were performed with roller-drum hippocampal slice cultures where synaptic
connectivity approaches that found in vivo (Zimmer and Gähwiler, 1984; Frotscher and Gähwiler,
1998). Thus, broad band oscillatory activity is much more readily induced in this preparation
(Fischer et al., 2002) than in acute hippocampal slices in which rhythmicity is usually restricted
to a single band and requires application of very high concentrations of agonists (Konopacki et
al., 1987; MacVicar and Tse, 1989; Williams and Kauer, 1997; Fisahn et al., 1998; Gillies et al.,
2002). More recent work, however, has shown that network oscillations are better maintained in
acute slices if an adequate oxygen supply is ensured by increasing the perfusion (Wu et al., 2005,
Hajos et al., 2009).
When pyramidal neurons in the CA3 region of the hippocampus were voltage-clamped at -50mV,
stimulation of the stratum lucidum or dentate gyrus evoked mixed EPSC/IPSC responses
dominated by IPSCs (Fig. 1A, a-d; Brown and Johnston, 1983; Lawrence and McBain, 2003,
Mori et al., 2004). OGD gradually decreased evoked responses until they were completely
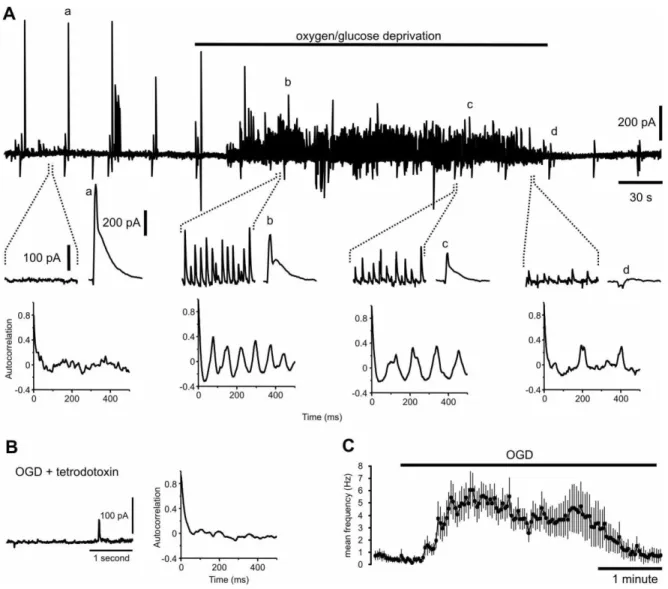
blocked. Coincident with the depression of evoked responses, OGD induced rhythmic activity
dominated by IPSCs in 65 of 69 CA3 PCs, which ceased when evoked responses were blocked
(Fig. 1A). Hypoxia alone failed to induce oscillations. This activity was abolished by tetrodotoxin
(0.5 µM) indicating that it was driven by action potential-dependent synaptic inputs from
presynaptic neurons rather than reflecting intrinsic membrane oscillations (n = 4, Fig. 1B). Once
initiated, the frequency of IPSCs recorded from CA3 pyramidal neurons remained relatively
constant, until all activity stopped (ACF 0.382 ± 0.012, period 111.8 ± 4.5 ms, n = 69 Fig. 1C).
Spontaneous activity returned with some delay when normal oxygenated aCSF was perfused
potassium current initiated by OGD was not examined here, as patch pipettes were filled with a
cesium-based recording solution.
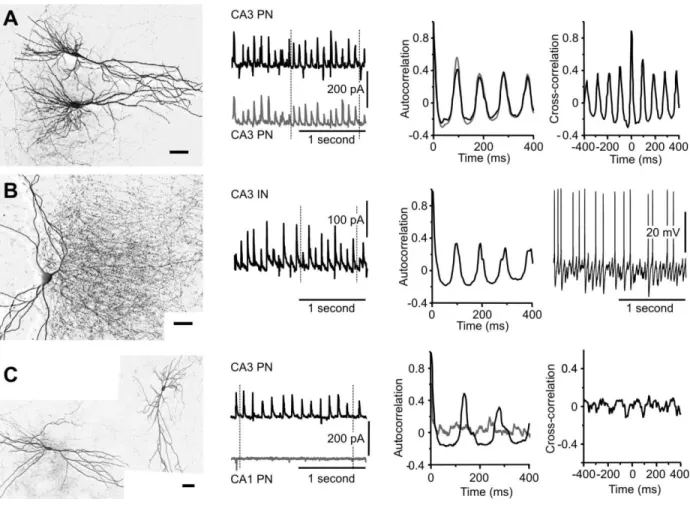
Recording from pairs of CA3 neurons revealed that the activity induced by OGD was
synchronous across the CA3 area (Fig. 2), and activity recorded from pairs of CA3 pyramidal
neurons became highly correlated (CCF: 0.689 ± 0.055, n = 8, Fig. 2A). Recordings from 12 of
16 interneurons in the CA3 area also revealed rhythmic activity during OGD (ACF: 0.331 ±
0.025, period 112.4 ± 5.1 ms, n = 16) that was highly correlated with the activity recorded from
other CA3 interneurons in 3 of 6 pairs (CCF 0.455 ± 0.090, n = 6) or the activity recorded from
CA3 pyramidal neurons in 3 of 4 pairs (CCF 0.572 ± 0.075, n = 4, Fig. 2B). This finding strongly
suggests that OGD-induced network activity occurs throughout the CA3 region of the slice
cultures. When CA3 interneurons were recorded in current clamp mode, action potentials were
not observed during the control period. OGD, however, led to a transient depolarization
associated with action potential discharge (Fig. 2B) in 6 out of 7 cells (mean action potential
frequency: 5.4 ± 1.8 Hz, peak frequency: 48.3 ± 17.2 Hz), consistent with the increase in IPSP
frequency observed in CA3 cells during OGD.
In contrast, in recordings made from the CA1 region, rhythmicity was usually not present in the
activity induced by OGD (Fig. 2C, ACF 0.247 ± 0.066, n = 10). Furthermore, when recordings
were obtained simultaneously from a CA1 and a CA3 pyramidal cell, rhythmic activity was
always seen in the CA3 cell but only in 2 of 7 CA1 pyramidal cells. OGD also induced transient
rhythmic activity in only 2 of 6 neurons located in the dentate gyrus (not shown, ACF 0.209 ±
0.061, period 107.6 ± 13.6 ms, n = 6). These findings suggest that the activity originates in the
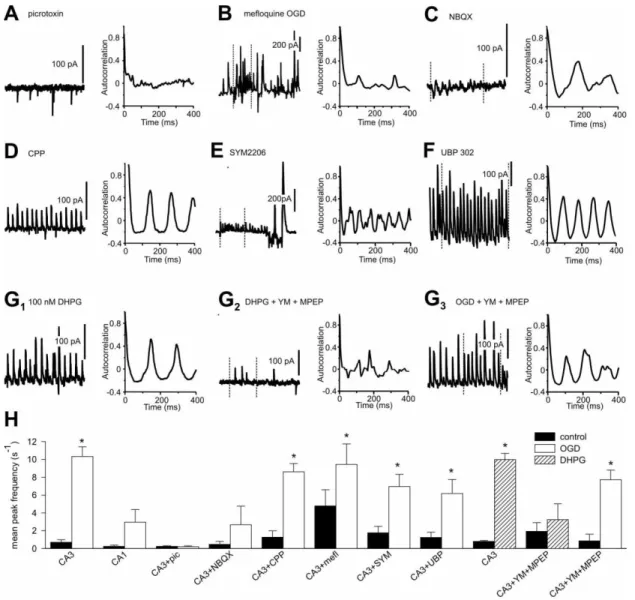
The OGD-induced activity absolutely required the activity of GABAergic interneurons as it was
abolished in the presence of picrotoxin (300 µM) (Fig 3A). Antagonists of glutamate receptors,
however, had diverse effects on the OGD-induced activity depending on the targeted subtype.
The AMPA/kainate receptor antagonist NBQX (20 µM), applied 2 minutes prior to OGD,
dramatically reduced inward (excitatory) and outward (inhibitory) events. However, very small
rhythmic currents remained in 2 of 4 neurons (Fig 3B, ACF 0.295 ± 0.035, period 140.4 ± 16.6
ms, n = 4). OGD-induced rhythmic activity persisted in 5 of 5 CA3 neurons in the presence of the
specific NMDA receptor antagonist CPPene (20 µM) (Fig 3C ACF 0.411 ± 0.039, period 113.4 ±
12.9 ms, n = 5). The specific AMPA receptor antagonists GYKI 54266 (30 µM) and SYM 2206
(20 µM) altered the OGD-induced activity from continuous rhythmic outward currents to very
short (< 1 second) stretches of rhythmic activity (GYKI ACF 0.314 ± 0.033, period 106.9 ± 10.9
ms, n = 5; SYM ACF 0.456 ± 0.060, period 187.3 ± 33.9 ms, n = 6) interspersed with very large
amplitude bursts (Fig. 3D). The GluK1-specific kainate receptor antagonist UBP302 (1 µM) did
not appreciably alter the OGD-induced oscillations (ACF 0.502 ± 0.046, period 100.1 ± 17.5 ms,
n = 4) or at 5-10 µM (Fig. 3E, ACF 0.431 ± 0.052, period 128.9 ± 14.3 ms, n = 4).
Gap junctions between hippocampal interneurons (Meyer et al., 2002; Traub et al., 2003; Price et
al., 2005; Zsiros and Maccaferri, 2005) and probably also between hippocampal pyramidal cells
(Schmitz et al., 2001; Traub et al., 2003; Mercer et al., 2006) play a significant role in oscillatory
behavior. We therefore tested the effects of a 20 minute application of mefloquine (25 µM),
which blocks a number of connexins (Cruikshank et al., 2004; Yamamoto and Suzuki, 2008)
found in neuronal gap junctions. In the presence of mefloquine there was an increase in burst-like
activity in CA3 neurons that for short segments (maximum about 0.6 seconds) was quite
increased the activity (Fig 3F, ACF 0.348 ± 0.027, period 73.3 ± 17.2 ms, n = 3), which again had
primarily very short rhythmic segments.
The increase in extracellular glutamate concentrations associated with ischemia may enhance the
activation of Group I metabotropic glutamate receptors (mGluRs), which are localized peri- or
extra-synaptically (Lujan et al., 1996), and whose activation can induce synchronized oscillations
(Whittington et al., 1995). Indeed, we observed that the group I metabotropic glutamate receptor
agonist (S)-DHPG at low concentrations (~100 nM) induced oscillations in the CA3 region of the
slice cultures that were qualitatively similar to those observed with OGD (Fig. 3G1, ACF 0.433 ±
0.030, period 126.4 ± 11.4 ms, n = 8). OGD induces significant rises in extracellular glutamate
(Jabaudon et al., 2000; Rossi et al., 2000) which may therefore induce oscillations by acting on
group I mGluRs. The non-competitive group I mGluR antagonists YM289198 (2 µM) and MPEP
(5 µM) blocked the oscillations induced by DHPG (Fig. 3G2 ACF 0.177 ± 0.023, n = 6). The
same cocktail did not, however, block the OGD-induced oscillations (Fig. 3G3 ACF 0.488 ±
0.044, period 100.6 ± 12.0 ms, n = 6). Thus, activation of mGluRs is sufficient to induce
oscillations in slice cultures but is not necessary for the oscillations evoked by OGD.
DISCUSSION
This investigation performed with organotypic slice cultures shows that energy deprivation in the
hippocampus results in a strong but transient increase in synaptic inhibitory activity in the CA3
area. The much lower prevalence of rhythmic inhibitory activity in CA1 pyramidal cells is likely
susceptibility of CA1 pyramidal cells to excitotoxic cell death. The frequency of the network
IPSCs in the CA3 area was between 8 and 20 Hz, a range which is somewhat higher than theta
oscillations recorded from rodent in vivo (4 – 12 Hz; Bland, 1986), possibly as a consequence of
OGD. Simultaneous recordings from CA3 pyramidal cell pairs as well as from interneuron pairs
showed that OGD led to highly correlated discharge of IPSPs, which was not apparent during
control periods. This result suggests that individual interneurons impose rhythmicity on large
numbers of neighboring cells, as has been demonstrated in the CA1 subfield (Cobb et al., 1995).
The extreme ramification of basket cell axons (Fig. 2B) is consistent with such an entrainment
function. Synchronization may also involve electrical coupling among neurons (Traub et al.,
2004). Numerous studies have shown electrical coupling among interneurons in the CA1 subfield
(Zhang et al., 2004; Price et al., 2005; Zsiros and Maccaferri, 2005; Zsiros et al., 2007). Our data
suggest that this may also be the case in the CA3 subfield. Mefloquine, at a concentration that
blocks gap junctions, clearly disrupted the OGD-induced rhythmic discharge of IPSPs in CA3
pyramidal cells. The origin of the brief burst of IPSCs is presently unknown and probably reflects
a gap junction-independent effect of mefloquine (Zhou et al., 2006). Interestingly, OGD did not
readily induce oscillations in CA1 pyramidal cells, and furthermore, the oscillations we observed
in CA3 neurons were not propagated to CA1. This is in contrast to normal in vivo conditions,
where the CA3 region represents a major input for theta rhythmicity in CA1 cells (reviewed in
Buzsaki, 2002). Presumably, it is the breakdown in ionic gradients during OGD that leads to
failure in axonal conduction and/or synaptic transmission of Schaffer collaterals.
The emergence of hippocampal oscillations largely reflects intrinsic properties of the synaptic
circuitry, as shown in vivo (Bragin et al., 1995) and in vitro (Fischer et al., 1999; Gillies et al.,
2002; Wu et al., 2005). Furthermore, the theta range of rhythmic activity matches the resonant
to bias the excitability of the network to shift into the oscillatory mode. Both an
sensitive form initiated by cholinergic inputs arising in the septum, as well as an
atropine-insensitive form mediated by as yet unidentified transmitters, and typical for awake animals, can
be distinguished (reviewed in Buzsaki, 2002). The oscillations observed here in hippocampal
slice cultures correspond to the latter form, as this preparation lacks cholinergic inputs (Hefti and
Gähwiler, 1984; Gähwiler et al., 1989). Energy deprivation rapidly reverses the operational
direction of glutamate transporters (Jabaudon et al., 2000; Rossi et al., 2000) leading to
accumulation of extracellular glutamate. Thus, we hypothesized that glutamate serves to trigger
oscillatory activity initiated by OGD. We then attempted to determine which class of glutamate
receptors is mediating the OGD-induced oscillations. We first blocked AMPA receptors, which
greatly reduced oscillations, as described previously (MacVicar and Tse, 1989; Williams and
Kauer, 1997; Gillies et al., 2002). As with the suppression of rhythmicity with tetrodotoxin, this
finding is likely to reflect the requirement of an intact network rather than identifying AMPA
receptors as the generators of theta. NMDA receptors have been implicated in the transmission of
theta activity from the entorhinal cortex to the CA1 subfield in in vivo experiments (reviewed in
Buzsaki, 2002). Furthermore, blocking NMDA receptors inhibited the propagation of oscillations
from the CA3 to the CA1 subfield in slices (Williams and Kauer, 1997). However, we observed
no effect on oscillations in the CA3 subfield after NMDA receptor blockade, in keeping with
earlier studies (MacVicar and Tse, 1989; Williams and Kauer, 1997). Blocking GluK1
subunit-containing kainate receptors also had no effect on rhythmicity. Oscillations in the theta range can
be induced in the CA3 subfield by activating mGluRs (Fig. 3G this study; Cobb et al., 2000;
2003), although at higher concentrations mGluR agonists block theta rhythms because of
non-strongly suggest that activation of mGluRs alone does not trigger the oscillations observed with
OGD. However, high concentrations of extracellular glutamate are likely to have an indirect
action by inducing neurons or glia to release as yet unidentified neurotransmitters or
neuropeptides that drive network oscillations. Thus, even though neurons initially hyperpolarize
in response to energy deprivation (Krnjević, 2008), we propose that a sufficient number of
interneurons are transiently activated through glutamate-induced transmitter release to generate a
transient phase of oscillatory activity. Previous studies in vivo (Freund et al., 1989) and in the
whole hippocampus of neonatal rats (Dzhala et al., 2001) reported that energy deprivation
induced a transient burst of gamma oscillations, whereas in our study in slice cultures we
observed oscillations at lower frequencies close to the theta range. As pointed out by Dzhala and
colleagues (2001), the neonatal tissue they used may not support theta oscillations, which arise
after day 8 in rodents (Leblanc and Bland, 1979; Leinekugel et al.; 2002, but see Karlsson and
Blumberg, 2003). Furthermore, it has been proposed that high levels of gamma oscillation may
interfere with theta activity (Traub et al., 2004). Thus, slight shifts in network conditions may
favor theta oscillations, or gamma oscillations may be more sensitive to anoxia (Huchzermeyer et
al., 2008) than theta oscillations. Network properties will also differ among various in vitro
preparations, which will make it necessary to test further these mechanisms in the in vivo
situation.
In conclusion, this study in organotypic slice cultures shows that energy deprivation induces a
transient increase in inhibitory network activity mainly in the CA3 region, which may contribute
Acknowledgments–We thank D. Göckeritz-Dujmovic, Lubka Spassova, Hansjörg Kasper, S. Giger and R Schöb for excellent technical assistance. We are grateful to B. Gähwiler for suggestions and valuable discussions. This work was funded by the Swiss National Science Foundation.
REFERENCES
Avignone E, Frenguelli BG, Irving AJ (2005) Differential responses to NMDA receptor activation in rat hippocampal interneurons and pyramidal cells may underlie enhanced pyramidal cell vulnerability. Eur J Neurosci 22:3077–3090.
Bland BH (1986) The physiology and pharmacology of hippocampal formation theta rhythms. Prog Neurobiol 26:1–54.
Bragin A, Jandó G, Nádasdy Z, Hetke J, Wise K, Buzsáki G (1995) Gamma (40–100 Hz) oscillation in the hippocampus of the behaving rat. J Neurosci 15:47–60.
Brown TH, Johnston D (1983) Voltage-clamp analysis of mossy fiber synaptic input to hippocampal neurons. J Neurophysiol 50:487–507.
Buzsáki G (2002) Theta oscillations in the hippocampus. Neuron 33:325–340.
Choi DW, Rothman SM (1990) The role of glutamate neurotoxicity in hypoxic-ischemic neuronal death. Annu Rev Neurosci 13:171–182.
Cobb SR, Buhl EH, Halasy K, Paulsen O, Somogyi P (1995) Synchronization of neuronal activity in hippocampus by individual GABAergic interneurons. Nature 378:75–78.
Cobb SR, Bulters DO, Davies CH (2000) Coincident activation of mGluRs and mAChRs imposes theta frequency patterning on synchronized network activity in the hippocampal CA3 region. Neuropharmacology 39:1933–1942.
Congar P, Khazipov R, Ben-Ari Y (1995) Direct demonstration of functional disconnection by anoxia of inhibitory interneurons from excitatory inputs in rat hippocampus. J Neurophysiol 73:421–426.
Cruikshank SJ, Hopperstad M, Younger M, Connors BW, Spray DC, Srinivas M (2004) Potent block of Cx36 and Cx50 gap junction channels by mefloquine. Proc Natl Acad Sci U S A 101:12364–12369.
Dzhala V, Khalilov I, Ben-Ari Y, Khazipov R (2001) Neuronal mechanisms of the anoxia-induced network oscillations in the rat hippocampus in vitro. J Physiol 536:521–531.
Erdemli G, Xu YZ, Krnjević K (1998) Potassium conductance causing hyperpolarization of CA1 hippocampal neurons during hypoxia. J Neurophysiol 80:2378–2390.
Fisahn A, Pike FG, Buhl EH, Paulsen O (1998) Cholinergic induction of network oscillations at 40 Hz in the hippocampus in vitro. Nature 394:186–189.
Fischer Y, Gähwiler BH, Thompson SM (1999) Activation of intrinsic hippocampal theta oscillations by acetylcholine in rat septo-hippocampal cocultures. J Physiol 519:405–413.
Fischer Y, Wittner L, Freund TF, Gähwiler BH (2002) Simultaneous activation of gamma and theta network oscillations in rat hippocampal slice cultures. J Physiol 539:857–868.
Fowler JC (1989) Adenosine antagonists delay hypoxia-induced depression of neuronal activity in hippocampal brain slice. Brain Res 490:378–384.
Freund TF, Buzsáki G, Prohaska OJ, Leon A, Somogyi P (1989) Simultaneous recording of local electrical activity partial oxygen tension and temperature in the rat hippocampus with a chambertype microelectrode. Effects of anaesthesia ischemia and epilepsy. Neuroscience 28:539– 549.
Frotscher M, Gähwiler BH (1988) Synaptic organization of intracellularly stained CA3 pyramidal neurons in slice cultures of rat hippocampus. Neuroscience 24:541–551.
Fujimura N, Tanaka E, Yamamoto S, Shigemori M, Higashi H (1997) Contribution of ATP-sensitive potassium channels to hypoxic hyperpolarization in rat hippocampal CA1 neurons in vitro. J Neurophysiol 77:378–385.
Fujiwara N, Higashi H, Shimoji K, Yoshimura M (1987) Effects of hypoxia on rat hippocampal neurones in vitro. J Physiol 384:131– 151.
Gähwiler BH, Hefti F (1984) Guidance of acetylcholinesterase-containing fibres by target tissue in co-cultured brain slices. Neuroscience 13:681–689.
Gähwiler BH, Brown DA, Enz A, Knöpfel T (1989) Development of the septohippocampal projection in vitro. Experientia 57:236–250.
Gähwiler BH, Thompson SM, McKinney RA, Debanne D, Robertson RT (1998) Organotypic slice cultures of neural tissue. In: Culturing nerve cells (Banker G, Goslin K, eds), pp 461–498. Cambridge, MA: MIT Press.
Gee CE, Benquet P, Raineteau O, Rietschin L, Kirbach SW, Gerber U (2006) NMDA receptors and the differential ischemic vulnerability of hippocampal neurons. Eur J Neurosci 23:2595– 2603.
Gillies MJ, Traub RD, LeBeau FE, Davies CH, Gloveli T, Buhl EH, Whittington MA (2002) A model of atropine-resistant theta oscillations in rat hippocampal area CA1. J Physiol 543:779– 793.
Gribkoff VK, Bauman LA (1992) Endogenous adenosine contributes to hypoxic synaptic depression in hippocampus from young and aged rats. J Neurophysiol 68:620–628.
Hájos N, Ellender TJ, Zemankovics R, Mann EO, Exley R, Cragg SJ, Freund TF, Paulsen O (2009) Maintaining network activity in submerged hippocampal slices: importance of oxygen supply. Eur J Neurosci 29:319–327.
Hansen AJ, Hounsgaard J, Jahnsen H (1982) Anoxia increases potassium conductance in hippocampal nerve cells. Acta Physiol Scand 11:301–310.
Huchzermeyer C, Albus K, Gabriel HJ, Otáhal J, Taubenberger N, Heinemann U, Kovács R, Kann O (2008) Gamma oscillations and spontaneous network activity in the hippocampus are highly sensitive to decreases in pO2 and concomitant changes in mitochondrial redox state. J Neurosci 28:1153–1162.
Jabaudon D, Scanziani M, Gahwiler BH, Gerber U (2000) Acute decrease in net glutamate uptake during energy deprivation. Proc Natl Acad Sci U S A 97:5610–5615.
Jiang C, Sigworth FJ, Haddad GG (1994) Oxygen deprivation activates an ATP-inhibitable K_ channel in substantia nigra neurons. J Neurosci 14:5590–5602.
Karlsson KA, Blumberg MS (2003) Hippocampal theta in the newborn rat is revealed under conditions that promote REM sleep. J Neurosci 23:1114–1118.
Katchman AN, Hershkowitz N (1993) Adenosine antagonists prevent hypoxia-induced depression of excitatory but not inhibitory synaptic currents. Neurosci Lett 159:123–126.
Khazipov R, Bregestovski P, Ben-Ari Y (1993) Hippocampal inhibitory interneurons are functionally disconnected from excitatory inputs by anoxia. J Neurophysiol 70:2251–2259.
Konopacki J, MacIver MB, Bland BH, Roth SH (1987) Carbachol-induced EEG ‘theta’ activity in hippocampal brain slices. Brain Res 405:196–198.
Lawrence JJ, McBain CJ (2003) Interneuron diversity series: containing the detonation— feedforward inhibition in the CA3 hippocampus. Trends Neurosci 26:631–640.
Leblanc MO, Bland BH (1979) Developmental aspects of hippocampal electrical activity and motor behavior in the rat. Exp Neurol 66:220–237.
Leblond L, Krnjević K (1989) Hypoxic changes in hippocampal neurons. J Neurophysiol 62:1– 14.
Leinekugel X, Khazipov R, Cannon R, Hirase H, Ben-Ari Y, Buzsáki G (2002) Correlated bursts of activity in the neonatal hippocampus in vivo. Science 296:2049–2052.
Leung LS, Yu HW (1998) Theta-frequency resonance in hippocampal CA1 neurons in vitro demonstrated by sinusoidal current injection. J Neurophysiol 79:1592–1596.
Lipton P (1999) Ischemic cell death in brain neurons. Physiol Rev 79:1431–1568.
Luhmann HJ, Heinemann U (1992) Hypoxia-induced functional alterations in adult rat neocortex. J Neurophysiol 67:798–811.
Luján R, Nusser Z, Roberts JD, Shigemoto R, Somogyi P (1996) Perisynaptic location of metabotropic glutamate receptors mGluR1 and mGluR5 on dendrites and dendritic spines in the rat hippocampus. Eur J Neurosci 8:1488–1500.
MacVicar BA, Tse FW (1989) Local neuronal circuitry underlying cholinergic rhythmical slow activity in CA3 area of rat hippocampal slices. J Physiol 417:197–212.
Mercer A, Bannister AP, Thomson AM (2006) Electrical coupling between pyramidal cells in adult cortical regions. Brain Cell Biol 35:13–27.
Meyer AH, Katona I, Blatow M, Rozov A, Monyer H (2002) In vivo labeling of parvalbumin-positive interneurons and analysis of electrical coupling in identified neurons. J Neurosci 22:7055–7064.
Mori M, Abegg MH, Gähwiler BH, Gerber U (2004) A frequency-dependent switch from inhibition to excitation in a hippocampal unitary circuit. Nature 431:453–456.
Nakanishi N, Tu S, Shin Y, Cui J, Kurokawa T, Zhang D, Chen HS, Tong G, Lipton SA (2009) Neuroprotection by the NR3A subunit of the NMDA receptor. J Neurosci 29:5260–5265.
Pearson T, Damian K, Lynas RE, Frenguelli BG (2006) Sustained elevation of extracellular adenosine and activation of A1 receptors underlie the post-ischaemic inhibition of neuronal function in rat hippocampus in vitro. J Neurochem 97:1357–1368.
Price CJ, Cauli B, Kovacs ER, Kulik A, Lambolez B, Shigemoto R, Capogna M (2005) Neurogliaform neurons form a novel inhibitory network in the hippocampal CA1 area. J Neurosci 25:6775–6786.
Reich CG, Karson MA, Karnup SV, Jones LM, Alger BE (2005) Regulation of IPSP theta rhythm by muscarinic receptors and endocannabinoids in hippocampus. J Neurophysiol 94:4290– 4299.
Rosenmund C, Stevens CF (1996) Definition of the readily releasable pool of vesicles at hippocampal synapses. Neuron 16:1197–1207.
Rossi DJ, Oshima T, Attwell D (2000) Glutamate release in severe brain ischaemia is mainly by reversed uptake. Nature 403:316–321.
Schmitz D, Schuchmann S, Fisahn A, Draguhn A, Buhl EH, Petrasch-Parwez E, Dermietzel R, Heinemann U, Traub RD (2001) Axoaxonal coupling a novel mechanism for ultrafast neuronal communication. Neuron 31:831–840.
Tanabe M, Mori M, Gähwiler BH, Gerber U (1999) Apamin-sensitive conductance mediates the K_ current response during chemical ischemia in CA3 pyramidal cells. J Neurophysiol 82:2876– 2882.
Traub RD, Pais I, Bibbig A, LeBeau FE, Buhl EH, Hormuzdi SG, Monyer H, Whittington MA (2003) Contrasting roles of axonal (pyramidal cell) and dendritic (interneuron) electrical coupling in the generation of neuronal network oscillations. Proc Natl Acad Sci U S A 100:1370–1374.
Traub RD, Bibbig A, LeBeau FE, Buhl EH, Whittington MA (2004) Cellular mechanisms of neuronal population oscillations in the hippocampus in vitro. Annu Rev Neurosci 27:247–278.
Whittington MA, Traub RD, Jefferys JGR (1995) Synchronized oscillations in interneuron networks driven by metabotropic glutamate receptor activation. Nature 373:612–615.
Williams JH, Kauer JA (1997) Properties of carbachol-induced oscillatory activity in rat hippocampus. J Neurophysiol 78:2631–2640.
Wu C, Luk WP, Gillis J, Skinner F, Zhang L (2005) Size does matter: generation of intrinsic network rhythms in thick mouse hippocampal slices. J Neurophysiol 93:2302–2317.
Yamamoto Y, Suzuki H (2008) Blockade by mefloquine of intercellular electrical coupling between vascular endothelial cells in the guinea-pig mesenteric arteries. J Smooth Muscle Res 44:209–215.
Zeng YC, Domenici MR, Frank C, Sagratella S, Scotti de Carolis A (1992) Effects of adenosinergic drugs on hypoxia-induced electrophysiological changes in rat hippocampal slices. Life Sci 51:1073–1082.
Zhang QG, Wang RM, Han D, Yang LC, Li J, Brann DW (2009) Preconditioning neuroprotection in global cerebral ischemia involves NMDA receptor-mediated ERK-JNK3 crosstalk. Neurosci Res 63:205–212.
Zhang XL, Zhang L, Carlen PL (2004) Electrotonic coupling between stratum oriens interneurones in the intact in vitro mouse juvenile hippocampus. J Physiol 558:825–839.
Zhou C, Xiao C, McArdle JJ, Ye JH (2006) Mefloquine enhances nigral gamma-aminobutyric acid release via inhibition of cholinesterase. J Pharmacol Exp Ther 317:1155–1160.
Zhu PJ, Krnjević K (1997) Adenosine release mediates cyanide-induced suppression of CA1 neuronal activity. J Neurosci 17:2355–2364.
Zimmer J, Gähwiler BH (1984) Cellular and connective organization of slice cultures of the rat hippocampus and fascia dentata. J Comp Neurol 228:432–446.
Zsiros V, Maccaferri G (2005) Electrical coupling between interneurons with different excitable properties in the stratum lacunosummoleculareof the juvenile CA1 rat hippocampus. J Neurosci 25:8686–8695.
Zsiros V, Aradi I, Maccaferri G (2007) Propagation of postsynaptic currents and potentials via gap junctions in GABAergic networks of the rat hippocampus. J Physiol 578:527–544.
Fig. 1. Effects of OGD in the CA3 region of organotypic slice cultures. A) Continuous
voltage-clamp recording from a CA3 pyramidal neuron. Electrical stimuli were applied in the dentate
gyrus region to evoke currents at 30 s intervals. OGD induces rhythmic network activity which
together with the evoked responses is abolished after 3 to 4 minutes. Time of OGD is indicated
by bar above trace. One second segments of the recordings are expanded as indicated below
along with evoked currents (a-d, 100 ms segments). The autocorrelation functions calculated
Fig. 2. Rhythmic activity induced by OGD occurs across the CA3 region. A) Paired
voltage-clamp recordings of two CA3 pyramidal neurons show that the OGD-induced activity was highly
synchronized between cells. B) Sample recording from a CA3 interneuron shows that they also
receive rhythmic network input. The soma was in Stratum pyramidale and the axonal
morphology was typical of a chandelier cell. The panel at the right depicts action potential
discharge in a different CA3 interneuron. C) OGD-induced rhythmic activity was much less
frequently recorded in the CA1 region as shown in this example recording. Autocorrelation and
Fig. 3. OGD-induced oscillations require intact inhibitory transmission and are highly sensitive to
AMPA receptor antagonists. A-G) Traces on the left show the effect of the indicated drug on
OGD- induced oscillations. On the right is the corresponding autocorrelation function for each
trace. In some traces vertical dotted lines indicate the region from which the autocorrelation