Public Health Nutrition: 16(5), 858–863 doi:10.1017/S1368980012003345
Assessment of the PROBIT approach for estimating the
prevalence of global, moderate and severe acute malnutrition
from population surveys
Nancy M Dale
1,*, Mark Myatt
2, Claudine Prudhon
3and Andre´ Briend
11Department of International Health, University of Tampere Medical School, ARVO Building, Tampere, FIN-33014, Finland:2Brixton Health, Llawryglyn, UK:3Health and Nutrition Tracking Service, Geneva, Switzerland
Submitted 16 October 2011: Final revision received 9 May 2012: Accepted 8 June 2012: First published online 27 July 2012
Abstract
Objective: Prevalence of acute malnutrition is classically estimated by the proportion of children meeting a case definition in a representative population sample. In 1995 the WHO proposed the PROBIT method, based on converting parameters of a normally distributed variable to cumulative probability, as an alternative method requiring a smaller sample size. The present study compares classical and PROBIT methods for estimating the prevalence of global, moderate and severe acute malnutrition (GAM, MAM and SAM) defined by weight-for-height Z-score (WHZ) or mid-upper arm circumference (MUAC).
Design: Bias and precision of classical and PROBIT methods were compared by simulating a total of 1?26 million surveys generated from 560 nutrition surveys.
Setting: Data used for simulation were derived from nutritional surveys of children aged 6–59 months carried out in thirty-one countries around the world. Subjects: Data of 459 036 children aged 6–59 months from representative samples were used to generate simulated populations.
Results: The PROBIT method provided an estimate of GAM, MAM and SAM using WHZ or MUAC proportional to the true prevalence with a small systematic overestimation. The PROBIT method was more precise than the classical method for estimating the prevalence for GAM, MAM and SAM by WHZ or MUAC for small sample sizes (i.e. n , 150 for SAM and GAM; n , 300 for MAM), but lost this advantage when sample sizes increased.
Conclusions: The classical method is preferred for estimating acute malnutrition prevalence from large sample surveys. The PROBIT method may be useful in sentinel-site surveillance systems with small sample sizes.
Keywords Surveys Nutrition PROBIT Weight-for-height Mid-upper arm circumference
The prevalence of acute malnutrition is widely used to assess the nutritional status of populations of children aged 6–59 months in developing countries and to plan nutrition programmes. Moderate acute malnutrition (MAM) is defined as a weight-for-height Z-score (WHZ) ,22 and $23 without bilateral pitting oedema and severe acute malnutrition (SAM) as WHZ , 23 or the presence of bilat-eral pitting oedema(1,2). In these definitions, WHZ is most frequently calculated using the WHO growth standards(3).
The most commonly used method for estimating the prevalence of global acute malnutrition (GAM; grouping MAM and SAM), MAM and SAM is by conducting two-stage cluster sampled surveys requiring the measurement of several hundreds of children, typically 900 children (thirty clusters of thirty children) for achieving a sufficient
precision for decision making(4,5). In 2006, the SMART
(Standardized Monitoring and Assessment of Relief and
Transitions) method was introduced(6), addressing the
problems of lack of standardization and lack of metho-dological rigour in the way nutritional surveys were undertaken(7). The method allowed for standardization of surveys for the assessment of nutrition emergencies and provided a generic tool that can be used by various
organizations working in the field(6). Despite the
con-sistency in methodology and analysis that this method has provided for the nutrition community, there remains concern about the difficulty in obtaining usefully precise estimates of SAM prevalence, the large sample size required within the constraints of security and accessi-bility to villages, and the cost in applications such as surveillance by repeated cross-sectional surveys.
The classical method of estimating prevalence is to calculate the number of children meeting a case definition in the sample divided by the total number of children in
*Corresponding author: Email [email protected] rThe Authors 2012
https:/www.cambridge.org/core/terms. https://doi.org/10.1017/S1368980012003345
the sample. In 1995, the WHO proposed the PROBIT method as an alternative method for prevalence estimation. The PROBIT method estimates prevalence indirectly using the inverse cumulative normal distribution function, which converts parameters of a normally distributed variable (i.e. the mean and standard deviation) to cumulative probability below any cut-off, which is equivalent to the proportion of
individuals below the cut-off(8). The 1995 WHO document
states that the main advantage of the PROBIT method is that it requires a smaller sample size than the classical method(8); however, no evidence of this is given. Golden and Grellety stated in 2002 that ‘calculation from the mean and standard deviation could give a more rapid, efficient and precise estimate of the extent of malnutrition than counting affected individuals’(9). There was no specific evidence provided either and no further work on this has been done, although this did lead to the inclusion in the SMART software output of PROBIT estimated prevalence.
The aim of the present study was to compare the PROBIT method with the classical method for estimating prevalence of GAM, MAM and SAM using a computer-based simulation approach to generate populations from real-world survey data sets and then simulate surveys sampled from these populations. Bias in the estimation of prevalence using the classical and PROBIT methods was investigated. The precision obtained for a given sample size when using the classical and PROBIT methods for estimating prevalence were compared.
In addition to weight-for-height, WHO and UNICEF also recommend a SAM case definition based on mid-upper arm circumference (MUAC) of ,115 mm or the presence of bilateral pitting oedema(10). Several agencies also use MUAC $ 115 mm and ,125 mm as a MAM case definition for programmatic purposes(11). We also tested the PROBIT and classical methods using these case definitions.
Methods
The classical method and PROBIT method for calculating prevalence of acute malnutrition were compared using computer-based simulations. First, populations were created from a database of existing surveys. Then surveys describing these populations were simulated by sampling from popu-lations created from these original survey data sets. Database
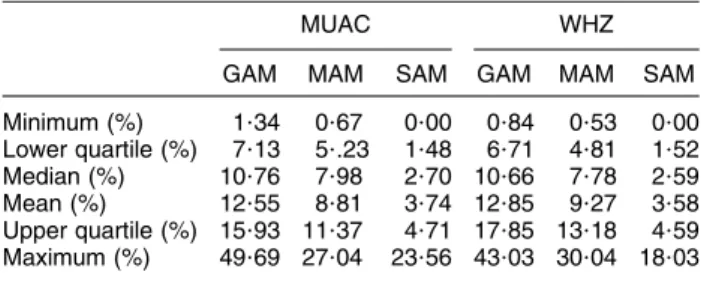
The database used in the analysis consisted of 560 nutritional surveys involving children aged between 6 and 59 months from thirty-one different countries, total-ling 459 036 children. The surveys were carried out by eleven different organizations involved in nutrition pro-grammes throughout the world. The surveys included measurements of weight, height, MUAC and assessment of oedema. WHZ was calculated using the WHO growth standards(3). A summary of the prevalence results for GAM, MAM and SAM from the surveys is shown in Table 1.
Creation of simulated populations
Each of the 560 surveys in the database was used to create a simulated population of 17 000 children by sampling with replacement from the survey data set. This size of population was chosen as being typical of the popula-tions in which nutritional anthropometry surveys are commonly performed. Highly improbable values of the selected indicator were censored before the population was created (i.e. records in which weight-for-height was
,25SDor .5SDfrom the WHO growth standard median
or MUAC was ,80 mm or .240 mm) and appropriate case definitions (Table 2) were applied to the remaining records. Sampling with replacement from the survey data sets was done to create simulated populations of the desired size.
Simulating surveys with different sample sizes Each of the 560 simulated populations was sampled using simple random sampling without replacement. Fifteen different sample sizes (fifty, seventy-five, 100, 125, 150, 175, 200, 225, 250, 275, 300, 350, 400, 450 and 500) were used for these simulated surveys. One hundred and fifty surveys were simulated for each sample size from each population. This process led to a total of 1?26 million simulated surveys: 560 populations 3 15 sample sizes 3 150 simulations 5 1?26 million simulated surveys. Calculation of true prevalence in the simulated populations
We calculated the true prevalence in each simulated population by counting the number of children meeting
Table 1 Summary of prevalence results from the 560-survey data set
MUAC WHZ
GAM MAM SAM GAM MAM SAM
Minimum (%) 1?34 0?67 0?00 0?84 0?53 0?00 Lower quartile (%) 7?13 5?.23 1?48 6?71 4?81 1?52 Median (%) 10?76 7?98 2?70 10?66 7?78 2?59 Mean (%) 12?55 8?81 3?74 12?85 9?27 3?58 Upper quartile (%) 15?93 11?37 4?71 17?85 13?18 4?59 Maximum (%) 49?69 27?04 23?56 43?03 30?04 18?03
MUAC, mid-upper arm circumference; WHZ, weight-for-height Z-score; GAM, global acute malnutrition; MAM, moderate acute malnutrition; SAM, severe acute malnutrition.
Table 2 Case definitions of acute malnutrition used in the present study
GAM by WHZ WHZ* , 22 or oedema GAM by MUAC MUAC , 125 mm or oedema MAM by WHZ 23 # WHZ* , 22 without oedema
MAM by MUAC 115 mm # MUAC , 125 mm without oedema SAM by WHZ WHZ* , 23 or oedema
SAM by MUAC MUAC , 115 mm or oedema
GAM, global acute malnutrition; WHZ, weight-for-height Z-score; MUAC, mid-upper arm circumference; MAM, moderate acute malnutrition; SAM, severe acute malnutrition.
the case definition of SAM or MAM and calculating the ratio of this number to the total population.
Estimation of prevalence with classical and PROBIT methods in the simulated surveys
First, we calculated the prevalence using the classical method, by counting the number of children with the case definition of SAM or MAM in the simulated survey and calculating the ratio of this number to the total sample. Second, we estimated the prevalence with a PROBIT method. We used three different PROBIT approaches. The first approach was based on the approach recommended by WHO that involved the sample median WHZ and
assumingSD51(8). The second approach used the sample
mean andSD. The last approach involved the sample mean
and SDcalculated from data transformed towards normal,
as explained below. Prevalence estimates for all three approaches using the PROBIT function were looked at as the cumulative probability of WHZ,22 (GAM), WHZ , 23 (SAM) with and without oedema, and 23 # WHZ , 22
(MAM). The approach using median and SD51 was not
applicable to MUAC because the assumption thatSD51 is
only applicable to WHZ which is assumed to follow the standard normal distribution. The two other approaches of the PROBIT function were used to calculate prevalence estimates as the cumulative probability of MUAC , 125 mm (GAM), MUAC , 115 mm (SAM) with and without oedema and 115 mm # MUAC , 125 mm (MAM).
Investigating normality of distributions
We investigated the normality of distributions of anthro-pometric indices in the simulated surveys using the Shapiro–Wilk test(12). If there was evidence of non-normality (i.e. P , 0?05 for the Shapiro–Wilk test) then data were transformed towards normality using a power transfor-mation with the transforming power found using the
Box–Cox method(13).
Investigation of bias and precision
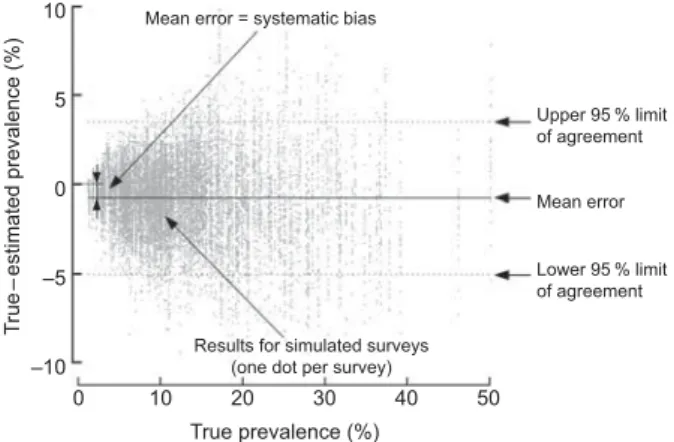
Bias was investigated for the PROBIT method by the estimation of mean error (true prevalence minus esti-mated prevalence). Figure 1 shows an example of the plot of true prevalence against the difference between true and estimated prevalence for the PROBIT method. Figure 1 involves GAM prevalence by MUAC using PROBIT with transformed data with a sample size of 250 created using twenty replicates (a small number of replicates was used for illustrative purposes). Precision was investigated by
the 95 % limits of agreement (mean (error) 6 1?96 3SD
(error))(14). For all methods, the half width of the 95 % limits of agreement was calculated for different sample sizes based on the 150 simulated surveys. The analyses were also performed excluding children with oedema as we suspected that oedema might bias WHZ upwards, leading to downwardly biased estimates of prevalence.
Results Bias
Biases are shown for the three PROBIT methods for GAM, MAM and SAM defined by WHZ in Table 3. They indicate
that the methods using mean andSDof non-transformed
and transformed data are similar, with the method using
median and SD51 inferior for both GAM and SAM but
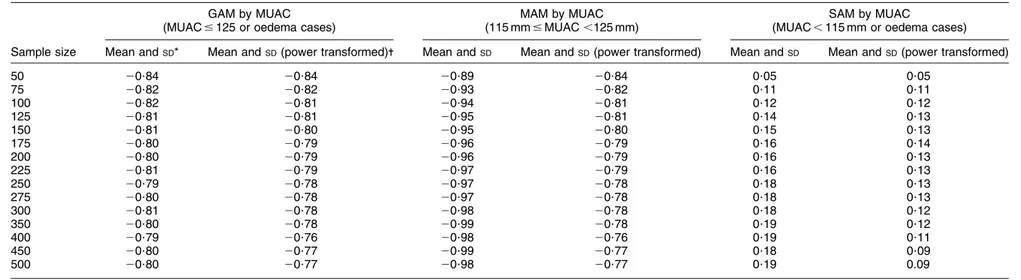
slightly better for MAM. Biases for the two PROBIT methods for GAM, MAM and SAM defined by MUAC again showed similarity between the methods using mean and
SD of transformed and non-transformed data (Table 4).
The biases for the classical approach are not shown since the classical method is known to be generally unbiased and the results of the simulations showed that any ‘bias’ was very close to zero and evenly distributed around zero. Results without oedema are not shown since excluding oedema in the analysis did not substantially change the results.
Precision
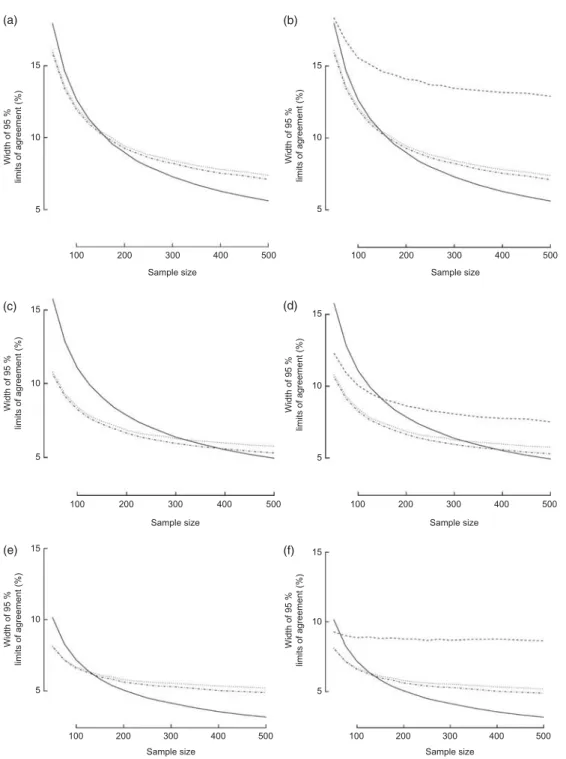
Figure 2 shows precision for the classical method and three PROBIT methods for GAM, MAM and SAM using WHZ and the classical and two PROBIT methods for GAM, MAM and SAM using MUAC. The precision
of the PROBIT methods (using the mean and SD of the
survey with transformed and non-transformed data) is slightly better than for the classical method for sample sizes n , 150 for GAM and SAM for both MUAC and WHZ. However, the precision of the PROBIT method
(using the mean andSD of the survey with transformed
and non-transformed data) is better for MAM for sample sizes n , 300 for both MUAC and WHZ. The method
using median and SD51 is generally inferior to the
classical method except for small sample sizes for MAM. Results without oedema are not shown since excluding oedema in the analysis did not substantially change the results.
T rue – estimated prevalence (%) 10 5 0 –5 –10
Results for simulated surveys (one dot per survey)
True prevalence (%) Upper 95 % limit of agreement Mean error Lower 95 % limit of agreement 0 10 20 30 40 50
Mean error = systematic bias
Fig. 1 Example of the plot of true prevalence v. the difference between true and estimated prevalence for the PROBIT method (global acute malnutrition prevalence by mid-upper arm circumference)
860 NM Dale et al.
https:/www.cambridge.org/core/terms. https://doi.org/10.1017/S1368980012003345
Table 3 Bias (true prevalence minus calculated prevalence, in percentage points) for acute malnutrition according to weight-for-height in simulated surveys
GAM by WHZ MAM by WHZ SAM by WHZ
(WHZ , 22 or oedema cases) (23 # WHZ , 22 without oedema) (WHZ , 23 or oedema cases)
Sample size
Median and
SD51*
Mean
andSD
-Mean andSD(power
transformed)-
-Median
andSD51
Mean
andSD
Mean andSD(power
transformed)
Median
andSD51
Mean
andSD
Mean andSD(power
transformed) 50 2.23 20?10 20?01 0?29 20?84 20?69 1?95 0?73 0?68 75 2?34 20?11 20?04 0?35 20?89 20?74 1?99 0?78 0?70 100 2?42 20?07 20?02 0?40 20?88 20?74 2?02 0?81 0?71 125 2?45 20?07 20?04 0?41 20?91 20?76 2?04 0?83 0?72 150 2?47 20?08 20?05 0?42 20?92 20?78 2?05 0?84 0?72 175 2?50 20?05 20?03 0?46 20?89 20?75 2?04 0?84 0?71 200 2?50 20?07 20?07 0?45 20?92 20?79 2?05 0?84 0?71 225 2?52 20?07 20?07 0?47 20?91 20?78 2?06 0?84 0?71 250 2?50 20?07 20?08 0?46 20?93 20?79 2?05 0?85 0?71 275 2?54 20?07 20?08 0?47 20?93 20?79 2?07 0?86 0?71 300 2?53 20?06 20?08 0?47 20?93 20?79 2?07 0?86 0?70 350 2?56 20?07 20?09 0?49 20?93 20?78 2?07 0?86 0?69 400 2?55 20?06 20?09 0?48 20?94 20?80 2?08 0?87 0?70 450 2?55 20?06 20?10 0?48 20?94 20?79 2?07 0?87 0?69 500 2?57 20?06 20?10 0?50 20?94 20?79 2?08 0?87 0.69
GAM, global acute malnutrition; MAM, moderate acute malnutrition; SAM, severe acute malnutrition; WHZ, weight-for-height Z-score. *Sample median WHZ and assumingSD51.
-Sample mean WHZ andSD.
--Sample mean WHZ andSDwith data transformed towards normal.
Table 4 Bias (true prevalence minus calculated prevalence, in percentage points) for acute malnutrition according to mid-upper arm circumference in simulated surveys
GAM by MUAC MAM by MUAC SAM by MUAC
(MUAC # 125 or oedema cases) (115 mm # MUAC ,125 mm) (MUAC , 115 mm or oedema cases)
Sample size Mean andSD* Mean andSD(power transformed)- Mean andSD Mean andSD(power transformed) Mean andSD Mean andSD(power transformed)
50 20?84 20?84 20?89 20?84 0?05 0?05 75 20?82 20?82 20?93 20?82 0?11 0?11 100 20?82 20?81 20?94 20?81 0?12 0?12 125 20?81 20?81 20?95 20?81 0?14 0?13 150 20?81 20?80 20?95 20?80 0?15 0?13 175 20?80 20?79 20?96 20?79 0?16 0?14 200 20?80 20?79 20?96 20?79 0?16 0?13 225 20?81 20?79 20?97 20?79 0?16 0?13 250 20?79 20?78 20?97 20?78 0?18 0?13 275 20?80 20?78 20?97 20?78 0?18 0?13 300 20?81 20?78 20?98 20?78 0?18 0?12 350 20?80 20?78 20?99 20?78 0?19 0?12 400 20?79 20?76 20?98 20?76 0?19 0?11 450 20?80 20?77 20?99 20?77 0?18 0?09 500 20?80 20?77 20?98 20?77 0?19 0.09
GAM, global acute malnutrition; MAM, moderate acute malnutrition; SAM, severe acute malnutrition; MUAC, mid-upper arm circumference. *Sample mean MUAC andSD.
Malnutrition prevalence estimates with PROBIT 861 . https://doi.org/10.1017/S1368980012003345 https:/www.cambridge.org/core
. University of Basel Library
, on
11 Jul 2017 at 16:17:27
Discussion
The main limitation of the present study was that it was impractical to know the true prevalence of a large number of populations and to perform repeated surveys to estimate bias and precision of different estimators. The only feasible approach to testing the validity of the PROBIT approach was through simulation of surveys.
The study confirms that the PROBIT method can esti-mate prevalence of GAM and MAM using WHZ or MUAC. The PROBIT method provides an estimate of prevalence that is proportional to the true prevalence with a small bias that can be corrected for by simple subtraction of a small value found of bias in Table 2. The study shows, however, that the PROBIT method is inferior to the clas-sical method for estimating the prevalence for SAM by
Width of 95 % limits of agreement (%) Width of 95 % limits of agreement (%) 15 10 5 15 10 5 100 200 300 400 500 Sample size 100 200 300 400 500 Sample size Width of 95 % limits of agreement (%) Width of 95 % limits of agreement (%) 15 10 5 15 10 5 100 200 300 400 500 Sample size 100 200 300 400 500 Sample size Width of 95 % limits of agreement (%) Width of 95 % limits of agreement (%) 15 10 5 15 10 5 100 200 300 400 500 Sample size 100 200 300 400 500 Sample size (a) (b) (c) (d) (e) (f)
Fig. 2 Observed precision for global acute malnutrition (GAM), moderate acute malnutrition (MAM) and severe acute malnutrition (SAM) calculated by the classical method (——) or the PROBIT approaches (- - -, median andSD 51; ? ? ?, observed mean andSD; – ? – ? –, transformed data) using mid-upper arm circumference (MUAC) or weight-for-height Z-score (WHZ), according to sample size in simulated surveys: (a) GAM by MUAC; (b) GAM by WHZ; (c) MAM by MUAC; (d) MAM by WHZ; (e) SAM by MUAC; (f) SAM by WHZ
862 NM Dale et al.
https:/www.cambridge.org/core/terms. https://doi.org/10.1017/S1368980012003345
WHZ or MUAC at sample sizes n . 150, although it does seem suitable for small sample sizes which may be useful for applications such as surveillance. These results do not seem to be influenced by a bias resulting from the inclusion of cases with bilateral pitting oedema since the results are similar with or without oedema in the analysis. For WHZ, the PROBIT method of mean with observed
SD of the data shows an improvement compared with
usingSD51. This suggests that when choosing to use the
PROBIT method, it would be useful to use the observed
SD to calculate prevalence. Checking for normality and,
if necessary, transforming data towards normality may further improve the estimation.
An explanation for the PROBIT method not estimating the prevalence of SAM as well as the classical method may be that perhaps the tail of the distribution of WHZ or MUAC does not follow the normal distribution and relates to chil-dren who may have other health problems in addition to primary malnutrition. One could argue that SAM children do not predictably follow the general pattern due to fact that they are often infected or suffer from a family crisis which makes them shift in an unpredictable way.
In conclusion, the PROBIT method could be useful in sentinel-site surveillance systems using repeated small sample surveys or small spatially stratified samples so as to allow the course mapping of prevalence. The classical method should be preferred when estimating prevalence with larger samples. Acknowledgements
This work was supported by the Health and Nutrition Tracking Service. All co-authors have seen and agree with the contents of the manuscript and there is no conflict of interest to report. N.M.D. contributed to the conception and design, analysis and interpretation of data and drafting of the manuscript. M.M. participated in the design of the study, performed the data analysis and revised the manuscript critically for important intellectual content. C.P. and A.B. participated in the design of the study, analysis and interpretation of the data and revised the manuscript critically for important intellectual content. References
1. World Food Programme & Centers for Disease Control and Prevention (2005) A Manual: Measuring and Interpreting
Malnutrition and Mortality. http://www.unscn.org/ layout/modules/resources/files/A_Manual_Measuring_and_ Interpreting_Malnutrition_and_Mortality.pdf (accessed September 2011).
2. Nutrition Cluster (2008) A Toolkit for Addressing Nutrition in Emergency Situations. http://oneresponse.info/Global Clusters/Nutrition/Documents/Global_Nutrition_Cluster_ Nutrition_Emergencies_Toolkit_June_2008.pdf (accessed September 2011).
3. World Health Organization (2006) WHO Child Growth Standards: Methods and development: Length/height-for-age, weight-for-Length/height-for-age, weight-for-length, weight-for-height and body mass index-for-age. http://www.who.int/child growth/publications/technical_report_pub/en/index.html (accessed October 2011).
4. World Health Organization (2000) The management of nutrition in major emergencies. http://whqlibdoc.who.int/ publications/2000/9241545208.pdf (accessed September 2011).
5. Me´decins Sans Frontie`res (2006) MSF Nutrition Guidelines, 2nd ed. London: The MSF-Holland Foundation.
6. Standardized Monitoring & Assessment of Relief & Transi-tions (2006) Measuring Mortality, Nutritional Status, and Food Security in Crisis Situations: SMART METHODOLOGY. http://www.smartindicators.org/SMART_Methodology_ 08-07-2006.pdf (accessed September 2011).
7. Spiegal P, Salama P, Maloney S et al. (2004) Quality of malnutrition assessment surveys conducted during Famine in Ethiopia. JAMA 292, 613–618.
8. World Health Organization (1995) Physical Status: The Use and Interpretation of Anthropometry. Report of a WHO Expert Committee. WHO Technical Report Series no. 85. Geneva: WHO; available at http://whqlibdoc.who.int/trs/ WHO_TRS_854.pdf
9. Golden MHN & Grellety Y (not dated) Population nutritional status during famine. http://www.smartindicators. org/docs/mg_surveywhzdis.doc (accessed October 2011). 10. World Health Organization & UNICEF (2009) WHO child
growth standards and the identification of severe acute malnutrition in infants and children: A Joint Statement by the World Health Organization and the United Nations Children’s Fund. http://www.who.int/nutrition/publications/ severemalnutrition/9789241598163/en/index.html (accessed October 2011).
11. World Health Organization (2010) WHO, UNICEF, WFP and UNHCR Consultation on the Programmatic Aspects of the Management of Moderate Acute Malnutrition in Children under five years of age, 24–26 February 2010, Geneva, Switzerland. Geneva: WHO; available at http://www. who.int/nutrition/topics/moderatemalnutrition_consultation_ programmaticaspects_MM_report.pdf
12. Armitage P & Berry G (1994) Statistical Methods in Medical Research, 3rd ed. Oxford: Blackwell Science.
13. Box GEP & Cox DR (1964) An analysis of transformations. J R Stat Soc Ser B 26, 211–246.
14. Bland JM & Altman DG (1986) Statistical methods for assessing agreement between two methods of clinical measurement. Lancet i, 307–310.