Rest-Activity Cycle Disturbances in the Acute Phase of Moderate to
Severe Traumatic Brain Injury
Catherine Duclos BA1-2, Marie Dumont PhD1-2, Hélène Blais BA1, Jean Paquet PhD1, Elyse
Laflamme BSc.3, Louis de Beaumont PhD1,4, Catherine Wiseman-Hakes PhD1-2, David K. Menon
MD, PhD5, Francis Bernard MD3,6, Nadia Gosselin PhD1,7
1. Center for Advanced Research in Sleep Medicine, Hôpital du Sacré-Coeur de Montréal, Montréal, Canada 2. Department of Psychiatry, Université de Montréal, Montréal, Canada
3. Traumatology program, Hôpital du Sacré-Coeur de Montréal, Montréal, Canada
4. Department of Psychology, Université du Québec à Trois-Rivières, Trois-Rivières, Canada 5. Division of Anaesthesia, University of Cambridge, Cambridge, United Kingdom
6. Department of Medicine, Université de Montréal, Montréal, Canada 7. Department of Psychology, Université de Montréal, Montréal, Canada
Revised version submitted to: Neurorehabilitation and Neural Repair Date: 27 July 2013
Short Title: Rest-activity cycles after TBI Address for correspondence:
Nadia Gosselin, Ph.D.
Center for Advanced Research in Sleep Medicine Hôpital du Sacré-Cœur de Montréal
5400 boul. Gouin Ouest, local E-0330 Montréal, Québec H4J 1C5 Canada Tel: 514-338-2222 ext. 7717 Fax: 514-338-3893 [email protected] Word count: 4037
Number of figures & tables: 6
Number of supplementary figures: 3 (belong together) Number of supplementary tables: 1
ABSTRACT
Background Sleep-wake disturbances are among the most persistent sequelae after traumatic brain injury (TBI) and probably arise during the hospital stay following TBI. These disturbances are characterized by difficulties sleeping at night and staying awake during the day. Objective The aim of the present study was to document rest-activity cycle consolidation in acute
moderate/severe TBI using actigraphy, and to assess its association with injury severity and outcome. Methods Sixteen hospitalized patients (27.1±11.3 years) with moderate/severe TBI wore actigraphs for 10 days, starting in the intensive care unit when continuous sedation was discontinued and patients had reached medical stability. Activity counts were summed for
daytime (7:00-21:59) and nighttime periods (22:00-6:59). Ratio of daytime period activity to total 24-h activity was used to quantify rest-activity cycle consolidation. An analysis of variance was carried out to characterize the evolution of the daytime activity ratio over the recording period. Results Rest-activity cycle was consolidated only 46.6% of all days, however a significant linear trend of improvement was observed over time. TBI severity, intensive care unit and hospital lengths of stay were associated with poorer rest-activity cycle consolidation and evolution. Patients with more rapid return to consolidated rest-activity cycle were more likely to have cleared post-traumatic amnesia and to have lower disability at hospital discharge. Conclusions Patients with acute moderate/severe TBI had an altered rest-activity cycle, probably reflecting severe fragmentation of sleep and wake episodes, which globally improved over time. A faster return to rest-activity cycle consolidation may predict enhanced brain recovery.
Introduction
Sleep disturbances are among the most persistent and disabling sequelae after traumatic brain injury (TBI), reported by over 50% of patients1-6 and are known to compromise recovery in
chronic TBI.7 These disturbances are characterized by difficulties sleeping at night and staying
awake during the day. 2,8-11 Although sleep-wake disturbances are common in TBI patients, little
is known about their origin and evolution. They probably appear in the first days after injury, when patients are hospitalized in the intensive care unit (ICU). A recent study carried out in the post-acute phase of TBI reported that mild to severe sleep-wake disturbances were present among 84% of patients upon rehabilitation admission, and persisted for 66% of patients one-month post-injury.12 Although no sleep studies have been performed among TBI patients in the ICU, previous
ICU studies in non-TBI patients have shown that both sleep-wake cycle and sleep architecture are highly disturbed,13-14with a large proportion of sleep occurring during the day and up to 96% of
total sleep spent in the lighter, less restorative sleep stages (stages 1 and 2).15-16
Sleep disturbances in the ICU are likely to have the same deleterious effects as chronic sleep restriction in healthy subjects on cognition, blood pressure,17 glucose metabolism,18
activation of the hypothalamic-pituitary-adrenal axis, and inflammatory response.19- 21 The lack of
deep sleep can have severe consequences during early rehabilitation of patients with TBI by slowing processes of physical recovery and exacerbating cognitive and neurobehavioral impairments, especially hippocampal-dependent memory processes.22 Thus, there is a critical
need to understand the nature and evolution of sleep disturbances in acute moderate to severe TBI, from the ICU to hospitalization in regular wards.
Polysomnography is the gold standard for measuring sleep architecture; however, it does not enable long-term measurement and is poorly tolerated by highly monitored or confused
patients. An interesting alternative is wrist actigraphy, a valuable instrument to measure long-term rest-activity cycle in a clinical setting. In healthy subjects, rest-activity cycle has been strongly correlated with the sleep-wake cycle, and is often used as an indirect measure of the sleep-wake cycle.23 Indeed, because of its low invasiveness and cost, actigraphy has been
successfully used among different clinical populations.24-27
The aim of the present study was to document rest-activity cycle consolidation during the acute phase of moderate and severe TBI using actigraphy recordings. Moreover, this study aimed to explore the clinical characteristics and outcome measures correlated with prolonged absence of rest-activity cycle consolidation. We hypothesized that patients would exhibit a severely
disturbed rest-activity cycle that would improve over time. Our second hypothesis was that poorer rest-activity cycle consolidation would be associated with more severe TBI and poorer outcome at hospital discharge.
Methods
Subjects
The study comprised 16 hospitalized patients (mean age 27.1±11.3 years) with moderate or severe TBI recruited from Hôpital du Sacré-Coeur de Montréal, a level 1 trauma centre (see Table 1 for patient characteristics). The study was approved by the hospital ethics committee. Consent for participation was obtained from patients’ families. Patients who eventually became cognitively able to provide informed consent for themselves were asked to sign a consent form for study protocol to continue.
TBI was defined as an alteration in brain function, or other evidence of brain pathology, caused by an external force.28 TBI severity was assessed upon emergency room admission using
the Glasgow Coma Scale (GCS)29 and was reassessed thirty-minutes later to provide a
post-reanimation index of TBI severity. Patients were included if they had a GCS score of 3-12 upon emergency room admission and had to be hospitalized in ICU. One subject with a GCS score of 14 at emergency room admission was included, as he subsequently suffered elevated intracranial pressure (ICP), rapidly dropped to a GCS of 3 and received a diagnosis of severe TBI.
Patients were excluded if non-fluent in French or English before injury, if they were quadriplegic, had a history of substance abuse, psychiatric or neurological disorders, or had diagnosed sleep disorders. Such information was obtained from patients’ families through psychosocial assessments carried out by the ICU social worker and were confirmed by research assistants. Patients were also excluded for pregnancy, incarceration, homelessness, or if they suffered any damage to both eyes, or the optic nerve (modifying light perception).
Protocol
Clinical variables
Injury severity Length of ICU stay, hospital length of stay, duration of continuous
sedation/analgesia, number of days with elevated ICP (>20mmHg), Marshall30 and Rotterdam31
scores, as well at the Summary Therapy Intensity Level (TIL)32 were documented for each day in
the ICU. Cumulative administered dose of sedative and analgesic medication (lorazepam, midazolam, propofol, morphine, hydromorphones, and fentanyl) in ICU was calculated according to the previously described method.33 Sedative, analgesic, antiepileptic and neuroleptic
medications were also noted for all days of actigraphy recording that took place in the regular units (see Supplementary materials for details).
Cognitive and functional outcome Cognitive and behavioural functions were assessed
daily by occupational therapists using the Rancho Los Amigos (RLA) scale34 and the Galveston
Orientation and Amnesia Test (GOAT).35 Duration of post-traumatic amnesia (PTA) was
calculated from the day the patient reached a GCS score of 9, as suggested in the standard GOAT protocol.35 Emergence from PTA was designated as the first of 2 consecutive days with a GOAT
score ≥76. Since 6 patients were still in PTA at hospital discharge and no PTA duration could be documented for them, no analyses were performed on PTA duration. Rather, patients were divided according to presence or resolution of PTA at discharge. The Disability Rating Scale (DRS)36 score at discharge (last 72-h of hospitalization) was calculated by the occupational
therapist. The DRS is a 29-point scale, for which absence of disability is 0 and extreme vegetative state is 29, commonly used among the moderate-severe TBI population. Actigraphy
Patients wore a wrist actigraph (Actiwatch-2, MiniMitter Philips Healthcare, Andover, MA, USA) on a non-paralyzed arm during hospitalization. The actigraph is a small, watch-like device that contains an accelerometer, which records physical motion in all directions with a sensitivity of 0.05g. Motion is then converted to an electric signal, which is digitally integrated to derive an activity count per 1-minute epochs.
Data was acquired during hospitalization, beginning in ICU for most patients and continuing throughout hospitalization in regular wards. Actigraphy recording began when continuous sedation and analgesia had ceased for at least 24-h. By that stage, patients were no longer intubated and had reached a level of medical stability defined by the absence of elevated ICP, of hemodynamic instability, and of fever or active infections. Moreover, the actigraph was
installed only once patients reached a RLA score >III, indicative of a more apparent physical reactivity to internal and external stimuli.
Approximately every 3 days, data were uploaded into dedicated software (Actiware 5.0). Removal of the actigraph for data uploads took on average 7.9±6.2 minutes, during which time wrist activity was not recorded.
Data analyses
Due to the absence of a consolidated 24-h rest-activity cycle on most recording days, the cosinor analysis, which is typically used to quantify the rest-activity cycle,37 would have led to
non-valid results. In the present study, rest-activity cycle consolidation was thus estimated with the ratio of daytime activity to total 24-h activity. For each 24-h day and for each subject, the activity counts were summed separately for daytime (07:00-21:59) and nighttime (22:00-6:59) periods. Nighttime was defined according to the schedule of the hospital unit, and was
characterized by lower levels of activity and light. Total 24-h activity (07:00-06:59) was the sum of the daytime and nighttime periods. Each 1-min epoch during which no recording took place (due to actigraph removal for data uploads) was attributed the average activity count of the period (daytime or night-time) during which the actigraph was removed. The percentage of total 24-h activity occurring in the daytime was calculated to obtain the daytime activity ratio [daytime activity ratio = (daytime activity/24-h activity) x100]. A ratio of 50% indicated a level of activity evenly distributed across daytime and nighttime periods, whereas a ratio of 100% indicated that all activity occurred during daytime. According to our preliminary analyses, a daytime activity ratio of 80% was chosen to designate an adequate consolidation of the rest-activity cycle,
synchronised to the day-night cycle. Five variables were used to evaluate the state and evolution of rest-activity cycle consolidation: mean daytime activity ratio for the total recording period,
daytime activity ratio averaged over the first and last 48-h of recording, percentage of
improvement between first and last 48-h of recording, and number of days with daytime activity ratio >80%.
Actiware 5.0 automatically scored a minute of recording as “moving” according to a threshold value of >10 activity counts per epoch. The quantity of minutes of moving was then calculated for each day of recording, for each patient. Minutes during which the actigraph was removed for data uploads were scored as “moving”, since the actigraph was removed only when subjects were not resting.
Statistical analyses
A within-subject ANOVA with Time as the repeated factor was carried out to compare the daytime activity ratio over the 10 days of recording. This analysis was only carried out on
patients who had 10 days of recording. All other analyses included all 16 patients. Paired t-tests on daytime activity ratio were also performed to compare the first and last 48-h of actigraphy recording. To test our second hypothesis, a series of Pearson correlations were conducted between actigraphic variables and each variable of injury severity and outcome. Sub-groups of patients with and without PTA at hospital discharge were compared using independent samples t-tests. Exploratory testing of each sub-group’s improvement of rest-activity cycle consolidation was performed using an ANOVA with one repeated measure (time). If not otherwise mentioned, the data are presented as mean ± standard deviation., Significance was set at p<0.05.
Results
Figures 1 and A show the actigraphy recordings of all patients. Patients began wearing the actigraph 18±13.3 days post-injury and a delay of 13.9±13 days was observed between the last
day of actigraphy recording and hospital discharge. Details on patients’ clinical characteristics and actigraphy recordings are presented in the Results section of Supplementary materials.
Consolidation of the rest-activity cycle in acute TBI
When all patients (n=16) and all days of recording (n=148) were considered, daytime activity represented 75.1±13.7% of total activity. Overall, the criteria of >80% daytime activity, representing a consolidation of the rest-activity cycle, was met only in 69 (46.6%) of all days of recording. Cycle consolidation was present during only 18 of 63 days (28.6%) in ICU, but increased to 52 of 85 days (61.1%) in regular wards. In the 3 patients who recovered rapidly and had less than 10 days of actigraphic recording, most days (93.3%) showed >80% daytime activity, suggesting that the >80% criteria was valid, although arbitrary.
Figure 1 shows the actigraphy recordings of four patients, which are an adequate representation of all patients tested. Two general patterns of rest-activity cycle were observed. The first pattern, represented by patients #2 and 12, was observed in 8 patients and illustrates a continuous absence of rest-activity cycle consolidation over all days of recording. Several of these patients also had only brief periods of consolidated rest over the 24-h, as shown by the brief periods during which the actigraph was not active. The second pattern, illustrated by the
actigrams of patients #3 and 10, was observed in 8 patients and depicts an improvement in the consolidation of the rest-activity cycle over the 10 days or recording.
During the first 48-h of actigraphy, only 4 patients (25%) showed a consolidated rest-activity cycle, however this evolved to being present in 10 patients (62.5%) during the last 48-h of recording. Furthermore, only 3 patients (18.8%) reached a daytime activity ratio >80% while in ICU. Average daytime activity ratio of the first 48-h of recording was 70.8±10.1%, increasing to 79.1±13.7% for the last 48-h, thus showing a significant improvement of 9.3±11.3% between
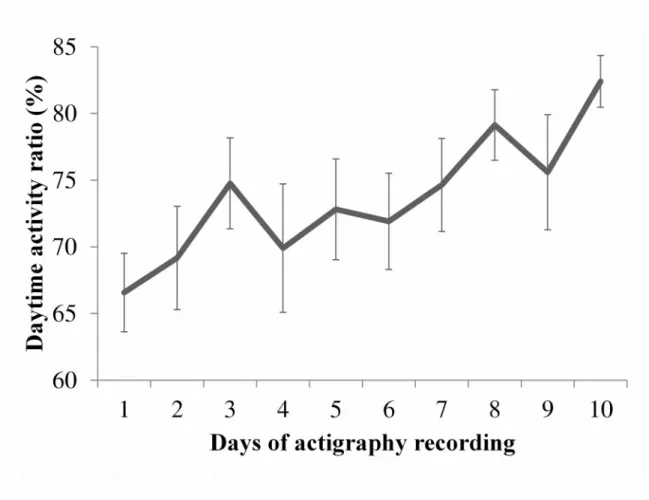
the beginning and end of recording (t(30)=-2.1, p<0.05). Of the 12 patients with 10 days of actigraphy, a significant linear trend of improvement was observed from day 1 to day 10
(F(1,11)=11.92, p<0.01, see Figure 2).When patients were considered individually, improvement from the first to last 48-h of actigraphy was quite diverse, ranging from -22.39% to 26.97%.
On average, patients had 827.2±233.2 min scored “moving” per 24-h (57.4% per day) during the first 48-h of recording, and 845.8±166.0 min per 24-h (58.7% per day) during the last 48-h of recording. The percentage of time moving per 24 h is provided for each patient and for each day of recording in Supplementary Table 1.
Association between rest-activity cycle and clinical variables
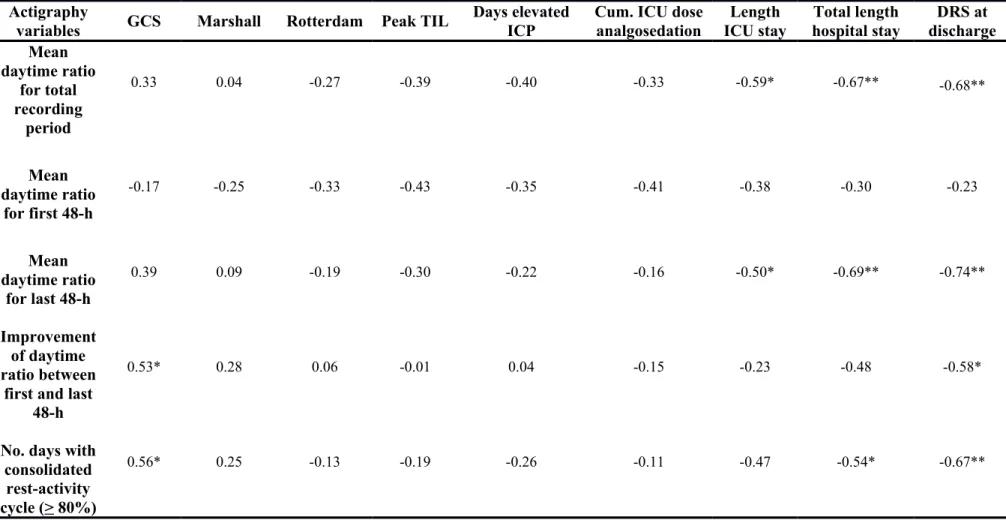
Table 2 presents the Pearson correlation coefficients showing the associations between rest-activity variables and clinical variables. Better or improving rest-activity cycle consolidation was associated with higher GCS at admission, a shorter ICU stay, and a shorter hospital stay. The daytime activity ratio of the first 48-h of actigraphy was not related to any variable of injury severity or outcome. The Marshall and Rotterdam scores, peak TIL score, number of days of elevated ICP, and cumulative ICU dose of analgosedation were not significantly associated with any rest-activity variable.
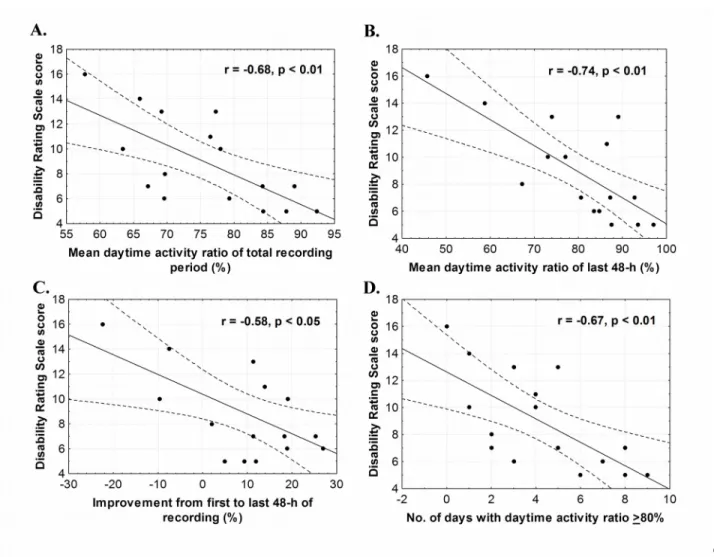
Better rest-activity cycle consolidation was associated with lower disability at discharge (Figure 3). More specifically, a higher daytime activity ratio for the total recording period, a higher daytime activity ratio in the last 48-h of recording, a higher percentage of improvement from the first to last 48-h, and a higher number of days with rest-activity cycle consolidation were associated with lower DRS scores (r values ranging from -0.53 to -0.69, p’s<0.05).
Table 3 shows the actigraphy results of patient sub-groups divided according to presence or absence of PTA at hospital discharge. Patients no longer in PTA at discharge had significantly
higher daytime activity ratio over the total recording period, higher daytime activity ratio in the last 48-h of recording, greater improvement between the first and last 48-h of recording, and more days of consolidated rest-activity cycle (t and p values detailed in Table 3). Moreover, the only actigraphy measure that did not differ between groups was the daytime activity ratio of the first 48-h of recording. Therefore, the 2 sub-groups were very similar during the first 48-h of recording, however the patients no longer in PTA at discharge showed significantly greater improvement over time. The ANOVA performed over the 10 days of recording confirmed a significant evolution of consolidation of the rest-activity cycle in patients no longer in PTA at discharge [F(1,6)=8.85, p<0.05]; this evolution was not significant in patients still in PTA at discharge [F(1,4)=2.61, p=0.18]. When compared on variables of injury severity and outcome, patients still in PTA at discharge had a longer ICU stay (33.5±6.9 vs. 17.9±16.2 days, t(14)=2.2, p<0.05), a longer hospital stay (61.7±13.8 vs. 34.1±17.7 days, t(14)=3.7, p<0.01) and a higher DRS score at discharge (12.4±2.5 vs. 6.7±1.8, t(13)=5, p<0.001).
Discussion
Poor circadian rest-activity cycle consolidation in acute TBI
Our aim was to characterize the quality and evolution of the rest-activity cycle in acute moderate to severe TBI. We found that rest-activity cycle consolidation was predominantly absent during the first days of actigraphy recording, but globally improved over time during their hospital stay. In fact, when a daytime activity ratio >80% was used as a threshold for adequate rest-activity cycle consolidation, consolidation was observed for 28.1% of days in the first 48h, while this percentage increased to 68.8% the last 48h of recording. Two distinct patterns of evolution of the activity cycle were observed: 50% of patients showed an absence of
rest-activity cycle consolidation throughout the recording period, while the other 50% had reached a daytime activity ratio >80% by the last 48-h of recording.
This absence of rest-activity cycle consolidation is likely associated with fragmentation of both sleep and wake episodes. The number of minutes moving was similar during the first and last 48-h of recording and covered nearly 60% of the day. This observation suggests that the absence of consolidation of the rest-activity cycle was not caused by constant rest, but rather reflects the dispersion of activity bouts all over the 24-h. Since actigraphy has not been validated with polysomnography in this bed-ridden population, it cannot be concluded that the absence of activity represents sleep. However, the presence of activity over the 24-h shows that the rest episodes were highly fragmented by intervening activity bouts, thereby possibly preventing the occurrence of any deep sleep episodes of significant duration.
Association between consolidation of the rest-activity cycle, injury severity and recovery This study revealed significant associations between TBI severity and the rest-activity cycle. More precisely, less severe TBI was associated with greater improvement between the first and last 48-h of activity recording, and with more days of consolidated rest-activity cycle. Shorter lengths of ICU and hospital stay were associated with a higher average daytime activity ratio over all days of recording, and with a higher average daytime activity ratio in the last 48-h of
recording. A shorter duration of total hospital stay was also associated with more days of consolidation of the rest-activity cycle. Although these results will need to be confirmed in a larger sample, they do point to the role of TBI in the persistence of rest-activity cycle
disturbances in acute care.
Our study also revealed significant associations between the rest-activity cycle and outcome at hospital discharge. First, we found that patients no longer in PTA at discharge had
better rest-activity consolidation over the total recording period and during the last 48-h of recording, had greater improvement of rest-activity consolidation between the first and last 48-h of recording, and had more days of consolidated rest-activity cycle. Moreover, patients with a more rapid return to a consolidated rest-activity cycle over the 10 days of actigraphy were more likely to clear PTA before hospital discharge. Similar results were also found for disability severity, where patients with better rest-activity cycle consolidation and with greater
improvement of cycle consolidation showed lower DRS scores at discharge. These associations between rest-activity cycle consolidation and outcome at hospital discharge were observed even if there was an average delay of 13.9 ± 13 days between the last day of recording and hospital discharge, suggesting that the degree of rest-activity cycle consolidation is associated with cerebral recovery and may predict short-term outcome in acute TBI.
An association between sleep and PTA has already been reported among 14 TBI patients in a rehabilitation setting, where patients who had cleared PTA before admission to the
rehabilitation centre showed better sleep efficiency, as measured with wrist actigraphy, compared to patients with ongoing PTA.11 These results point to a close link between sleep consolidation
and cognitive functioning, but it is currently difficult to establish a causal relationship in the context of TBI. In fact, considering that sleep has a crucial role in memory consolidation, learning, cerebral plasticity, and neurogenesis,38-39 sleep fragmentation may, probably by
preventing the apparition of deep sleep,22 impede PTA resolution in patients with TBI. However,
it is also possible that structural brain damage simultaneously affects memory and sleep, either through dissociated or common pathways. In the latter case, PTA and rest-activity cycle consolidation, or increased sleep efficiency, may occur simultaneously when brain recovers sufficiently to allow both sleep consolidation and PTA resolution.
Possible causes of the lack of consolidation of the rest-activity cycle
The rest-activity cycle is the most easily observed manifestation of endogenous circadian rhythms.40 The main circadian biological clock, located in the hypothalamus, generates an
oscillation of about 24-h that is normally synchronized to the environmental 24-h day, mainly by exposure to the light-dark cycle, but also by regular timing of social contacts, food intake, etc. In humans, the endogenous circadian clock synchronizes physiological, cognitive and behavioural functions such that those associated with activity happen in the daytime while those associated with rest and sleep occur during the night. Circadian disruption occurs when the main biological clock is not synchronized to the 24-h day and/or when it produces a circadian signal too weak to entrain properly the peripheral clocks located in other regions of the brain and body. The first manifestation of circadian disruption is a decreased consolidation and abnormal timing of the rest-activity cycle, and sleep-wake disorders.41 The ICU is devoid of regular day-night
environmental cues, and the ICU stay is associated with severe medical conditions, analgesia and sedation, all known to affect the temporal structure of circadian rhythms and induce circadian desynchrony.42-43 The fact that there was no correlation between the number of minutes moving
per 24-h and the daytime activity ratio in our patients suggests that the daytime activity ratio was not affected by the quantity of activity, but rather measures the circadian organization of activity and rest periods. Although a low daytime activity ratio could also signal a poor timing of
consolidated sleep, such as sleep that occurs with a phase advance (e.g., 19:00 to 3:00) or phase delay (e.g., 3:00 to 11:00), visual inspection of actigraphy data suggests that it was not the case of our patients. When patients had a low daytime activity ratio, they rather had fragmented rest and activity dispersed over 24-h. The concurrent measure of robust circadian markers would be
necessary to assess the contribution of circadian disruption to the decreased consolidation of the rest-activity cycle in TBI patients.
TBI itself could be responsible, at least in part, for altered circadian rest-activity rhythm. In a previous study, ICU patients with neurological injury showed more severe circadian rhythm disturbances than patients without neurological injury.44 Due to our small sample size, it is
currently not possible to understand the role of specific TBI characteristics, such as location of brain lesions, however we can hypothesize that patients with brain injury in hypothalamic regions, for example, will be at greater risk of circadian rhythm disturbances.
Actigraphy in a hospital setting
It has been shown that actigraphy underestimates wakefulness,45-47 particularly when
subjects lie immobile in bed in a nonsleeping state,48 and especially among a critically ill
population.49 Therefore, the already short rest episodes observed on actigraphy recordings
probably overestimates the quantity of sleep our patients actually experienced.
A daytime activity ratio >80% was used to designate the presence of rest-activity cycle consolidation. Since subjects frequently reached a ratio above 85-90% in the last days of recording, 80% was a conservative threshold to denote an acceptable rest-activity rhythm. The significant association of this threshold of consolidation with GCS and outcome supports its usefulness as a measure of rhythmicity within this patient population and setting.
Study limitations
Although the rest-activity cycle has been strongly correlated with the sleep-wake cycle among healthy subjects,23 such an association has not been formally validated among subjects
hospitalized in critical care. Due to its small number of patients, our study serves as an
in the acute phase of moderate-severe TBI. Therefore, the use of actigraphy and the parameters chosen to analyse the data collected during the acute phase of the moderate-severe TBI
population will need to be formally validated in a larger cohort and compared with concurrent polysomnography recordings.
Conclusions
This study is the first initiative aiming to understand the nature and evolution of sleep and circadian rhythm disturbances in acute moderate to severe TBI. Despite the difficulties
encountered in a hospital setting, our study demonstrates that is it possible to effectively use actigraphy to assess the rest-activity cycle, even in acute care. Although a larger sample will be needed to perform a formal validation, the associations found between the rest-activity cycle and variables of outcome at hospital discharge suggest that actigraphy could become an important clinical tool for the monitoring and prognosis of TBI patients.
Our data revealed severe disturbances of the rest-activity cycle in the acute phase of moderate-severe TBI. Such disturbances had not previously been systematically documented and quantified for an extended period of time among this population. The lack of consolidation of the rest-activity cycle was associated with rest episodes of very short duration, not compatible with the occurrence of the deepest stages of sleep. Considering the role of sleep in cerebral plasticity and neurogenesis, sleep disturbances in acute TBI may impede short and long-term cognitive and neuronal recovery in this population. Efforts to restore circadian synchrony while patients are hospitalized may help to prevent the development of chronic sleep and wake disturbances and to optimise recovery.
Funding Research supported by the Canadian Institutes of Health Research (CIHR), by the Fonds pour la recherche du Québec – Santé (FRQS), by the University of Montreal’s Department of Psychiatry (studentship to C.D.), and by the J.A. De Sève foundation (studentship to C.D.) Competing interests None.
Ethics approval Ethics approval was provided by the Ethics Committee of Hôpital du Sacré-Coeur de Montréal.
Provenance and peer review Not commissioned; externally peer reviewed
Acknowledgments: The authors would like to acknowledge Pierre-Olivier Gaudreault, Katia Gagnon, and Andrée-Ann Baril for their contribution to the monitoring of patients during actigraphy recordings.
REFERENCES
1. Gosselin N, Lassonde M, Petit D, et al. Sleep following sport-related concussions. Sleep
Med. 2009;10:35-46.
2. Parcell DL, Ponsford JL, Rajaratnam SM, Redman JR. Self-reported changes to nighttime sleep after traumatic brain injury. Arch Phys Med Rehabil. 2006;87:278-85.
3. Ouellet M-C, Morin CM. Subjective and objective measures of insomnia in the context of traumatic brain injury: a preliminary study. Sleep Med. 2006;7:486-97.
4. Kempf J WE, Kaiser PR, Bassetti CL, Baumann CR. Sleepewake disturbances three years after traumatic brain injury. J Neurol Neurosurg Psychiatry. 2010;81:1402-05.
5. Wiseman-Hakes C, Gargaro J , Colantonio A. Sleep and wake disorders following traumatic brain injury: A systematic review of the literature. Crit Rev Phys Rehabil Med. 2009;21:317-74.
6. Beaulieu-Bonneau S, Morin CM. Sleepiness and fatigue following traumatic brain injury.
Sleep Med. 2012;13:598-605.
7. Wiseman-Hakes C, Victor JC, Brandys C, Murray BJ. Impact of post-traumatic hypersomnia on functional recovery of cognition and communication. Brain Inj. 2011;25:1256-65.
8. Cantor JB, Ashman T, Gordon W, et al. Fatigue after traumatic brain injury and its impact on participation and quality of life. J. Head Trauma Rehabil. 2008;23:41-51..
9. Castriotta RJ, Wilde MC, Lai JM, Atanasov S, Masel BE, Kuna ST. Prevalence and consequences of sleep disorders in traumatic brain injury. J Clin Sleep Med. 2007;3:349-56.
10. Makley MJ, Johnson-Greene L, Tarwater PM, et al. Return of memory and sleep efficiency following moderate to severe closed head injury. Neurorehabil Neural Repair. 2009;23:320-6.
11. Sommerauer M, Valko P, Werth E, Baumann CR, Excessive sleep need following traumatic brain injury: a case-control study of 36 patients. J Sleep Res. 2013: [Epub ahead of print].
12. Nakase-Richardson R, Sherer M, Barnett SD, et al. Prospective Evaluation of the Nature, Course, and Impact of Acute Sleep Abnormality After Traumatic Brain Injury. Arch Phys
Med Rehabil. 2013: [Epub ahead of print].
13. Hardin KA. Sleep in the ICU: potential mechanisms and clinical implications. Chest. 2009;136:284-94.
14. Bijwadia JS, Ejaz MS. Sleep and critical care. Curr Opin Crit Care. 2009;15:25-9.
15. Cooper AB, Thornley KS, Young GB, Slutsky AS, Stewart TE, Hanly PJ. Sleep in critically ill patients requiring mechanical ventilation. Chest. 2000;117:809-18.
16. Gehlbach BK, Chapotot F, Leproult R, et al. Temporal disorganization of circadian rhythmicity and sleep-wake regulation in mechanically ventilated patients receiving continuous intravenous sedation. Sleep. 2012;35:1105-14.
17. Robillard R, Lanfranchi PA, Prince F, Filipini D, Carrier J. Sleep deprivation increases blood pressure in healthy normotensive elderly and attenuates the blood pressure response to orthostatic challenge. Sleep. 2011;34:335-9.
18. Mullington JM, Haack M, Toth M, Serrador JM, Meier-Ewert HK. Cardiovascular, inflammatory, and metabolic consequences of sleep deprivation. Prog Cardiovasc Dis. 2009;51:294-302.
19. Goel N, Rao H, Durmer JS, Dinges DF. Neurocognitive consequences of sleep deprivation. Semin Neurol. 2009;29:320-39.
20. Vgontzas AN, Zoumakis E, Bixler EO, et al. Adverse effects of modest sleep restriction on sleepiness, performance, and inflammatory cytokines. J Clin Endocrinol Metab. 2004;89:2119-26.
21. Haack M, Sanchez E, Mullington JM. Elevated inflammatory markers in response to prolonged sleep restriction are associated with increased pain experience in healthy volunteers. Sleep. 2007;30:1145-52.
22. Van Der Werf, Ysbrand D., Altena, Ellemarije, Schoonheim, Menno M., Sanz-Arigita, Ernesto J., Vis, Jose C., De Rijke, Wim, & Van Someren, Eus J. W. Sleep benefits subsequent hippocampal functioning. Nat Neurosci. 2009;12:122-123.
23. Martin JL, Hakim AD. Wrist actigraphy. Chest. 2011;139:1514-27.
24. Wang SY, Chang HJ, Lin CC. Sleep disturbances among patients with non-small cell lung cancer in Taiwan: congruence between sleep log and actigraphy. Cancer Nurs.
2010;33:E11-7.
25. Natale V, Plazzi G, Martoni M. Actigraphy in the assessment of insomnia: a quantitative approach. Sleep. 2009;32:767-71.
26. Chae KY, Kripke DF, Poceta JS, et al. Evaluation of immobility time for sleep latency in actigraphy. Sleep Med. 2009;10:621-5.
27. Lichstein KL, Stone KC, Donaldson J, et al. Actigraphy validation with insomnia. Sleep. 2006;29:232-9.
28. Menon DK, Schwab K, Wright DW, et al. Position Statement: Definition of traumatic brain injury . Arch Phys Med Rehabil. 2010;91:1637-40.
29. Teasdale G, Jennett B. Assessment of coma and impaired consciousness. A practical scale. Lancet. 1974;2:81-84.
30. Marshall LF, Marshall SB, Klauber MR, et al. The diagnosis of head injury requires a classification based on computed axial tomography. J Neurotrauma. 1992;9 Suppl 1:S287-92.
31. Maas AIR, Hukkelhoven CWPM, Marshall LF, Steyerberg EW. Prediction of outcome in traumatic brain injury with computed tomographic characteristics: a comparison between the computed tomographic classification and combinations of computed tomographic predictors. Neurosurgery. 2005;57:1173-82
32. Shore PM, Hand LL, Roy L, Trivedi P, Kochanek PM, Adelson PD. Reliability and validity of the Pediatric Intensity Level of Therapy (PILOT) scale: a measure of the use of intracranial pressure-directed therapies. Crit Care Med. 2006;34:1981-7.
33. Ely EW, Shintani A, Truman B, et al. Delirium as a predictor of mortality in mechanically ventilated patients in the intensive care unit. JAMA. 2004;291:1753-62.
34. Hagen C, Malkmus D, Durham P. Rancho Los Amigos levels of cognitive functioning scale. Professional Staff Association; 1972; Downey, CA.
35. Levin HS, O'Donnell VM, Grossman RG. The Galveston Orientation and Amnesia Test. A practical scale to assess cognition after head injury. J Nerv Ment Dis. 1979;167:675-84. 36. Rappaport M, Hall KM, Hopkins K, Belleza T, Cope DN. Disability rating scale for
severe head trauma: coma to community. Arch Phys Med Rehabil. 1982;63:118-23. 37. Padhye NS, Hanneman SK. Cosinor analysis for temperature time series data of long
duration. Biological research for nursing. 2007;9:30-41.
39. Walker MP. Issues surrounding sleep-dependent memory consolidation and plasticity.
Cell Mol Life Sci. 2004;61:3009-15.
40. Czeisler CA, Gooley JJ. Sleep and circadian rhythms in humans. Cold Spring Harb Symp
Quant Biol. 2007;72:579-97.
41. Barion A, Zee PC. A clinical approach to circadian rhythm sleep disorders. Sleep Med. 2007;8:566-77.
42. Dispersyn G, Pain L, Challet E, Touitou Y. General anesthetics effects on circadian temporal structure: an update. Chronobiol Int. 2008;25:835-50.
43. Paparrigopoulos T, Melissaki A, Tsekou H, et al. Melatonin secretion after head injury: a pilot study. Brain Inj. 2006;20:873-8.
44. Paul T, Lemmer B. Disturbance of circadian rhythms in analgosedated intensive care unit patients with and without craniocerebral injury. Chronobiol Int. 2007;24:45-61.
45. Blood ML, Sack RL, Percy DC, Pen JC. A comparison of sleep detection by wrist actigraphy, behavioral response, and polysomnography. Sleep. 1997;20:388-95.
46. de Souza L, Benedito-Silva AA, Pires MLN, Poyares D, Tufik S, Calil HM. Further validation of actigraphy for sleep studies. Sleep. 2003;26:81-5.
47. Kushida CA, Chang A, Gadkary C, Guilleminault C, Carrillo O, Dement WC. Comparison of actigraphic, polysomnographic, and subjective assessment of sleep parameters in sleep-disordered patients. Sleep Med. 2001;2:389-96.
48. Acebo C, LeBourgeois MK. Actigraphy. Respir Care Clin N Am. 2006;12:23-30, viii. 49. Beecroft JM, Ward M, Younes M, Crombach S, Smith O, Hanly PJ. Sleep monitoring in
the intensive care unit: comparison of nurse assessment, actigraphy and polysomnography. Intensive Care Med. 2008;34:2076-83.
Figure 1. Examples of actigraphy recordings
Examples of 10-day actigraphy results from 4 representative patients. Each of the 10 days is represented on a separate line, from 07:00 to 07:00 h. Total activity counts for each minute of recording is illustrated by vertical dark lines. The same scale of 0 to 1000 activity counts was used for all subjects and all days of recording. Hours included in the Day period (07:00 to 22:00) are shown in yellow and those included in the night period (22:00 to 07:00) are in blue at the top of each graph. Daily percentages of daytime activity on total 24-h activity are indicated on the right side of each actigram. Periods with no recording are represented by grey rectangles. Days when the recording took place in ICU are in red.
Figure 2: Evolution of the consolidation of rest-activity cycle over ten days
Evolution of the mean (± SEM) daytime activity ratio in the 12 patients having 10 days of recording. The linear trend of improvement was statistically significant (p< 0.01).
Figure 3: Illustration of the significant Pearson correlations between the daytime activity ratio and the score on the Disability Rating Scale (DRS) at discharge
3A. Negative correlation between the daytime activity ratio averaged over the total recording period and the DRS at discharge.
3B. Negative correlation between the daytime activity ratio averaged over the last 48-h of actigraphy recording and the DRS at discharge.
3C. Negative correlation between the percentage of improvement between the first and last 48-h of recording and the DRS at discharge.
3D. Negative correlation between the number of days with a daytime activity ratio >80% and the DRS at discharge.
Table 1. Demographic and clinical characteristics of patients
ID
# Age Sex Mechanismof injury (ER/30minGCS post-admission)
Neuroimaging results Marshall
Score RotterdamScore Dayswith elevated ICP Peak TIL score Cum. ICU dose analgo-sedation Days in ICU Length of hospital stay PTA at discharge (Y/N) DRS at discharge Orientationat discharge Start of protocol (days
post-MLS
2 23 M MVA 3/3 Thalamic contusion (R), SAH,
ventricular hemorrhage (R) 2 3 0 3 22.1 24 36 N 7 Internal 17
3 21 M MVA 14/- Epidural hemorrhage, CO,
laceration of meningeal artery, multiple traumatic lesions, fronto-temporal fx (R) with SDH, ventricular collapse 6 3 14 22 137.3 40 56 N 6 External 28 4 55 M Fall from moving vehicle
11/- Traumatic SDH (L), frontal and temporal SAH (L), diffuse
cerebral lesions, frontal intraparenchymal contusion (L)
5 4 3 15 31.4 15 32 N 7 Internal 13
5 20 M MVA 11/11 Bilateral SDH 2 3 0 4 0.1 13 26 N 6 External 8
6 17 F MVA 4/7 Intraparenchymal hemorrhage,
SAH, CO, probable PSH, contusion, EVD
3 4 6 12 14.6 40 54 Y 14 Internal 11
7 29 M MVA 7/7 Fronto-temporal parenchymal
contusion (L), SAH 2 2 3 13 17.4 13 26 N 8 Internal 7
8 17 M MVA 6/6 Diffuse CO, multiple SDH,
temporal EDH (L) 6 3 16 18 42.1 52 64 N 11 Internal 27
9 47 M Fall 6/3 No traumatic anomalies 1 2 0 4 5.2 5 11 N 5 External 4
10 26 F MVA 7/7 EDH, SAH, open
temporo-parietal fx (L) 2 2 0 6 4.8 7 22 N 5 Internal 8
11 23 M Hit by car 3/4 EDH, SAH,
open temporo-parietal fx (L) Decerebration, fronto-temporal SDH (L) with 4mm MLS, parenchymal hematoma of cerebellum (L) and mesencephalon (R), RHL, open
comminuted fx medial orbital wall (L), probable PSH
2 3 9 16 61.4 40 87 Y 16 Internal 52
12 21 F MVA 6/6 Convex SDH, 5mm MLS,
contusion, fx orbital floor, ventricular hernia
2 3 14 13 77.9 38 56 Y 13 Internal 26
13 20 M MVA 3/3 SDH, frontal SAH (L) 2 3 0 5 4.9 24 68 Y 10 Internal 17
14 43 M Fall 3/3 SAH, parietal SDH (L), temporal
contusion (R) 2 3 13 19 82.8 27 54 Y 10 Internal 31
15 17 M MVA 7/7 Frontal SDH (R), frontal SAH
(L), periorbital oedema (R), frontoparietal skull fracture (R), slight MLS
2 3 0 3 5.4 5 13 N 5 External 4
16 18 M MVA 5/7 Temporal and parietotemporal
Table 2. Pearson correlation coefficients between rest-activity cycle and clinical variables Actigraphy
variables GCS Marshall Rotterdam Peak TIL
Days elevated ICP
Cum. ICU dose analgosedation Length ICU stay Total length hospital stay DRS at discharge Mean daytime ratio for total recording period 0.33 0.04 -0.27 -0.39 -0.40 -0.33 -0.59* -0.67** -0.68** Mean daytime ratio for first 48-h -0.17 -0.25 -0.33 -0.43 -0.35 -0.41 -0.38 -0.30 -0.23 Mean daytime ratio for last 48-h 0.39 0.09 -0.19 -0.30 -0.22 -0.16 -0.50* -0.69** -0.74** Improvement of daytime ratio between
first and last 48-h
0.53* 0.28 0.06 -0.01 0.04 -0.15 -0.23 -0.48 -0.58*
No. days with consolidated
rest-activity cycle (> 80%)
0.56* 0.25 -0.13 -0.19 -0.26 -0.11 -0.47 -0.54* -0.67**
*: p<0.05; **: p<0.01
Table 3. Association between PTA upon discharge and variables of actigraphy compared between sub-groups of patients with (n=6) and without (n=10) post-traumatic amnesia (PTA) at discharge.
Actigraphy variables PTA at discharge No PTA at discharge t-value p value Mean daytime ratio for
total recording period (%) 68.6 ± 8.0 [57.7,79.0] § 80.01 ± 8.97 [67.15,92.34] -2.6 .022*
Mean daytime ratio for first 48-h (%) 69.3 ± 9.3 [58.0,82.8] 71.79 ± 10.86 [56.50,87.74] -0.5 .645
Mean daytime ratio for last 48-h (%) 69.6± 15.2 [45.7,89.0] 86.09 ± 8.30 [67.20,97.06] -2.8 .013* Improvement of daytime ratio between first and last 48-h (%)
0.4 ± 16.0 [-22.4,19.1]
14.30 ± 8.13 [2.06,26.97]
-2.3 .034*
No. days with consolidated rest-activity cycle (> 80%) 2.3 ± 2.0 [1,5] 5.40 ± 2.60 [2,9] -2.5 .026* §: Ranges; * : p<0.05 Supplementary note Results
Clinical characteristics of the patients
On average, patients spent 23.8±15.3 days in the ICU and were hospitalized for a total of 41.8±22.7 days. Nine patients (56.3%) had elevated ICP: of those 9 patients, elevated ICP was present for 10.1±5.0 days. Five patients did not have their ICP monitored, either because criteria for insertion were not met or because it was not clinically indicated.
Of all 85 days of recording in the regular units, sedative, analgesic, antiepileptic or neuroleptic medications were given on a total of 16 days to 6 different patients. Two patients received sedatives: one patient (patient #1) received a 1mg dose of midazolam per day for two days, while
another (patient #2) received a single 1 mg dose of lorazepam. Four patients (patients #2, 10, 11 and 15) received an average daily dose of 2.65±1.27 mg of hydromorphone for 2.5±1 days. One patient (patient #5) received a single 200 mg dose of phenytoin (antiepileptic). Finally, one patient (patient #2) received neuroleptic medication: a single 1mg dose of haloperidol and 4 daily 15 mg doses of olanzapine.
Actigraphy recording
Most patients (12/16) were hospitalized in the ICU at the beginning of actigraphy recording. The 4 other patients started the actigraphy recording 1 (patients #10 and 16), 4 (patient #14) and 18 (patient #11) days after ICU discharge. Ten days of actigraphy were recorded for 12 of the 16 patients. Three patients (patients #9, 15 and 16) recovered rapidly and left the hospital after only 6, 8, and 6 days of actigraphy recording respectively. Another patient (patient #11) wore the actigraph 8 full days, though the days were non-consecutive due to discomfort and medical interventions, as were the ten days of recording for Patient 6. In both cases of non-consecutive recordings, there was no difference in the rest-activity cycle consolidation between the beginning and the end of the interruption.
We carried out t-tests for independent samples in order to compare patients whose first 48-h of recording was in the ICU (n = 9) to those who were transferred to regular units prior to or during the first 48-h of actigraphy recording (n = 7). There was no significant difference between these groups on any of the 5 actigraphy variables (p-values between 0.16 and 0.88). The fact that there was no significant difference on actigraphy variables between patients whose first 48-h of recording was in the ICU and those who were transferred to regular units prior to or during the
first 48-h of actigraphy recording suggests that our actigraphy results were not influenced by the location of the patients at the start of actigraphy recording.
Figure Legends for Supplementary Materials
Supplementary Figures A1, A2, and A3. Individual actigraphy recordings
Actigraphy results from all patients, except those already presented in Figure 1. Each of the 10 days is represented on a separate line, from 07:00 to 07:00 h. The number of activity counts for each minute of recording is illustrated by vertical dark lines. The same scale of 0 to 1000 activity counts was used for all subjects and all days of recording. Hours included in the daytime period (07:00 to 22:00) are shown in yellow and those included in the nighttime period (22:00 to 07:00) are in blue at the top of each graph. The daily daytime activity ratio (%) is indicated on the right side of each actigram. Periods with no recording are represented by grey rectangles. Days where the recording took place in ICU are in red. The start of a non-consecutive day of recording is labelled by an asterisk.
Supplementary Table A1. Total fraction of time moving (%) as scored by the Actiware program with a threshold of > 10 activity counts per minute.
Fraction of time moving per 24-h (%)
Patient Day 1 Day 2 Day 3 Day 4 Day 5 Day 6 Day 7 Day 8 Day 9 Day 10
1 57.6% 65.4% 64.9% 58.7% 78.1% 61.7% 61.5% 70.0% 60.3% 57.9% 2 51.6% 69.3% 51.0% 69.8% 69.4% 50.5% 68.1% 69.6% 60.8% 52.1% 3 39.9% 80.4% 62.2% 73.6% 60.2% 76.1% 41.4% 67.3% 48.5% 74.2% 4 55.9% 56.6% 53.1% 57.6% 55.4% 60.7% 50.5% 51.9% 54.5% 52.9% 5 53.7% 60.0% 42.2% 36.4% 45.3% 35.0% 50.8% 49.2% 49.5% 52.2% 6 59.5% 66.2% 74.4% 68.0% 72.7% 65.2% 69.9% 64.9% 74.2% 73.6% 7 62.6% 78.4% 78.8% 64.5% 64.3% 52.1% 72.5% 58.5% 65.3% 52.4% 8 41.6% 54.2% 58.4% 27.3% 22.4% 29.1% 35.6% 44.6% 27.2% 61.9% 9 41.9% 44.4% 57.8% 55.1% 49.4% 55.8% --- --- --- ---10 53.7% 55.8% 54.7% 31.9% 50.9% 52.5% 54.2% 62.4% 55.6% 58.2% 11 81.1% 61.9% 77.8% 71.9% 76.3% 77.2% 66.3% 67.8% --- ---12 66.8% 69.8% 71.8% 55.9% 68.4% 74.4% 64.8% 57.1% 75.9% 60.1% 13 27.1% 34.7% 37.8% 40.5% 45.8% 50.5% 52.2% 38.0% 47.8% 49.2% 14 90.4% 87.1% 87.0% 89.0% 84.4% 85.1% 84.4% 85.3% 77.4% 81.9% 15 55.6% 49.8% 56.5% 51.0% 59.1% 59.3% 57.7% 65.1% --- ---16 44.4% 20.8% 46.5% 44.0% 46.9% 47.6% --- --- ---