HAL Id: hal-01306631
https://hal.archives-ouvertes.fr/hal-01306631
Submitted on 25 Apr 2016
HAL is a multi-disciplinary open access
archive for the deposit and dissemination of
sci-entific research documents, whether they are
pub-lished or not. The documents may come from
teaching and research institutions in France or
abroad, or from public or private research centers.
L’archive ouverte pluridisciplinaire HAL, est
destinée au dépôt et à la diffusion de documents
scientifiques de niveau recherche, publiés ou non,
émanant des établissements d’enseignement et de
recherche français ou étrangers, des laboratoires
publics ou privés.
Design and perceptual evaluation of a fully immersive
three-dimensional sound spatialization system
G Parsehian, L Gandemer, C Bourdin, R Kronland Martinet
To cite this version:
G Parsehian, L Gandemer, C Bourdin, R Kronland Martinet. Design and perceptual evaluation of
a fully immersive three-dimensional sound spatialization system. 3rd International Conference on
Spatial Audio (ICSA 2015), Sep 2015, Graz, Austria. �hal-01306631�
Design and perceptual evaluation of a fully immersive three-dimensional
sound spatialization system
G. Parsehian
1,∗, L. Gandemer
1,2,∗, C. Bourdin
2, R. Kronland Martinet
11 LMA, CNRS, UPR 7051, Aix-Marseille Univ, Centrale Marseille, 13402 Marseille, France, Email: [email protected] 2 Aix Marseille Univ, CNRS, ISM UMR 7287, 13288, Marseille, France, Email: [email protected]
∗
these authors contributed equally to this work.
Abstract
This article presents the design, the implementation, and the perceptual evaluation of a multichannel loudspeaker array for the creation of 3D virtual sound environments. Dedicated to perceptual and postural studies, this system consists of 42 loudspeakers equally distributed around the listener on a full sphere (3 meter diameter), allowing to synthetize sounds moving within the whole 3D space. The spatial distribution of the loudspeakers makes it possible to use two different 3D rendering approaches: a physical approach through the use of 3D Higher Order Ambisonics (HOA) method up to fifth order and a perceptual approach through the use of Vector-Based Amplitude Panning (VBAP) method. A localization experiment was carried out in order to investigate the performance of the present system in terms of localization accuracy. Furthermore, this experiment aimed to explore the perceptual impact of the rendering methods (e.g. HOA and VBAP), and to evaluate the improvement of localization performance with respect to the ambisonic order (from third to fifth order). Differences between rendering methods are investigated in terms of azimuth and elevation localization errors, and front-back and up-down confusions. Finally, virtual sound source localization is compared to real sound source localization generated by 42 loudspeakers.
Introduction
In the various existing 3D sound spatialization techniques, one can distinguish physical reproduction approaches and hearing-related model approaches [Zotter et al., 2012]. The physical reproduction approach, as used for example in High Order Ambisonics (HOA) and Wave Field Syn-thesis (WFS) techniques, aims at reconstructing the 3D sound field through holophonic techniques [Gerzon, 1985, Berkhout et al., 1993]. On the other hand, hearing-related approach such as Vector-Based Amplitude Pan-ning (VBAP) is based upon psychoacoustics phenomenon called ”phantom source”: by panning techniques, it is possible to give the impression that one single sound event is localized between loudspeakers. This principle is used in stereophonic diffusion with two loudspeakers and can be generalized to the 3D using three loudspeakers to create phantom sound sources in the whole 3D space [Pulkki, 1997].
In this paper, we present the design, the implementa-tion and the perceptual evaluaimplementa-tion of a multichannel loudspeaker array. This system consists in 42 loud-speakers equally distributed around listener on a 3-meter diameter full sphere. To our knowledge, this is the only system integrating such a number of loudspeakers on a full sphere. Indeed, most of 3D loudspeakers arrays are hemispherical [Martens et al., 2015] or set up on walls of rectangular rooms [Noisternig et al., 2012, Noisternig et al., 2013]. Thus, beyond its primary pur-pose of studying posture [Gandemer et al., 2014], this system is a powerful tool for perceptual studies. In-deed, it allows the use of HOA up to the fifth order and VBAP with a high precision. Literature com-paring different spatialization techniques in terms of perceptual rendering is relatively weak. Some stud-ies compared sound source localization with respect
to spatialization techniques but only in the horizon-tal plane [Frank, 2013, Frank, 2014]. Other did not compare techniques but investigated the perception of Ambisonics [Benjamin et al., 2006, Bertet et al., 2013] or VBAP [Pulkki, 2001]. Other studies are oriented to musical applications. For example, in a recent study by Marentakis et al. [Marentakis et al., 2014], authors compare VBAP and Ambisonics through perceptual rating of preference/quality, using musical material. In this study, we aimed at investigating the localization performance in the whole 3D space surrounding the subject and at the same time at comparing different sound spatialization techniques. For this purpose, we set up a static sound source localization test allowing for the comparison of localization performance of subjects with respect to the spatialization techniques used (VBAP, HOA) and to the Ambisonics order. Localization performance of real sound sources is also investigated as a reference.
Set up of loudspeaker array
Spherical loudspeaker distribution
3D sound spatialization using High-Order Ambisonics (HOA) technology requires a regular distribution of loudspeakers at a constant distance and all around the listener. Moreover, to increase the order up to n, at least (n + 1)2 loudspeakers are necessary for sound field
restitution. Here, we chose to design a 5th order HOA system: a minimum of 36 loudspeakers was necessary. The number of loudspeakers was increased up to 42 for spatial distribution purposes. Indeed, the lighter, easier and most robust way to distribute such a number of loudspeakers equally on a sphere was to build a geodesic sphere and put one loudspeaker on each junction.
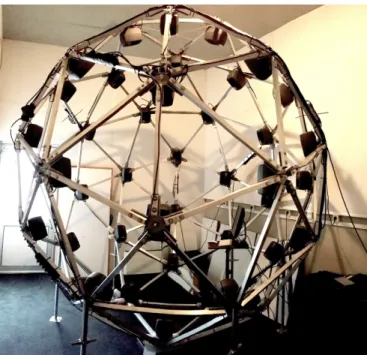
A geodesic sphere is a discretization of a sphere with a complex network of triangles. It consists of lightweight rods or poles joined so as to form interlocking polygons whose vertices lie on an imaginary sphere. It can be entirely defined by its frequency and its diameter. The higher the frequency, the more complex the network of triangles, and the more closely the geodesic structure approximates the shape of a true sphere. A geodesic sphere of frequency F 1 is an icosahedron, composed of equilateral triangles. Our structure is of frequency F 2, which means it contains two different types of triangles (one equilateral and the other isosceles), 42 vertices and 120 poles. Then, the diameter of the metal structure is 3m20 so as the 42 loudspeakers are set up on a 3 meter of diameter imaginary sphere. The 42 loudspeakers are mounted directly on the junctions (see figure 1), their positions are reported in table 1 in spherical coordinates. With this structure, the angular gap between two adjacent loudspeakers is 31.7◦or 36◦ .
Figure 1: Picture of the spherical loudspeaker array.
az el az el az el az el -60 -69 158 -35 -150 0 98 35 60 -69 0 -21 150 0 -142 35 180 -69 -120 -21 0 11 142 35 0 -53 120 -21 -120 11 -60 53 -120 -53 60 -11 120 11 60 53 120 -53 -60 -11 -60 21 180 53 -38 -35 180 -11 60 21 0 69 38 -35 -30 0 180 21 -120 69 -82 -35 30 0 -22 35 120 69 82 -35 -90 0 22 35 -158 -35 90 0 -98 35
Table 1: Loudspeakers’ positions in spherical coordinates (azimuth and elevation) in degrees.
Technical specifications
Loudspeakers used are Genelec 8020C two-channel active monitoring system.
The metal structure is consisted by galvanized steel junctions and square-section aluminium poles. Poles are simply screwed on the junctions and both are separated by rubber sliver to limit vibration transmitting and thus acoustically de-couple the monitors from the metal structure.
The room hosting the structure measures approximately 5 x 4 x 4 m and is not perfectly rectangular. It has been sound proofed with a 5 cm stone wood layer all over the walls and with a carpet on the floor. With these materials, the reverberation time is approximately 300 ms in the mid frequency region.
Software part
Sound generation and spatialization is realized on Max/MSP1. For the spatialization parts, we use the IRCAM Spat [Jot, 1999, Carpentier, 2015]. This set of Max/MSP external objects feature the implementation of various spatialization techniques (including VBAP and HOA without order restrictions).
Calibration
For this kind of multichannel loudspeaker array, one can distinguish 3 types of calibration:
- temporal calibration, which consists in compen-sating the differences of distance between the listener and the loudspeakers, by adding delays in input signal corresponding to the closest loudspeakers
- level calibration, to insure all the loudspeakers to be set up to the same loudness;
- frequency calibration, to insure the loudspeakers having the same frequency response at the center of the system.
Due to spatial characteristics of the geodesic sphere, all the loudspeakers are approximately set up at the same distance of the subject (150 ± 7 cm). The temporal calibration gave a set of delay values framed between 0. and 0.375 milliseconds (mean delay = 0.19 ± 0.11 msec). The level of calibration was performed by playing a pink noise at 72 dB SPL in each loudspeaker separately. The sound resulting amplitude was measured using a sonometer and corrected directly on the loudspeaker using the loudspeaker potentiometer. On the other hand, spectral differences between loudspeakers were not compensated, since the room response was affecting the loudspeakers response far more than the small frequency response variation between loudspeakers.
Method
Subjects
30 subjects participated in the experiment (9 women and 21 men; mean age: 31 ± 10 years (min. 19; max. 55 years)). All were naive regarding the sets of spatial positions selected for the experiment and none of the subjects reported any hearing losses. All of them
participated on a volunteer basis; they signed an informed consent form prior to testing. This study was performed in accordance with the ethical standards of the Declaration of Helsinki (revised Edinburgh, 2000).
Stimuli
The stimulus consisted of a train of three, 40 ms Gaussian broadband noise bursts (50–20000 Hz) with 2 ms Hamming ramps at onset and offset and 30 ms of silence between each burst. It was short in order to exclude head movement effects. This stimulus was chosen following [Mac´e et al., 2012], where the effect of repetition and duration of the burst on localization accuracy was analysed. The overall level of the train was approximately 65 dBA, measured at the ear position.
Design and procedure
The experimental setup consists of the previously de-scribed loudspeakers’ sphere.
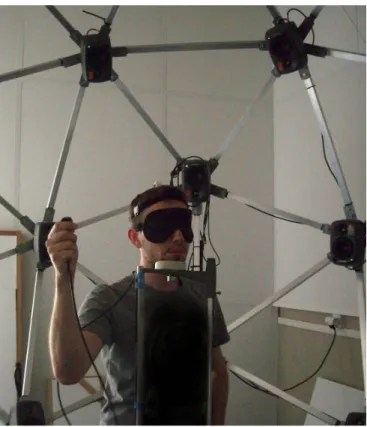
The localization task consisted in reporting the perceived position of a static spatialized sound sample using a hand pointing technique. The subject stood on a platform that could be adjusted in height to center his head in the sphere. Then, the subject had his chin on a chinstrap to orient himself straight ahead and to keep his head fixed during the experiment. After presentation of the stimulus, each subject was instructed to point his hand in the direction of the perceived sound source location and to validate the response with a trigger located in front of him. No hand was imposed for holding the sensor, and the hand holding the sensor could be changed at will. The perceived orientation was calculated between the head position/orientation and the hand position when the listener validated the target. Head and hand were tracked with a 6-DoF position/orientation magnetic sensor (Polhemus Fastrak). For technical reason, the subjects were asked to report the perceived position while holding their hand near their head (see figure 2). No feedback was given to the subject regarding the target position. The experiment was divided into four blocks of 60 trials, each block lasting approximately 5 min and corresponding to a different condition (Loudspeaker, VBAP, HOA3, and HOA5). For each condition, 20 positions were tested. All positions were repeated 3 times. Each condition was divided in 3 blocks (for the three repetitions) with a pseudo-random order for the positions. The order of the rendering conditions was counterbalanced in order to suppress any potential learning effect.
Data analysis
The analysis of localization performance, which was origi-nally recorded in standard spherical coordinates (azimuth and elevation), was performed using the interaural polar coordinate system (see [Morimoto et Aokata, 1984]). In this coordinate system, azimuth and elevation angles are transformed into lateral and polar (or rising) angles, with the polar angle rotation axis being the interaural axis. The direction of a vector between the head center and a point on the sphere is expressed by two angles: the lateral
Figure 2: Picture of the localization experiment.
angle and the polar angle. The angle between the vector and the median plane is the lateral angle, from −90◦ to 90◦. The polar angle corresponds to the rotation around the interaural axis, from −90◦ to 270◦, with 0◦ being
directly in front. This is a natural coordinate system for human localization data since it allows for the rough separation of temporal cues, which are related to the ITD and are represented by the lateral angle, from the spectral cues, which are related to the HRTF and are represented by the polar angle. Using the interaural polar coordinate system, all front/back and up/down confusion errors are contained in the polar angle. Localization errors in lateral and polar angles were analysed using the magnitude of the difference between the target angle and the perceived angle.
Results
Lateral angle error
Figure 3 shows the results for the lateral angle error with a representation combining boxplot, histogram, and the mean magnitude error for each rendering condition. This type of representation has the advantage of combining a boxplot (left side) containing traditional statistical data [lower quartile (Q1), median (Q2), upper quartile (Q3)] with a histogram (right side), representing the distribution of the response errors. Overall localization blur was 14.2 ± 2.6◦ for HP condition, 15.6 ± 2.5◦ for HOA3 condition, 15.5 ± 3.2◦for HOA5, and 14.9 ± 2.8◦for VBAP condition. A repeated measures 1-factor ANOVA (Rendering condition) was performed on the unsigned lateral angle error after verifying the data distribution normality with Shapiro-Wilk tests on each conditions [F (3, 87) = 4.2 ; p < 0.01]. A Tukey post-hoc test
revealed a significant difference between the HP condition and HOA3 and HOA5 conditions. No differences between HOA3, HOA5, and VBAP conditions were observed.
HP HOA3 HOA5 VBAP
0 5 10 15 20 25 30 35 40 45 50 |Lateral Error| (°) 0 10 20 30 40 50 60 70 80
Figure 3: Split boxplot-histogram of the magnitude of lateral error by rendering condition. Boxplot and angular error scale at the left; mean values (red o); histogram value legend colour bar on the right.
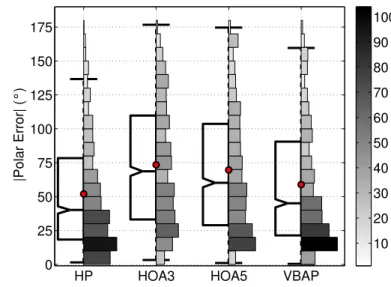
Polar angle error
Figure 4 shows the results for the polar angle error. As the polar angle contains all front/ back and up/down confu-sions, no resolution or suppression of these types of errors was performed in order to observe their evolution on the distribution of the responses as a function of the rendering condition. For the HP condition, the distribution was asymmetric but quasi-normal while the distribution of polar error for the virtual conditions (HOA3, HOA5, and VBAP) was plurimodal and highlighted many confusions error. The mean polar errors were 51.8 ± 16.8◦ for HP condition, 73.1 ± 12.5◦ for HOA3 condition, 69.5 ± 13.7◦ for HOA5, and 59.0 ± 15.1◦ for VBAP condition. A repeated measures 1-factor ANOVA performed on the mean unsigned polar angle error for all positions and repetitions for each subject, highlighted a significant effect of the rendering condition [F (3, 87) = 39.7 ; p < 10−5]. A Tukey post-hoc test revealed a significant difference between the HP condition and the other conditions, a significant difference between VBAP condition and the other conditions and no significant difference between HOA3 and HOA5 conditions.
Error type
Front/back and up/down confusions represent a common problem in sound localization studies, especially when exploring localization abilities on the whole auditory space. When localizing sound sources on the horizontal plane, front/back confusions refer to instances where a subject localizes a source to the front that should be in the rear, or less commonly, the inverse. In a full sphere localization task, the analysis of these errors is much more complex as some confusions may appear across the vertical plane, or across the horizontal plane
HP HOA3 HOA5 VBAP
0 25 50 75 100 125 150 175 |Polar Error| (°) 10 20 30 40 50 60 70 80 90 100
Figure 4: Split boxplot-histogram of the magnitude of lateral error by rendering condition. Boxplot and angular error scale at the left; mean values (red o); histogram value legend color bar on the right.
and more commonly on the confusion cone. In this study, the errors were analysed following the method proposed in [Parseihian et Katz, 2012]. This method allows decomposing the confusion cone in four errors zones. Errors along the principal axis are considered as precision type errors (there are no confusions in this zone), while errors outside of both the front/back and up/down regions are considered combined errors, as they cannot be attributed solely to either front/back or up/down confusion errors.
Error Type HP HOA3 HOA5 VBAP Precision 54 (17) 37 (11) 40 (10) 49 (15) Front/back 10 (7) 16 (8) 18 (9) 16 (7) Up/down 6 (6) 16 (9) 13 (8) 12 (8) Combined 30 (11) 31 (7) 29 (8) 23 (9)
Table 2: Percentage of error type by rendering condition. Standard deviation across the subjects in parenthesis.
Results of the error type analysis are provided in Table 2 with the mean percentage of each error type as a function of the rendering condition. Ideally, there would be no confusion and all errors would be in the range of the precision. The percentage of precision error was 54 % for HP condition where as it was 49 % for VBAP condition and 37 % and 40 % for HOA3 and HOA5 conditions. The distribution of the error type was variable as a function of the rendering condition. The HP condition induced only few up/down (6 %) and front/back confusion (10 %) confusions but a number of combined errors (30 %). In general, virtual conditions led to a greater percentage of front/back and up/down confusions but the same percentage of combined errors.
Discussion
The purpose of this experiment was to investigate the performances of a fully immersive 3D sound spatialization system and to explore the impact of the rendering methods
on the spatial sound perception.
Overall, the localization results of the present exper-iment show worse accuracy compared to previously published results in localization studies [Bronkhorst, 1995, Best et al., 2011]. These differences could be explained by different experimental factors such as the reporting method, the distribution of the sound source positions on the whole sphere (no restriction of the sound sources in a specific plane or a specific zone that allow to diminish the number of confusions), and by the absence of subjects training with the reporting task and the sound localization. Furthermore, the use of the interaural polar coordinate system, necessary to decompose binaural (lateral angle) and spectral (polar angle) cues, makes comparisons difficult as only few studies use this type of coordinate in order to investigate sound localization accu-racy (see [Best et al., 2011, Parseihian et Katz, 2012] for example).
Firstly, it is important to justify the choice of a hand pointing method. In this study, position of the sources were not limited to a plane or a part of space but were distributed in the whole sphere surrounding the subjects. Pointing in the whole 3D space is difficult, particularly behind the subject because of biomechanichal constraint. An alternative could have been to use the GELP technique, where the subjects indicate the perceived direction of the sound by pointing at a scale model sphere [Gilkey et al., 1995]. This technique allows quick responses and is not limited in 3D space but is known to induce a significant bias due to representation of the space [Djelani et al., 2000]. The use of GELP technique would have requires a subjects training to get reliable results. Here, it was preferred to choose hand pointing which seems to be the more natural way to report the perceived position of sound sources. As the goal of this study was not to characterize the absolute precision of human localization abilities but rather to compare precision of localization in different techniques, the imprecision of pointing behind subjects is not of utmost importance. Indeed, here we compare VBAP and HOA at different orders with a reference (HP condition: real sound sources) and the imprecisions due to pointing technique are present in the four conditions.
The results show that localization performances in azimuth (as conveyed by lateral error) are better with real sources than with virtual sources, but do not highlight significant differences between rendering techniques. The differences between techniques stand mostly in elevation perception (expressed by polar error). Here, the best localization performances were obtained using the ref-erence, then with VBAP technique, while the poorest performances were obtained using the HOA technique. Increasing HOA order led to a slight but not significant reduction of the polar error.
The analysis of the confusion errors highlighted a high percentage of confusion for all rendering conditions. The decomposition in front/back, up/down and combined confusions shows a high rate of each type of confusion
for the virtual rendering conditions. This highlights the ambiguity of spectral cues for localization in the entire 3D space and confirms the influence of the cone of confusion (along which locations share the same binaural cues) on localization accuracy without head movement. Globally, the reference condition induces less confusion than the virtual conditions. Then, VBAP technique is better than HOA5, while HOA3 leads to the highest confusion rate. Thus, our results show that the VBAP technique allows a better localization precision than the HOA techniques. Several factors could explain these results. First of all, HOA is a physical approach of spatialization. It recreates the sound field (here, due to the presence of one sound source) in a precise area at the center of the sphere. This area is called ”sweet area” and represents the optimal zone of sound field reconstruction. The size of the sweet area depends on the number of loudspeakers used for restitution and the size of the system, but can be smaller than the subject head. It would be interesting to evaluate the size of the sweet area and to compare it in the two techniques.
Then, to recreate the sound field, HOA technique works on the assumption that there is nothing inside the loudspeaker sphere. Here, the subject inside the sphere has an impact on the sound field, which is probably not negligible, whereas VBAP is by nature not sensitive to the presence of the subject inside the apparatus. Then, the system presented here is not located in an anecho¨ıc room. The impact of the room on the generated sound field is important as we could notice during the calibration step. As in HOA technique the 42 loudspeakers are involved in sound field reconstruction, the resulting field is probably more disrupted by the room than could be the phantom source created by 3 loudspeakers in VBAP. It would be interesting to go further in the analysis of the results, by dividing the space into several areas, as made for example in [Best et al., 2011]. Indeed, here, the precision results are expressed as a mean on all the source positions, whereas each technique could lead to different results depending on the area analysed (e.g. front, back, up, and down regions).
We could also imagine more ecological protocols with longer stimuli and allowing subjects’ head movements to help them to better localize the sound source. Likewise, it would be interesting to improve the subject results thanks to training sessions devoted to sound localization and to the pointing method, and thus refine the comparison of spatialization techniques.
Finally, to go further, it would be of interest to investigate the differences between VBAP and HOA rendering methods across the perception of moving sound sources using the same apparatus.
Conclusion
In this study, VBAP and HOA techniques were compared in the 3D space through a static sound source localization task. It has been shown that, using the loudspeaker
array presented here, VBAP technique allows for a better localization precision than HOA, especially in elevation. The order of HOA mostly has an impact on the confusion rate. In the future, we plan to go further in the analysis of these results, and to investigate the perception of moving sound sources with respect to the spatialization technique that is used.
Acknowledgment
This work was funded by the French National Research Agency (ANR) under the SoniMove: Inform, Guide and Learn Actions by Sounds project (ANR-14-CE24-0018-01).
References
[Benjamin et al., 2006] Benjamin, E., Heller, A. et Lee, R. (2006). Localization in horizontal-only ambisonic systems. In Audio Engineering Society Convention 121. Audio Engineering Society.
[Berkhout et al., 1993] Berkhout, A. J., de Vries, D. et Vogel, P. (1993). Acoustic control by wave field synthesis. The Journal of the Acoustical Society of America, 93(5):2764–2778.
[Bertet et al., 2013] Bertet, S., Daniel, J., Parizet, E. et Warusfel, O. (2013). Investigation on localisation accuracy for first and higher order ambisonics reproduced sound sources. Acta Acustica united with Acustica, 99(4):642–657.
[Best et al., 2011] Best, V., Brungart, D., Carlile, S., Jin, C., Macpherson, E., Martin, R., McAnally, K., Sabin, A. et Simpson, B. (2011). A meta-analysis of localization errors made in the anechoic free field. In Suzuki, Y., Brungart, D., Iwaya, Y., Lida, K., Cabrera, D. et Kato, H., ´editeurs : Principles and Applications of Spatial Hearing. Singapore: World Scientific Publishing. [Bronkhorst, 1995] Bronkhorst, A. W. (1995).
Local-ization of real and virtual sound sources. Acoustical Society of America Journal, 98:2542–2553.
[Carpentier, 2015] Carpentier, T. (2015). R´ecents d´evelopements du spatialisateur. In JIM.
[Djelani et al., 2000] Djelani, T., P¨orschmann, C., Sahrhage, J. et Blauert, J. (2000). An interactive virtual-environment generator for psychoacoustic research ii: Collection of head-related impulse responses and evaluation of auditory localization. Acta Acustica united with Acustica, 86(6):1046–1053.
[Frank, 2013] Frank, M. (2013). Phantom sources using multiple loudspeakers in the horizontal plane. Th`ese de doctorat, University of Music and Performing Arts, Graz, Austria.
[Frank, 2014] Frank, M. (2014). Localization using different amplitude-panning methods in the frontal horizontal plane. In Proc. of the EAA Joint Symposium on Auralization and Ambisonics, Berlin, Germany, 3-5
April 2014.
[Gandemer et al., 2014] Gandemer, L., Parseihian, G., Kronland-Martinet, R. et Bourdin, C. (2014). The influence of horizontally rotating sound on standing balance. Experimental brain research, 232(12):3813– 3820.
[Gerzon, 1985] Gerzon, M. A. (1985). Ambisonics in multichannel broadcasting and video. Journal of the Audio Engineering Society, 33(11):859–871.
[Gilkey et al., 1995] Gilkey, R. H., Good, M. D., Ericson, M. A., Brinkman, J. et Stewart, J. M. (1995). A pointing technique for rapidly collecting localization responses in auditory research. Behavior Research Methods, Instruments, & Computers, 27(1):1– 11.
[Jot, 1999] Jot, J.-M. (1999). Real-time spatial processing of sounds for music, multimedia and interactive human-computer interfaces. Multimedia systems, 7(1):55–69.
[Mac´e et al., 2012] Mac´e, M. J. M., Dramas, F. et Jouffrais, C. (2012). Reaching to sound accuracy in the peri-personal space of blind and sighted humans. In Miesenberger, K., Karshmer, A., Penaz, P. et Zagler, W., ´editeurs : Computers Helping People with Special Needs: 13th International Conference, ICCHP 2012, pages 636–643. Springer-Verlag.
[Marentakis et al., 2014] Marentakis, G., Zotter, F. et Frank, M. (2014). Vector-base and ambisonic amplitude panning: a comparison using pop, classical, and contemporary spatial music. Acta Acustica united with Acustica, 100(5):945–955.
[Martens et al., 2015] Martens, W. L., Cabrera, D., Miranda, L. et Jimenez, D. (2015). Potential and limits of a high-density hemispherical array of loudspeakers for spatial hearing and auralization research. Journal of Applied Mathematics and Physics, 3(02):240.
[Morimoto et Aokata, 1984] Morimoto, M. et Aokata, H. (1984). Localization cues of sound sources in the upper hemisphere. J Acoust Soc Jpn, 5(3):165–173. [Noisternig et al., 2012] Noisternig, M., Carpentier,
T. et Warusfel, O. (2012). Espro 2.0-implementation of a surrounding 350-loudspeaker array for sound field reproduction. In Proceedings of the Audio Engineering Society UK Conference.
[Noisternig et al., 2013] Noisternig, M., Carpentier, T. et Warusfel, O. (2013). A multichannel loudspeaker array for wfs/hoa sound spatialization at ircam’s concert hall. In AIA-DAGA Conference on Acoustics.
[Parseihian et Katz, 2012] Parseihian, G. et Katz, B. (2012). Rapid head-related transfer function adaptation using a virtual auditory environment. Journal of the Acoustical Society of America, 131(4).
[Pulkki, 1997] Pulkki, V. (1997). Virtual sound source positioning using vector base amplitude panning. Journal of the Audio Engineering Society, 45(6):456– 466.
[Pulkki, 2001] Pulkki, V. (2001). Localization of amplitude-panned virtual sources ii: Two-and three-dimensional panning. Journal of the Audio Engineering Society, 49(9):753–767.
[Zotter et al., 2012] Zotter, F., Pomberger, H. et Noisternig, M. (2012). Energy-preserving ambisonic decoding. Acta Acustica united with Acustica, 98(1):37– 47.