HAL Id: dumas-03149876
https://dumas.ccsd.cnrs.fr/dumas-03149876
Submitted on 23 Feb 2021HAL is a multi-disciplinary open access archive for the deposit and dissemination of sci-entific research documents, whether they are pub-lished or not. The documents may come from teaching and research institutions in France or abroad, or from public or private research centers.
L’archive ouverte pluridisciplinaire HAL, est destinée au dépôt et à la diffusion de documents scientifiques de niveau recherche, publiés ou non, émanant des établissements d’enseignement et de recherche français ou étrangers, des laboratoires publics ou privés.
Evaluation of event-based internet biosurveillance for
multi-regional detection of seasonal influenza onset
Iris Ganser
To cite this version:
Iris Ganser. Evaluation of event-based internet biosurveillance for multi-regional detection of seasonal influenza onset. Santé publique et épidémiologie. 2020. �dumas-03149876�
2
ndyear of the Master Sciences, Technologies, Santé:
Santé Publique - Parcours Public Health Data Science
Evaluation of event-based internet
biosurveillance for multi-regional
detection of seasonal influenza onset
A thesis presented from
The surveillance lab, McGill University
to
The Digital Public Health Graduate Program, University of Bordeaux
Submitted on June 3
rd, 2020
By Iris Ganser
Supervisors:
Dr. David Buckeridge, Professor
Dr. Rodolphe Thiébaut, Professor
Funding by PIA3 (Investment for the future)
ii
Abstract
Infectious diseases remain a major public health problem worldwide. Hence, event-based surveillance (EBS) was developed to allow more timely detection of infectious disease outbreaks using web-based data, but EBS systems have never been evaluated on a global scale. Thus, the objective of this thesis is to evaluate the ability of EBS to detect epidemic outbreaks of influenza in 24 countries worldwide. Additionally, factors influencing system performance will be identified. Data were obtained from two EBS systems, HealthMap and EIOS. Publicly available weekly virological influenza data were gathered from the FluNet platform as gold standard data. Bayesian change point analysis was used to detect the beginning and end of influenza epidemics. Then, evaluation metrics were calculated, with timely sensitivity, i.e. outbreak detection within the first two weeks after onset, as the main outcome of interest. System performance varied widely between countries and systems, and timely detection of outbreaks was poor in both systems, with HealthMap showing consistently better performance than EIOS. Whereas data abundance influenced the performance of both systems, the human development index (HDI) was influential for HealthMap, and EIOS performance was dependent on a country’s geographical location. It could be shown that application of biosurveillance methods to the frequency of online media reports about influenza from two EBS was not able to detect seasonal influenza outbreaks in a timely manner. However, extraction and analysis of additional information from online media and the integration of EBS with other data sources may help to attain this goal.
Keywords: event-based surveillance, influenza, internet, public health surveillance, Bayesian change point analysis
iii
Acknowledgements
I would like to express my deepest gratitude to my supervisors, Dr. David Buckeridge and Dr. Rodolphe Thiébaut for their valuable input and continuous guidance during my thesis. I wish to thank Dr. Buckeridge for providing his public health surveillance expertise, excellent insights, and consistent support during this process. I would also like to express my gratitude for his financial support through a stipend. I would like to thank Dr. Thiébaut for his great motivational encouragement, his continuous feedback and his support especially with statistics. I am very thankful to both for supporting my double degree.
My thanks go to all members and the administrative staff of the surveillance lab for creating a stimulating and inclusive working atmosphere. Thanks for all the snacks and the chats!
I would like to thank Dr. Clark Freifeld from HealthMap and Johannes Schnitzler from EIOS for sharing the data from their respective systems for this project with me.
Thanks to the EBOH department at McGill and DPH team at the University of Bordeaux for making the double degree possible. It was such a great experience for my personal as well as my professional development, and I am very grateful for this opportunity.
I would also like to thank my friends for their unwavering support, for all the laughs, good talks and distractions, whether we are physically close to each other or not.
Finally, I would like to express my gratitude to my family for their unconditional support of whichever goals I pursue and wherever I choose to go. Without you, none of this would have been possible.
iv
Table of Contents
Abstract ... ii Acknowledgements ... iii Table of Contents ... iv List of abbreviations ... vi 1 Introduction ... 11.1 Infectious disease surveillance and biosurveillance systems ... 1
1.1.1 Why do we need infectious disease surveillance? ... 1
1.1.2 Traditional public health surveillance ... 1
1.1.3 Event-based biosurveillance ... 2
1.2 Influenza surveillance ... 3
1.2.1 Influenza as proxy for other diseases ... 3
1.2.2 Virological characteristics ... 4
1.2.3 Influenza forecasting ... 4
1.3 Similar studies ... 5
1.3.1 Usage of HealthMap and EIOS ... 5
1.3.2 Evaluation of EBS systems ... 5
1.4 Objectives ... 6
2 Methods ... 8
2.1 Data ... 8
2.1.1 Countries ... 8
2.1.2 FluNet: the reference ... 8
2.1.3 HealthMap ... 8
2.1.4 EIOS ... 9
2.1.5 Predictors for regression analysis...10
2.2 Outbreak detection ...10
2.2.1 Methodological requirements ...10
2.2.2 Bayesian change point analysis ...11
2.2.1 Determination of start and end points of epidemics ...12
2.3 Performance evaluation metrics ...14
2.4 Regressions ...15
3 Results ...17
3.1 FluNet Data ...17
3.2 EBS total count data ...18
3.3 Visual correlation between EBS systems and gold standard over time ...19
3.4 Outbreak detection ...20
3.4.1 FluNet ...21
3.4.2 EBS systems ...21
3.5 Evaluation of outbreak detection performance ...22
v
3.5.2 Performance measured in composite metrics ...24
3.5.3 Comparison system performance with a count limit ...25
3.6 Detection of country factors influencing system performance ...26
3.6.1 Correlations between outcomes and predictors ...26
3.6.2 Linear regressions ...27
3.6.3 Logistic regressions...28
3.6.4 Robustness analysis of variable selection ...29
4 Discussion ...31
4.1 Principal findings ...31
4.1.1 How did the systems perform? ...31
4.1.2 Which factors influenced system performance? ...32
4.1.3 Differences between HealthMap and EIOS ...33
4.2 Comparison with other studies ...34
4.3 Strengths ...36
4.4 Limitations ...37
4.5 Future research ...39
4.6 Conclusions and recommendations ...40
5 Conclusion on my experience as a professional ...41
6 References ...42
vi
List of abbreviations
AIC Akaike Information Criterion
BCP Bayesian change point analysis
bcp R package for Bayesian change point analysis
CCDSS Canadian Chronic Disease Surveillance System
CDC Centers for Disease Control and Prevention
COVID-19 Coronavirus Disease of 2019
csv Comma-separated values
DENV Dengue Virus
EARS Early Aberration Reporting System
EBS Event-based surveillance
EI Epidemic Intelligence
EIOS Epidemic Intelligence from Open Sources
EWMA Exponentially Weighted Moving Average
FAR False Alarm Rate
GFT Google Flu Trends
GISRS Global Influenza Surveillance and Response System
GPHIN Global Public Health Intelligence Network
HA Hemagglutinin
HDI Human Development Index
IBS Indicator-based surveillance
ICD International Classification of Diseases
IHR International Health Regulations
ILI Influenza-like Illness
LASSO Least Absolute Shrinkage And Selection Operator
MCMC Markov Chain Monte Carlo
MediSys Medial Information System
MERS Middle East Respiratory Syndrome
ML Machine Learning
MRSA Methicillin-resistant Staphylococcus aureus
NA Neuraminidase
NTSS National Tuberculosis Surveillance System
PFI Press Freedom Index
PPV Positive Predictive Value
ProMed Program for Monitoring Emerging Diseases
RNA Ribonucleic Acid
ROC Receiver Operating Characteristic
SARS Severe Acute Respiratory Syndrome
TIU Total Internet Users
UK United Kingdom of Great Britain and Northern Ireland
US/USA United States of America
1
1 Introduction
1.1 Infectious disease surveillance and biosurveillance systems
1.1.1 Why do we need infectious disease surveillance?
Even in the 21st century, infectious diseases continue to threaten populations worldwide. Newly
emerging and re-emerging pathogens, microbial drug resistance, and increased opportunities for pathogens to spread through demographic explosion, massive urbanization, and growing global mobility represent new challenges for a global, interconnected community [1]. As diseases affect not only individuals, but also have detrimental effects on whole societies and economies, the prevention and control of infectious diseases is of utmost importance. The ongoing novel coronavirus (SARS-CoV-2) pandemic demonstrates clearly our susceptibility to emerging pathogens.
To respond to the changing environment, the World Health Organization (WHO) released the third edition of the International Health Regulations (IHR) in 2005 in order to strengthen international disease surveillance and control disease outbreaks before they spread [2]. The revised IHR provide an international legal framework for early detection of infectious disease outbreaks by biosurveillance and timely response to them. Early detection is critical to alert health services in a timely manner, and thus to mitigate the impact on morbidity and reduce mortality and economic costs. In this context, public health surveillance is defined by the IHR as “the systematic on-going collection, collation and analysis of data for public health purposes and the timely dissemination of public health information for assessment and public health response as necessary” [2].
1.1.2 Traditional public health surveillance
Traditionally, disease surveillance is carried out by national or supranational public health networks using test results from laboratories [3], [4]. This type of surveillance is also called indicator-based surveillance (IBS). It is based on reporting of individual cases or counts of diseases by sentinel physicians, general practitioners, hospitals, and clinical laboratories. Thus, IBS results in formal and structured data for only a few diseases. The Canadian Chronic Disease Surveillance System (CCDSS) and HIV/AIDS Surveillance System, the American National Tuberculosis Surveillance System (NTSS), and the LaboVIH by Santé Publique France (the French National Institute for Public Health) are all examples of traditional surveillance systems. While these systems are very specific and allow for the estimation of incidence and prevalence, they are resource-heavy, can have a considerable reporting time lag, and lack sensitivity, especially for novel pathogens. For example, the official influenza surveillance data collected by governmental agencies and published by the WHO on the FluNet platform lag behind current flu activity for approximately 2 weeks [5], [6].
2
1.1.3 Event-based biosurveillance
Due to the limitations of IBS, a multitude of event-based surveillance (EBS) approaches have been developed in recent years, with the goal of near real-time detection of infectious disease outbreaks. A “health event” is defined as any disease outbreak or other occurrence of public health concern [7]. By broadening the focus from specific diseases and counting cases to health events, more timely and complete disease surveillance is possible. EBS has been made possible by two technological advancements in surveillance capacity during the past two decades, namely syndromic surveillance and digital disease surveillance. In order to identify possible outbreaks, syndromic surveillance attempts to detect unusual patterns of health-related events that precede disease confirmation or reporting to official entities [7], [8]. For this purpose, it uses both official and unofficial data such as ICD codes [9], physician billing [10], nurse calls [5], or drug sales [11]. Digital surveillance relies on internet and computer technologies to identify health-related events. For example, Google search queries have been exploited to monitor infectious diseases such as influenza [5], dengue [12], viral gastroenteritis [13], [14], Methicillin-resistant Staphylococcus aureus (MRSA) [15], and tuberculosis [16], and Twitter has been used to track influenza [17]–[19] or dengue outbreaks [20]. Syndromic and digital surveillance are not mutually exclusive, but their applications often overlap and complement each other. A key feature of all EBS inputs is that their initial purpose was not biosurveillance. EBS has not been developed to replace IBS, but rather complement it in detecting and identifying health threats [21], a process also called “epidemic intelligence” (EI). However, so far EBS is only used in an informal manner, as the data originating from it have yet to be meaningfully integrated in a formal, quantitative manner.
Approaches to digital disease surveillance vary according to the targeted streams of information, and differ between various biosurveillance systems. Several web-based biosurveillance systems have been developed in recent years by public health organizations and academic institutions [22], [23], such as ProMed Mail [24], GPHIN by Health Canada [25], [26], HealthMap [27], BioCaster [28], MediSys [29], and EIOS by the WHO [30]. The focus in this project will be on data from HealthMap and EIOS due to their availability from public sources and through existing collaborations.
In addition to rapid disease activity detection, internet biosurveillance provides the benefit of greater coverage in regions with fewer medical centers or lower health-seeking behaviors [31]. Moreover, it is cost-efficient because it requires less human curation. Several examples confirm that internet biosurveillance systems are indeed capable of timely disease detection: GPHIN was the first system to detect unusual activity of respiratory illness in the Guangdong Province in China, which later proved to be Severe Acute Respiratory Syndrome (SARS) [25], as well as the 2012 outbreak of Middle East Respiratory Syndrome Coronavirus (MERS-CoV)
3 [32]. Likewise, ProMed Mail reported the first information on the 2014 Ebola epidemic [33], and monitoring Twitter in Nigeria during the Ebola outbreak in West Africa helped to identify an outbreak three days prior to a news alert and seven days before an official WHO announcement [34].
However, digital disease surveillance systems face their own unique challenges: First, their sources might not be reliable, thus creating false positive signals. Moreover, the sources’ signal-to-noise ratio is normally very low, so non-specific information complicates signal detection [35], [36]. Second, the sources may not be sensitive enough to pick up specific disease outbreaks because some diseases are not newsworthy enough. Third, as all systems rely on data from the internet, they are highly dependent on internet coverage and adaption in the countries of operation. Fourth, most systems are heavily language-dependent. For example, HealthMap mainly scans news articles in Arabic, Chinese, English, French, Portuguese, Russian, and Spanish, thus, signals in other languages are missed [37]. Furthermore, since most systems are developed in English, the signal detection sensitivity is greatest in English [38]. Fifth, great media attention for certain diseases or rumors can create false positive signals. Redundancy of information can lead to overestimation of importance, as many news sources report the same events [39]. Sixth, most of the time,
the data is not detailed and reliable enough to provide epidemiological parameters like incidence [40]. Thus, it is necessary to evaluate the EBS systems’ performance in general and for specific diseases.
1.2 Influenza surveillance
1.2.1 Influenza as proxy for other diseases
To evaluate how sensitive the systems are in picking up signals on developing outbreaks and how timely they are in detecting these outbreaks, seasonal influenza was used as a proxy for infectious diseases in this project. Influenza was chosen because of its occurrence in multiple countries worldwide, its potential to cause severe epidemics or even pandemics, and its close surveillance and ongoing modeling efforts mostly in rich Western countries [41]. Furthermore, the WHO provides publicly available laboratory-confirmed virological influenza data on a country level on the FluNet platform [42], which can be used as gold standard data for comparisons.
Influenza is tightly monitored because seasonal influenza epidemics are a serious global health threat, causing an estimated annual 3 to 5 million of severe disease cases, and 290,000 to 650,000 respiratory deaths worldwide each year [43]. Moreover, potential emerging influenza strains are a major public health concern, as they could cause influenza pandemics with millions of fatalities.
4
1.2.2 Virological characteristics
Influenza viruses belong to the family of Orthomyxoviridae, which possess a segmented, single-stranded, negative-sense RNA genome. Because the genome is arranged in segments, RNA strands from multiple viral subtypes can be re-assorted, thus generating viruses with novel genetic combinations. This process is called antigenic shift, and can lead to emergence of new viral variants. The other driving factor of emergence of new influenza viruses are frequent mutations, a virological concept also known as antigenic drift [44]. Based on their molecular properties, influenza viruses are subdivided into types A, B, and C. Seasonal epidemics are caused by influenza A and B viruses, whereas type C viruses only cause mild symptoms [44]. Influenza A subtypes are further classified by their hemagglutinin (HA) and neuraminidase (NA) surface protein combination (e.g. H7N9), and B viruses are not further classified, but broken down into lineages (e.g. Victoria). So far, pandemics have only been attributed to influenza type A viruses [43]. Additionally, influenza A infections of poultry, swine, and horses have zoonotic potential [44].
In humans, influenza viruses are rapidly transmitted through infectious droplets or virus-containing aerosols. Once a person is infected, they usually experience a sudden onset of upper respiratory tract illness. Based on the major symptoms, influenza-like illness (ILI) is defined by the CDC as a fever of 100°F (37.8˚C) or greater, cough and/or a sore throat in the absence of a known cause other than influenza [45]. While most people recover from their illness within a week without requiring medical attention, influenza infections can be severe or even fatal in individuals at high risk, such as the elderly, children, pregnant women, and individuals with chronic medical conditions [43].
Influenza infections in temperate regions follow a strong seasonal pattern, where viral activity is centered at one epidemic during the respective winter months. In contrast, in regions close to the equator, influenza infections are endemic. Based on these seasonal patterns, the WHO has defined 18 global influenza transmission regions [46].
1.2.3 Influenza forecasting
IBS data on influenza are predominantly used for monitoring the influenza disease burden, planning and implementation of prevention programs, providing candidate viruses for vaccine production, and resource allocation [42], [47], [48]. Additionally, IBS data are combined with EBS data in models for nowcasting and forecasting influenza activity. Predicted measures typically include season onset, peak week timing, peak intensity, and influenza activity in the next weeks in order to detect unusual or unexpected influenza activity and to prepare the health system for epidemics [41], [49], [50]. Most of the efforts are focused on either North America or Europe [41], [51], [52], such as the CDC flu forecasting challenge [49]. Another example is HealthMap Flu Trends, which publishes real-time estimates of influenza activity in the USA on
5 a freely available website [53], [54]. HealthMap has also been used as one of seven data sources for short-term forecasting of ILI case counts in South America [55].
1.3 Similar studies
1.3.1 Usage of HealthMap and EIOS
As one of two EBS systems of interest in this work, HealthMap has
been used as an EBS data source for surveillance and forecasting of hantavirus in South America [56], tracking Ebola spread during the West African Ebola epidemic [57] and MERS during the 2012 outbreak [58], and estimating and forecasting Zika virus incidence in South America [59], [60], amongst others. During the ongoing SARS-CoV-2 pandemic, HealthMap provides an interactive map with near real-time updates of geolocated case counts1, and
sounded one of the first alarms of unusual respiratory disease activity in Wuhan on December 30th, 2019, although it was initially dismissed as non-significant [61].
The other EBS system of interest in this work, EIOS, has only been implemented in 2017 and is not publicly available. Thus, only very few publications using EIOS as a data source exist, such as a study by Garten et al, who found that a quarter of infectious disease outbreaks in Africa in 2018 were detected by media monitoring, partly through EIOS [48]. Nevertheless, the EIOS platform is hosted by the WHO and used by public health agencies worldwide [62].
1.3.2 Evaluation of EBS systems
Despite their widespread use, there is not much published evidence about the performance characteristics of EBS systems in terms of disease outbreak detection. Rather, the focus of most of the available literature is on the adequate classification of health-related events from online sources or on the implementation of innovative functionalities [63]. In the first publications about the development of HealthMap, the filtering workflow was described and the accuracy of event classification was assessed, but no validation studies of outbreak detection performance were conducted [64], [65]. Similarly, Dion et al. described the ability of GPHIN to early detect outbreaks of H1N1 and MERS and provide situational awareness (such as information on flight cancellations, border closures, and trade bans) during Ebola and H1N1 epidemics, but did not conduct a formal performance evaluation of GPHIN [32]. This is even more surprising regarding the fact that GPHIN supplied approximately 40% of the WHO’s early warning outbreak information in the early 2000s [66]. Similarly, to my knowledge no evaluation or proof of principle of outbreak detection has been published for EIOS.
6 Several authors have criticized the lack of evaluative studies, asking for performance assessment of EBS systems in terms of standardized evaluation criteria against a gold standard [23], and research on the impact of these systems on public health response, epidemic control, and clinical care [67]. In one of these rare studies, Lyon et al. compared the performance of the EpiSPIDER, BioCaster and HealthMap systems in terms of event numbers and distribution, but did not conduct an analysis of outbreak detection functionality [37]. Barboza et al. compared and evaluated six EBS systems operating worldwide, among them HealthMap, in two articles [63], [68]. The first study was focused on the user perspective with a qualitative assessment of metrics such as representativeness, completeness, ease of use, and overall usefulness. Additionally, the authors conducted a quantitative analysis based on detection of H5N1 events in March 2010, in which the detection rate, positive predictive value, sensitivity and timeliness were evaluated [68]. In the second study, the six EBS systems were compared to a gold standard in their ability to detect 23 infectious disease outbreaks, and characteristics associated with detection ability, such as filter languages, types of disease, and regions of occurrence, were identified [63].
In contrast, other web-based sources, such as Google search queries, health-related tweets, or Wikipedia article views, employed by researchers for timely disease detection, are frequently evaluated against traditional surveillance systems regarding their correlation, sensitivity, timeliness, positive predictive value, or forecasting error [19], [67], [69]–[73]. This leads to the paradoxical situation where there is more evidence about experimental data sources and models than about the EBS systems used by official public health entities to guide public health responses and clinical care.
1.4 Objectives
Therefore, as a first objective, this work aims at evaluating the performance of the HealthMap and EIOS systems regarding their ability to detect infectious disease outbreaks. This evaluation is narrow in a sense that it covers only one aspect in which EBS can be used to detect outbreaks. Other approaches like human searching and review of articles are used too, but not covered in this work. Twenty four countries worldwide were chosen to appraise the systems on a global scale and to shift the focus away from rich Western countries, in which most of the disease detection efforts have been concentrated so far. As a proxy for other diseases, influenza will be the agent of interest because it occurs in multiple countries worldwide, albeit with different seasonal patterns, and because laboratory-confirmed influenza counts are available as an accurate gold standard.
As the relative performance of the EBS systems across influenza regions and countries has not been documented, influenza outbreaks in the gold standard and EBS datasets will be identified, and the outbreak detection capabilities of HealthMap and EIOS will be assessed in
7 terms of sensitivity, specificity, positive predictive value, and timeliness. The metrics will be compared across systems and countries.
As a second objective, factors influencing the detection ability, such as a country’s language, wealth, or geographical location, will be identified. The strength of associations of various country-specific characteristics with the evaluation metrics will be assessed in univariable and multivariable regressions.
The results will be of value for the developers of the systems to guide technical improvements. This is especially important for EIOS, since it is still in the development phase. Additionally, the results can guide public health professionals in deciding how the systems can be reliably used for timely detection of influenza epidemics, and potentially epidemics of other infectious diseases.
8
2 Methods
2.1 Data
2.1.1 Countries
Twenty four countries from 15 influenza transmission zones were chosen to evaluate the performance of event based surveillance (EBS) on a global scale: Argentina, Australia, Brazil, Bulgaria, China, Costa Rica, Ecuador, Egypt, France, Germany, Greece, India, Iran, Mexico, Nigeria, Russia, Saudi Arabia, South Africa, Sweden, Thailand, United Kingdom, United States, Uruguay, and Vietnam. These countries were selected to represent a broad spectrum of geographical locations, languages, and developmental stages.
2.1.2 FluNet: the reference
FluNet is a web-based tool for virological influenza surveillance created by the WHO, and will serve as the reference to evaluate EBS systems. On the FluNet website2, the WHO provides
weekly data on influenza activity by country to the public. These data are gathered from all participating Global Influenza Surveillance and Response System (GISRS) countries, other national influenza reference laboratories which are collaborating with GISRS, and from WHO regional databases [42]. For GISRS, 140 National Influenza Centres around the world collect and test clinical specimens on influenza positivity and submit their results and a sample of these specimens to WHO Collaborating Centres for further characterization [74]. FluNet is used as a tool to explore influenza activity patterns worldwide and guide vaccination programs [42], [47], [75], [76].
FluNet provides publicly available graphs of lab-confirmed influenza cases per country and corresponding csv files since 1997. The csv files include country-specific information such as the WHO region and influenza transmission region, the date and number of received and processed specimen, total number of influenza-positive and negative samples, and a breakdown of these numbers by influenza strain. For the analyses, csv files for 23 countries providing influenza data from January 2013 to December 2019 were downloaded. The only exception was Saudi Arabia, where FluNet data were only available as of January 2017. Since measurements are highly specific, counts from these influenza surveillance data were used as a gold standard against which the EBS system counts were evaluated.
2.1.3 HealthMap
The HealthMap system was developed by researchers at the Boston Children’s Hospital, launched in 2006, and provides real-time surveillance on infectious diseases [15]. It collects
9 data from online news aggregators, expert-moderated systems such as ProMed Mail, and validated alerts from official sources such as the WHO. Through automated text processing algorithms in 15 languages, the system filters for disease and location, and publishes the results on a freely available website3 [12], [20].
Csv files with event data dating from January 2013 to July 2019 were provided by researchers from the HealthMap project group. Any news article which has passed through HealthMap’s filtering algorithm and relates to the “human influenza” keyword is referred to as an event. The data files include information about the event’s location, the news article headline, a link to the full article, a short article snippet, the news source, and the issue and load date of the article onto the HealthMap platform.
Since every event was identified with a unique HealthMap ID, duplicate events (i.e. articles with exactly the same content, but not different articles about the same event) were removed using this ID information (9012 out of 31796 total events were removed). Additionally, events concerning countries’ overseas territories (such as Bermuda, Guadeloupe or Guam) were also discarded, resulting in a total of 22722 unique events in the 24 countries of interest. Since the FluNet gold standard data are only available in weekly intervals, the daily event counts from HealthMap were also aggregated into a weekly format, resulting in a total of 341 weekly data points spanning 6.5 years.
2.1.4 EIOS
Recently, the WHO implemented the Epidemic Intelligence from Open Sources (EIOS) system as a collaboration between multiple public health organizations, acting on a global scale. Its purpose is to integrate data from multiple EBS systems and thus to provide a “unified, all-hazards, One Health approach by using open source information for early detection, verification and assessment of public health risks and threats” [30]. Amongst others, GPHIN, Eurosurveillance, various ministries of health, and big news aggregators are sources for EIOS. Notably, one of the input sources of EIOS is HealthMap, so HealthMap is a proper subset of EIOS. Again, every article that passes through the filtering algorithm and is published on the EIOS platform is referred to as an event. Event de-duplication is performed before the events are uploaded to the website. The EIOS platform is not open to the public, but access was made available through collaborations with the EIOS team. They provided data for every day from November 11, 2017 (the day of EIOS implementation) to December 2019, totaling 109 weeks.
All EIOS events with the following keywords were retrieved and compiled into one file: “Influenza virus not identified” (includes unspecified influenza A), “H1N1”, “H1N1v”, “H1N2”,
10 “H1N2v”, “H2N1”, “H2N2”, “H3N2”, and “H3N2v”. The EIOS file provided data on fetch and import dates of each event, the title, URL and full text of each news article, and information about the news source such as name, country, language, disease category, and mentioned countries. Additionally, an EIOS ID was used as a unique identifier for each event. Since most events mentioned multiple countries, the reports were duplicated so that each row contained only a single country, and then filtered for the 24 selected countries of interest. Additionally, all events without a date stamp were removed from the analysis (320 out of 81133 total events). Like the HealthMap events, EIOS events were aggregated to counts per week per country in order to be able to compare them to the gold standard.
2.1.5 Predictors for regression analysis
Most predictor variables for regression analysis were inherent to the data, such as total counts, geographical locations, and languages. Other predictors were the Human Development Index (HDI) of each country, the total number of internet users (TIU) per country, and the Press Freedom Index (PFI) of each country. HDI rankings from 2018 and the TIU per country in 2017 were obtained from the United Nations Development Programme [77]. TIU is expressed as the percentage of a country’s population having access to the internet. The HDI is a composite measure taking into account three dimensions of human development – life expectancy, education, and wealth. It ranges from 0 to 1, with a HDI of less than 0.550 for low human development, 0.550–0.699 for medium human development, 0.7–0.799 for high human development and 0.8 or greater for very high human development.PFI data were downloaded from Reporters without Borders [78]. The PFI compiles a number of indicators about freedom of journalism, such as media independence, censorship, and acts of violence against journalists. It ranges from 0 to 100, with higher rankings representing lower press freedom.
2.2 Outbreak detection
2.2.1 Methodological requirements
Outbreak detection had to be performed in the gold standard data as well as in HealthMap and EIOS data because FluNet did not provide a consistent epidemic indicator. Outbreaks were analyzed retrospectively, i.e. the detection method was applied on the whole dataset. The challenge with selecting a method was that for most historical limit approaches, a predefinition of epidemic and non-epidemic phases is needed, which is exactly the desired outcome [79], [80]. In addition to that, the outbreak detection method must not require a long training period, as data are limited, especially for the EIOS system (only 2 years). Moreover, the method should not attempt to model seasonality, as this might mask outbreaks, and will certainly pose problems for application on a global scale, since tropical countries do not show a clear seasonality. Also, influenza seasons are in different months for Northern and Southern hemisphere countries, and some countries have two or more epidemic seasons per year.
11
2.2.2 Bayesian change point analysis
Therefore, Bayesian change point analysis was the method of choice for outbreak detection. A visual example workflow of the outbreak detection which is described in the following section can be found in Figure 1. Although not initially developed for infectious disease outbreaks [95], [96], change point analysis has been used before to determine start points of influenza epidemics [69], [97]. Essentially, change point methods examine when a change occurs in a series of observations by detecting time points before and after which statistical properties differ. BCP analysis was initially developed by Barry and Hartigan [96] and implemented in R as the package bcp by Erdman and Emerson [95], [98]. An excellent theoretical description of the method is provided in those papers.
In BCP analysis, it is assumed that a series of observations is divided into a partition 𝜌. Each 𝜌 consists of an unknown number of blocks with equal parameter values (Figure 1 top left). Because the implementation in the R package bcp assumes a Normal distribution of observation values, the parameters used in this instance are the mean and variance. In order to detect changes, BCP analysis examines the mean of the observations (i.e. weekly number of positive influenza samples for FluNet and weekly number of events for HealthMap and EIOS) before and after a potential change point 𝑖. Thus, the time series of observations is divided into 𝑏 blocks, with the last observation before each block being referred to as a change point. Consequently, a block starts at observation 𝑖 + 1 and ends at observation 𝑗.
With the Bayesian approach, the objective is to estimate the posterior probability of point 𝑖 being a change point (𝑝𝑖), as well as the posterior mean and variance at each 𝑖. The prior for
the distribution of 𝜇𝑖𝑗(the mean for each block) is chosen as 𝑁(𝜇0, 𝜎02
𝑗−𝑖). This choice of prior
requires larger deviations from 𝜇0 for shorter blocks in order for a change point to be flagged
at position 𝑖.
Although Barry and Hartigan presented an exact calculation of the parameters, the calculation time for the parameters is O(n³). Therefore, the parameters and positions of change points are estimated with a Markov Chain Monte Carlo (MCMC) approximation, which is only O(n). For each observation 𝑖, the following formula is applied:
𝑝𝑖 1 − 𝑝𝑖 = 𝑃(𝑈𝑖= 1|𝑋, 𝑈𝑗, 𝑗 ≠ 𝑖) 𝑃(𝑈𝑖= 0|𝑋, 𝑈𝑗, 𝑗 ≠ 𝑖) = [∫ 𝑝𝑝0 𝑏(1 − 𝑝)𝑛−𝑏−1𝑑𝑝 0 ] [∫ 𝑤𝑏2 (𝑊1+ 𝐵1𝑤) 𝑛−1 2 𝑑𝑤 𝑤0 0 ] [∫ 𝑝𝑝0 𝑏−1(1 − 𝑝)𝑛−𝑏𝑑𝑝 0 ] [∫ 𝑤𝑏−12 (𝑊0+ 𝐵𝑜𝑤) 𝑛−1 2 𝑑𝑤 𝑤0 0 ] (1)
where 𝑈𝑖 = 1 indicates a change point at position 𝑖 + 1, and 𝑈𝑖 = 0 indicates no change point.
12 point at each position and the signal-to-noise ratio, respectively. 𝑏 is the number of blocks found if 𝑈𝑖 = 0. 𝑊1 and 𝑊0 are the within-block sum of squares when 𝑈𝑖 = 1 and 𝑈𝑖 = 0,
respectively. Likewise, 𝐵1 and 𝐵0 are the between-block sum of squares. 𝑤 = 𝜎2
𝜎02+𝜎2 where 𝜎0
2 is
the overall variance and 𝜎2 is the variance of the block observations, so 𝑤 represents the
signal-to-noise ratio. Intuitively, 𝑝𝑖 is larger when 𝑊1 small and 𝐵1 is large.
At each step of the Markov chain, a value for 𝑈𝑖 is drawn from the conditional distribution of 𝑈𝑖,
given the data and the current segmentation of observations into blocks. Based on these values, 𝑝𝑖 is calculated with ((1). After every MCMC iteration, 𝑝𝑖 and the posterior mean of each
block are updated. The posterior mean for every block is calculated with the formula 𝜇̂𝑖𝑗=
(1 − 𝑤)𝑋̅𝑖𝑗+ 𝑤𝜇0, where 𝑤 = 𝜎2
𝜎02+𝜎2 and 𝑋̅𝑖𝑗 is the mean of the observations in the block 𝑏𝑖𝑗.
All analyses were conducted using the R package bcp, version 4.0.3 [98]. Assumptions of bcp are that observations are distributed independently 𝑁(𝜇𝑖, 𝜎2) in different blocks, given the
parameters, and that 𝑝𝑖 is independent at each observation, conditional on the partition. In
contrast to the assumptions, influenza case counts and EBS event counts followed an over-dispersed Poisson rather than a Normal distribution. However, counts during epidemic and non-epidemic periods obviously have different means, so BCP analysis is able to clearly separate them from each other. Nevertheless, BCP usually detected several changes in mean during epidemic periods, so 𝑝𝑖 is high for many points during rising and falling epidemic curves.
The posterior means 𝜇̂𝑖𝑗 and the posterior probabilities of a change point 𝑝𝑖 were estimated
with 600 MCMC iterations, where the first 100 MCMC iterations were discarded as burn-in (Figure 1 top right). The tuning parameters of the priors p0 (change point probability) and w0
(signal-to-noise ratio) were kept at their default value of 0.2. These values have been found to work well in the past [96], and neither HealthMap nor EIOS data were sensitive to changing priors (see figures Figure 9Figure 10 in the appendix).
2.2.1 Determination of start and end points of epidemics
As multiple change points were flagged during outbreaks (Figure 1 bottom left), criteria were established to determine the start and end points of influenza outbreaks. The criteria were as follows:
Start points: rising count curve, no outbreak start flagged during previous 15 weeks, transition from p < 0.5 to p > 0.5 (i.e. first change point after a non-epidemic period). End points: falling count curve, no outbreak end flagged during preceding 15 weeks,
13 0.5 is the intuitive and widely used posterior probability threshold for determining change points. Nevertheless, receiver operating characteristic (ROC) curves of a sequence of thresholds were plotted to check for the best threshold. For low-count countries, thresholds did not matter at all, while for higher count countries, 0.5 was a good compromise between all countries (see Table 7 in appendix). For reasons of simplicity and generalizability, cutoffs at the optimal thresholds for each country were not established.
Figure 1: Workflow of outbreak detection with BCP exemplified for one country. (A) The time series of weekly
aggregated influenza cases for the USA is plotted. This is the raw data. (B) The observations are colored according to the posterior probability of a change point at each observation. This step is after running the BCP analysis. (C) The position of all change points (posterior probability > 0.5) is visualized with vertical dashed lines. (D) After applying criteria for start and end points of epidemics, the time series is divided into epidemic (red) and non-epidemic (grey) seasons. Start points of non-epidemics are plotted as orange vertical lines, end points as green vertical lines.
In order to disregard local spikes or drops in the count data, rising and falling curves were determined by smoothing the time series with Loess smoothing. The window size used for smoothing of FluNet and HealthMap data was chosen as 10%, i.e. 10% of the whole dataset were taken into account, which corresponded to 36 and 34 weeks, respectively. Since the EIOS dataset comprised only 109 weeks, a window size of 15% (16 weeks) was chosen. These time intervals showed a good compromise between smoothing over local spikes or drops in the counts and overall variation in counts.
The 15 week period of no start points before a start point was chosen so that the algorithm would not flag epidemic starts during an ongoing outbreak. On average, influenza epidemics
14 were found to be 3.9 months long, irrespective of climatic regions, with a range of 3-5 months [75]. Regarding the length of the epidemic period and assuming that there is some amount of non-epidemic time between two outbreaks, the period between to ‘ends’ was chosen to be at least 15 weeks as well (Figure 1 bottom right).
When detecting spikes, the algorithm usually flagged an epidemic start point, but often no end point. In order to allow detection of spikes as single outbreak weeks, an ‘end’ was inserted after every ‘start’ that was not followed by an ‘end’ within a period of 30 weeks (which is safely over the 5 months maximum epidemic period found in by Azziz-Baumgartner et al. in [75]).
2.3 Performance evaluation metrics
The EBS system performance was evaluated regarding sensitivity, specificity, positive predictive value, and timeliness. Sensitivity was measured in three ways: Sensitivity per outbreak to evaluate overall detection of outbreaks (equation (2), sensitivity per week to be able to calculate composite metrics (equation (3), and timely sensitivity to combine timeliness and sensitivity for detection of outbreaks within two weeks of the start of an epidemic (equation (4). This last metric is the most relevant because the timely detection of outbreaks is what the EBS systems were designed for. A window of two weeks before and after an outbreak was detected in the gold standard data was chosen so that an alarm would be raised before or at the time a traditional surveillance system would detect an anomaly. In all equations, “outbreak” refers to a detected outbreak in the gold standard data and “alarm” refers to a detected outbreak in the EBS system data.
𝑠𝑒𝑛𝑠𝑖𝑡𝑖𝑣𝑖𝑡𝑦 𝑝𝑒𝑟 𝑜𝑢𝑡𝑏𝑟𝑒𝑎𝑘 = 𝑛(𝑎𝑙𝑎𝑟𝑚 𝑎𝑡 𝑎𝑛𝑦 𝑡𝑖𝑚𝑒 𝑑𝑢𝑟𝑖𝑛𝑔 𝑜𝑢𝑡𝑏𝑟𝑒𝑎𝑘) 𝑛(𝑜𝑢𝑡𝑏𝑟𝑒𝑎𝑘) (2) 𝑠𝑒𝑛𝑠𝑖𝑡𝑖𝑣𝑖𝑡𝑦 𝑝𝑒𝑟 𝑤𝑒𝑒𝑘 = 𝑛(𝑎𝑙𝑎𝑟𝑚 = 1, 𝑜𝑢𝑡𝑏𝑟𝑒𝑎𝑘 = 1) 𝑛(𝑜𝑢𝑡𝑏𝑟𝑒𝑎𝑘 = 1) (3) 𝑡𝑖𝑚𝑒𝑙𝑦 𝑠𝑒𝑛𝑠𝑖𝑡𝑖𝑣𝑖𝑡𝑦 =𝑛(𝑎𝑙𝑎𝑟𝑚 𝑎𝑡 ± 2 𝑤𝑒𝑒𝑘𝑠 𝑜𝑓 𝑜𝑢𝑡𝑏𝑟𝑒𝑎𝑘 𝑜𝑛𝑠𝑒𝑡) 𝑛(𝑜𝑢𝑡𝑏𝑟𝑒𝑎𝑘) (4)
Timeliness was calculated as the mean of prevented fraction of outbreaks
to circumvent the problem of non-detected outbreaks. The prevented fraction is the proportion of time of an outbreak saved by detection by the EBS system relative to the onset of the outbreak [99]. If an outbreak is detected, it is calculated as:
𝑡𝑖𝑚𝑒𝑙𝑖𝑛𝑒𝑠𝑠 (𝑝𝑟𝑒𝑣𝑒𝑛𝑡𝑒𝑑 𝑓𝑟𝑎𝑐𝑡𝑖𝑜𝑛) = 1 − 𝑡𝑎𝑙𝑎𝑟𝑚− 𝑡𝑜𝑛𝑠𝑒𝑡
15 where 𝑡𝑜𝑛𝑠𝑒𝑡 is the onset time of the outbreak, 𝑡𝑎𝑙𝑎𝑟𝑚 is the time of detection by the EBS system
and 𝑜𝑢𝑡𝑏𝑟𝑒𝑎𝑘 𝑑𝑢𝑟𝑎𝑡𝑖𝑜𝑛 is the number of weeks for which an outbreak continues. Thus, timeliness will be 1 if an alarm is raised by the EBS system in the onset week and 0 if an alarm is raised at the end of an outbreak or if the outbreak is not detected by the EBS system at all. As all datasets are comprised of multiple outbreaks, the arithmetic mean of all prevented fractions for each system and country were reported.
Specificity was calculated per week (equation (6), as was the positive predictive value of alarms (equation (7). Additionally, sensitivity and specificity per week were combined into an accuracy metric, which is the sum of all correctly assigned weeks over the total number of weeks (equation (8). Moreover, the F1 score was calculated as the harmonic mean of sensitivity per week (i.e. precision) and positive predictive value (i.e. recall) (equation (9).
𝑠𝑝𝑒𝑐𝑖𝑓𝑖𝑐𝑖𝑡𝑦 𝑝𝑒𝑟 𝑤𝑒𝑒𝑘 = 𝑛(𝑎𝑙𝑎𝑟𝑚 = 0, 𝑜𝑢𝑡𝑏𝑟𝑒𝑎𝑘 = 0) 𝑛(𝑜𝑢𝑡𝑏𝑟𝑒𝑎𝑘 = 0) (6) 𝑝𝑜𝑠𝑖𝑡𝑖𝑣𝑒 𝑝𝑟𝑒𝑑𝑖𝑐𝑡𝑖𝑣𝑒 𝑣𝑎𝑙𝑢𝑒 (𝑃𝑃𝑉) =𝑛(𝑎𝑙𝑎𝑟𝑚 = 1, 𝑜𝑢𝑡𝑏𝑟𝑒𝑎𝑘 = 1) 𝑛(𝑎𝑙𝑎𝑟𝑚 = 1) (7) 𝑎𝑐𝑐𝑢𝑟𝑎𝑐𝑦 = 𝑛(𝑎𝑙𝑎𝑟𝑚 = 1, 𝑜𝑢𝑡𝑏𝑟𝑒𝑎𝑘 = 1) + 𝑛(𝑎𝑙𝑎𝑟𝑚 = 0, 𝑜𝑢𝑡𝑏𝑟𝑒𝑎𝑘 = 0) 𝑛(𝑤𝑒𝑒𝑘𝑠) (8) 𝐹1 = 2 × 𝑝𝑟𝑒𝑐𝑖𝑠𝑖𝑜𝑛 (𝑃𝑃𝑉) × 𝑟𝑒𝑐𝑎𝑙𝑙 (𝑠𝑒𝑛𝑠𝑖𝑡𝑖𝑣𝑖𝑡𝑦 𝑝𝑒𝑟 𝑤𝑒𝑒𝑘) 𝑝𝑟𝑒𝑐𝑖𝑠𝑖𝑜𝑛 (𝑃𝑃𝑉) + 𝑟𝑒𝑐𝑎𝑙𝑙 (𝑠𝑒𝑛𝑠𝑖𝑡𝑖𝑣𝑖𝑡𝑦 𝑝𝑒𝑟 𝑤𝑒𝑒𝑘) (9) 95% confidence intervals for the evaluation metrics were calculated as exact binomial confidence intervals, with the exception of timeliness. Since timeliness was calculated as the mean of the prevented fractions per outbreak, a binomial procedure was not possible. Thus, similarly to the procedure of calculating confidence intervals for odds ratios, the point estimates were logit-transformed, and the standard deviation was determined as
√𝑝𝑟𝑒𝑣.𝑓𝑟𝑎𝑐𝑡𝑖𝑜𝑛 × (1−𝑝𝑟𝑒𝑣.𝑓𝑟𝑎𝑐𝑡𝑖𝑜𝑛)𝑛(𝑜𝑢𝑡𝑏𝑟𝑒𝑎𝑘𝑠) . The 95% confidence intervals were then calculated on the logit scale and back-transformed to the linear scale, thus being bounded between 0 and 1.
2.4 Regressions
Country-specific variables examined as predictors in regressions to test their influence on EBS system performance were: total counts over the data collection period, maximum counts per week, global region (temperate Northern hemisphere, temperate Southern hemisphere or tropical), language (English yes/no), latitude, longitude, human development index, press freedom index, total numbers of internet users and HealthMap filter language (yes/no). No variable for EIOS filter language was set up because EIOS filters in the language of each test
16 country. The logarithm of total and maximum counts was used in regression analysis to ensure linearity between outcome and predictor. The absolute value of latitude was used as a proxy for a country’s climate. All regressions were fit in the software R (version 3.6.3) [100], using the packages base, MASS (version 7.3-51.6) [101], and glmnet (version 4.0) [102]. Additional diagnostic plots were created with car package version 3.0-7 [103].
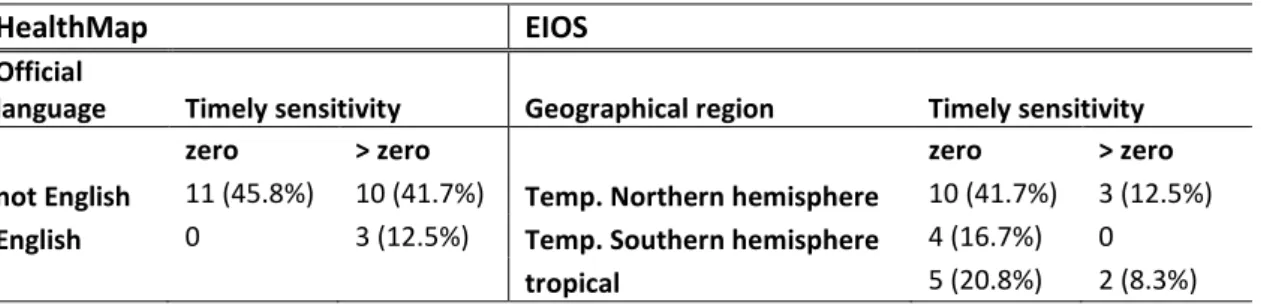
First, to determine the influence of certain country-specific factors on the EBS system performance, univariable regressions were performed with each evaluation metric as outcome and each covariate as a predictor. All assumptions of linear regressions were checked with diagnostic plots. These are: histograms of the residuals to check the Normality assumption, plotting of fitted values against residuals for checking for a linear relationship and homoscedasticity, QQ-plots of the residuals to check for Normality, and leverage plots for outliers. The assumptions of normally distributed errors and linearity between outcome and predictor were not met for timely sensitivity, as zeros were overrepresented in the values. Thus, logistic regressions were performed to see which factors influenced if timely sensitivity was 0 or above 0.
Next, predictors with a p-value below 0.2 in univariable regressions were included in multivariable linear regressions for each evaluation metric, and the variance inflation factors were checked with the R package car (version 3.0-7) [103]. Highly correlated variables were removed from the models until the variance inflation factors were below 4, which is a conservative threshold [104]. Then, for each outcome, influential variables were selected into a final model by a forward selection process, which was based on the models’ Akaike information criterion (AIC).
To see if the variable selection process by AIC was valid, the selection process was repeated using least absolute shrinkage and selection operator (LASSO) regression. However, only the coefficients from the AIC models were reported, since the LASSO coefficients are biased due to shrinkage. LASSO regression was carried out with the glmnet package. The parameter for the amount of the coefficient shrinkage 𝜆 was optimized to the value that minimized the cross-validation prediction error rate. The subset of variables whose coefficients were not shrunk to 0 was then compared to the set of variables obtained through selection with the AIC criterion.
17
3 Results
3.1 FluNet Data
Confirmed virological influenza case counts from over 7 years were collected from FluNet, a traditional influenza surveillance platform. In most countries, the data were abundant and of good quality, although the absolute number of counts varied greatly across countries, reflecting varying testing capacities between countries. While countries fully situated in temperate regions showed one distinct epidemic per year in their respective winter months, some countries spanning multiple climate zones such as India and China showed two epidemic peaks in some years (Figure 2). Countries situated in tropical regions such as Costa Rica and Ecuador displayed more irregular patterns with missing one season or multiple outbreaks per season. In three tropical countries with no clear seasonality (Nigeria, Thailand, and Vietnam), FluNet data were of low quality. The total number of tested individuals and thus positive influenza cases was very low and the background noise was so high that almost no outbreaks were discernible.
Figure 2: Positive case counts for influenza types A, B and total from the FluNet platform plotted as a function of time for 7 years. 6 representative countries from different influenza transmission zones were chosen
18 Plotting FluNet counts over time revealed an interesting interplay between influenza subtypes
A and B. In general, influenza B cases peaked at a slightly different time than influenza A and
case counts were lower, except in the European countries in the season 2017/2018. In some years, influenza B cases preceded or lagged behind the peak of influenza A cases greatly, leading to bimodal peaks of total influenza counts, with one peak for influenza A and one peak for influenza B. Another insight from the FluNet data is that influenza cases have a high year-to-year variability: they do not always peak at the same time of the year, nor do the peaks always have the same height, indicating that influenza epidemics are worse in some years than in others.
Despite data limitations in three countries, total influenza counts were used as gold standard for the following analyses of event-based surveillance (EBS) system performance. Influenza A and B could not be regarded separately because news articles rarely distinguish between influenza subtypes.
3.2 EBS total count data
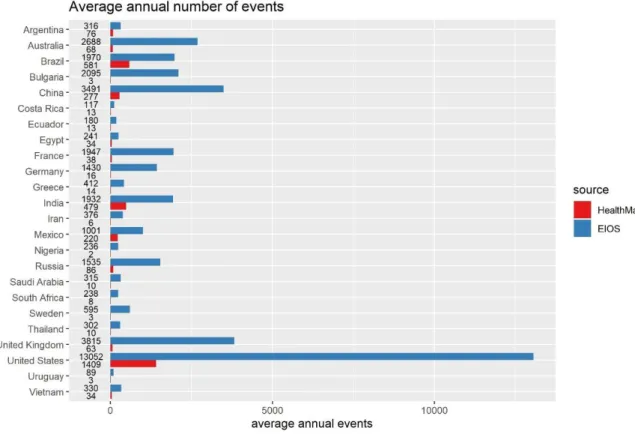
Influenza events were gathered from HealthMap for 6.5 years and from EIOS for 2 years. The average annual number of HealthMap events was lower than the average annual number of events produced by the EIOS system in every country (Figure 3). This difference can be explained by the fact that EIOS receives a great deal more input than HealthMap by not only scraping news aggregators, but also aggregating multiple EBS systems (HealthMap and GPHIN amongst others).
In both systems, the USA was an outlier with the highest number of events by far. Twelve countries had only very sparse event data in HealthMap (Bulgaria, Costa Rica, Ecuador, Germany, Greece, Iran, Nigeria, Saudi Arabia, South Africa, Sweden, Thailand, and Uruguay). Surprisingly, these low count countries were not all developing countries with low internet usage and poor health systems, but also included rich, Western countries. However, this observation can be explained by the fact that HealthMap does not filter for news articles in the official languages of these countries. In contrast, EIOS filters for all the official languages of the 24 countries evaluated, thus filtering language cannot be a factor affecting EIOS count numbers. Nevertheless, EIOS also shows large differences in total counts between countries, with low count countries mostly situated in tropical regions.
19 Figure 3: Average annual counts per country of EIOS and HealthMap systems over 2 and 6.5 years, respectively. Every news article picked up by the systems is counted as an event.
3.3 Visual correlation between EBS systems and gold standard over time
The EBS systems reflect the seasonal influenza outbreaks detected in FluNet counts to some extent. Figure 4 exemplifies the visual correlation between FluNet, HealthMap and EIOS counts for a set of countries with very different numbers of events.
Countries with very low event counts in HealthMap show only scattered spikes of a few events. However, most of these spikes occur when confirmed influenza cases are high, hinting at some degree of correlation (such as Bulgaria and Germany), but they can also occur seemingly at random (such as Nigeria). On the other hand, HealthMap events in countries with higher event counts generally coincide with influenza epidemics in FluNet data, as in Argentina, India and the USA.
In contrast, EIOS events seem to be less synchronized with FluNet counts and have a lower signal-to-noise ratio. Additionally, event count patterns are less clearly visible, as EIOS provided event data for only 2 years. Exceptions are only countries with a very high number of EIOS events, such as Bulgaria and the USA, which show a distinct seasonal pattern.
There are also noteworthy differences in number of events for the two systems between different countries. For instance, in Bulgaria, HealthMap collected only very few events, whereas EIOS found many events that were well-correlated with the gold standard. Looking only at the visual correlations, it is already clear that the two EBS systems operate with very
20 different characteristics, which lead to different distributions of event counts: EIOS data were more abundant, but more variable and were less synchronized with lab-confirmed influenza cases. In contrast, HealthMap generally did not produce any events at all during non-epidemic periods and produced spikes or curves of only moderate height during epidemic periods.
Figure 4: Time series correlations for EIOS, FluNet and HealthMap. Weekly events relating to influenza from
every system are plotted over the time that data are available. EIOS events are on top, confirmed influenza counts from FluNet in the middle, and HealthMap events at the bottom. Epidemic periods found with Bayesian change point analysis are highlighted in red, non-epidemic periods are shown in grey.
3.4 Outbreak detection
To go beyond the visual correlation, start and end points of influenza epidemics were determined retrospectively by Bayesian change point (BCP) analysis in all three datasets. Based on the detected start and end points, the time series were divided into ‘epidemic’ and ‘non-epidemic’ periods.
21
3.4.1 FluNet
Regular seasonal epidemics were discovered in all countries except in Nigeria, Thailand and Vietnam, for which FluNet provided only sparse data and which, due to their tropical climate, inherently show no clear seasonality. In line with the observations made by Azziz-Baumgartner [75] and Newman [47], Brazil, China, Costa Rica, Ecuador, Egypt, India, and Mexico experienced a second epidemic in some years, and Nigeria, Thailand and Vietnam showed year-round activity. Most countries had 8 or 9 outbreaks during the whole study period. The maximum number of outbreaks detected was 11 (in India and Nigeria), and the minimum number was 4 in Saudi Arabia, since data were only available as of January 2017. The peak height for outbreaks varied significantly between countries, but also between outbreaks within countries. The countries with the highest number of confirmed cases per outbreak were the USA, China, and France, while the countries with the lowest peaks were Nigeria, Uruguay, and Vietnam.
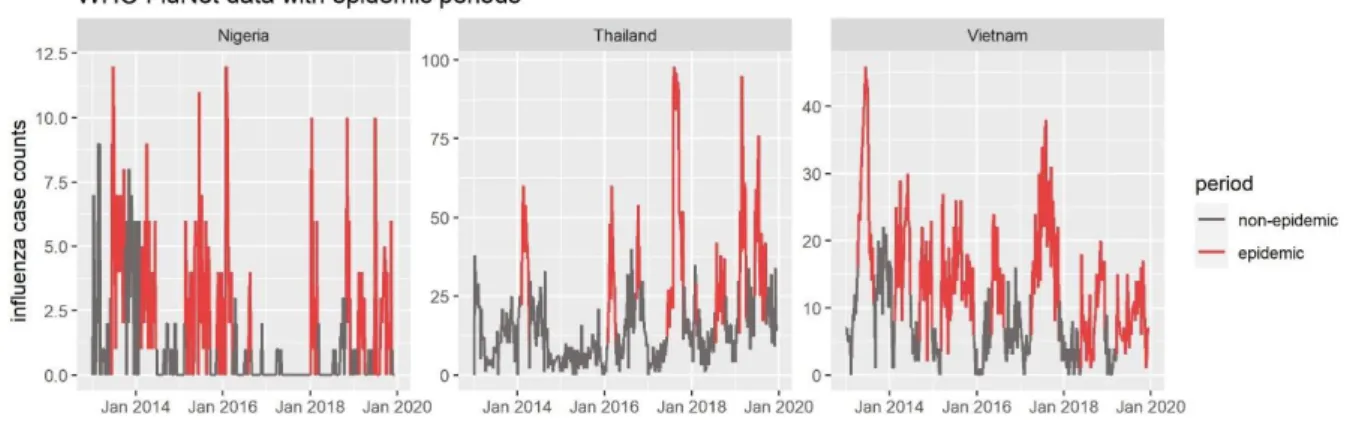
The epidemic periods of the FluNet counts displayed in figure 3 confirmed the visual detection of outbreaks in the timeline very well. BCP analysis detected a change early in rising curves and at the end of dropping curves. For Nigeria, Thailand and Vietnam, the epidemic periods detected by BCP are less well-defined due to the high signal-to-noise ratio of influenza counts in these countries (Figure 5). Therefore, epidemic indicators cannot be fully trusted and performance metrics which are calculated later may be questionable for these countries.
Figure 5: FluNet data with epidemic period indicator for the three countries with low data quality. Epidemic
periods, as defined by Bayesian Change Point approach, are colored in red, non-epidemic periods in grey.
3.4.2 EBS systems
Twelve countries had very low HealthMap event counts and thus only showed spikes of a few events at a time. BCP analysis detected all of these spikes as outbreaks (see data for Bulgaria, Germany, and Nigeria in Figure 4). Detecting these spikes as outbreaks increased sensitivity compared to ignoring them (see section 3.5.3). In line with observations from FluNet, outbreaks
22 detected by the BCP algorithm in HealthMap data corresponded well with visual outbreak detection.
Due to the low signal-to-noise ratio and the short data collection period of EIOS, a clear baseline could not be discriminated from an epidemic phase for this system. Therefore, it seems that BCP analysis did not work not as well as in HealthMap. Most outbreaks are still recognized as they would with the naked eye, but sometimes the algorithm did not detect spikes (see Nigeria in Figure 4) or flagged outbreaks at unexpected time points (see Argentina in Figure 4). Moreover, EIOS counts peaked at times when gold standard counts were still low, for example in Germany in the fall of 2018 and 2019 or in the USA in the summer/fall of 2018.
3.5 Evaluation of outbreak detection performance
Datasets were first divided into epidemic and non-epidemic periods. Influenza outbreak detection performance was evaluated separately for each EBS system because both have their unique characteristics and biases. To obtain a complete picture of the performance, three different metrics of sensitivity were evaluated along with specificity, positive predictive value, and timeliness of detection. Additionally, accuracy and F1 scores were calculated as two composite measures of performance.
In general, system performance varied widely across countries, and there was seldom a discernible concordance between EIOS and HealthMap. Of note, EIOS metrics were less precise than HealthMap metrics because the former are calculated from only two years of data, whereas HealthMap calculations are based on 6.5 years of data. Hence, the 95% confidence intervals of all EIOS metrics are wider than their respective HealthMap counterparts (Table 8 in appendix).
3.5.1 Performance measured in simple metrics
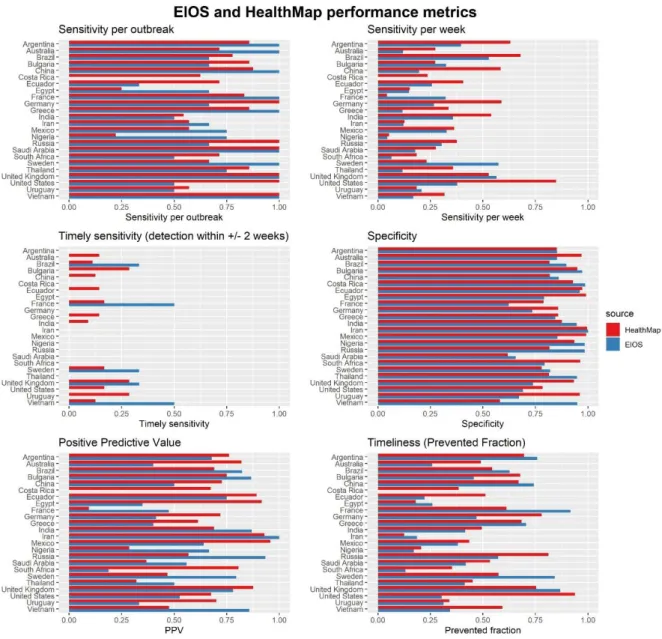
Sensitivity per outbreak was over 50% for most countries in HealthMap, except for Egypt and Nigeria, and over 75% for 13/24 countries (Figure 6). That is to say, in 13/24 countries HealthMap detected ¾ of all outbreaks. In comparison, EIOS detected ¾ of all outbreaks in only 9/24 countries and did not detect a single outbreak in Costa Rica. Sensitivity per outbreak was the evaluation metric which had the highest number of countries scoring 100%, that is, 6 in HealthMap and 9 in EIOS. Remarkably, EIOS thus had very high inter-country variations in this metric.
Sensitivity per week was lower in both systems for every country, except obviously for Costa Rica in EIOS, which was again 0%. For example, while HealthMap achieved a sensitivity per outbreak of 86% in Argentina, the country’s sensitivity per week was only 63%. In EIOS, the discrepancy for Argentina was even higher, with a sensitivity per outbreak of 100% and a
23 sensitivity per week of 39.5%. Since the main reason for the calculation of this metric was the usage in composite measures, the scores of individual countries will not be discussed.
Neither of the EBS systems achieved a good score for timely sensitivity on average, which was the main outcome of interest. HealthMap detected 0% of all outbreaks within 2 weeks of outbreak onset in 13/24 countries, and EIOS failed to detect outbreaks in a timely manner in 19/24 countries (Figure 6). The countries in which HealthMap detected the most outbreaks on time were Bulgaria, the UK and the USA with a timely sensitivity of 28.6%. This corresponds to 2 outbreaks out of 7 which were detected within 2 weeks of outbreak onset. For EIOS, the timely sensitivity of France and Vietnam was 50%, corresponding to 1 outbreak out of 2 detected within two weeks, and 1 out of 3 outbreaks was detected in Brazil, Sweden, and the UK.
The specificity of both systems did not vary substantially between countries and was generally very high, with 22 countries having a specificity larger than 75% in HealthMap and 17 in EIOS. Iran in EIOS was the only country which had a specificity of 100%, meaning that all weeks in which an alarm was raised were classified as outbreak weeks in the gold standard, too.
Calculation of the positive predictive value produced more heterogeneous results. In HealthMap, 4 countries had a PPV below 50%, 11 between 50% and 75%, and 9 above 75%. For example, this means that the probability of a week being classified as an outbreak in HealthMap also being classified as an outbreak week in the gold standard data was less than 50% for France, Nigeria, Saudi Arabia, and Thailand. In EIOS, the PPV ranged from 0% in Costa Rica to 100% in Iran, with 8 countries below 50%, 7 between 50% and 75%, and 8 above 75%.
Timeliness was calculated as the mean of prevented fractions of outbreaks to circumvent the problem of non-detected outbreaks. For both systems, the mean prevented fraction was rarely over 75%, and especially low in EIOS with 15 countries below 50%. This means that the systems usually detected outbreaks late after their onset, which corresponds well to the low scores of timely sensitivity. Countries in which the prevented fractions are high are Argentina, the United States, and Vietnam for HealthMap, and Argentina, China, France, Sweden, and the UK for EIOS.
24 Figure 6: EIOS and HealthMap performance metrics. All metrics were calculated with FluNet data as reference.
Sensitivity per outbreak is the sum of all detected outbreaks (alarm during the outbreak) over the total number of outbreaks. Sensitivity per week is the sum of correctly classified epidemic weeks over the total number of epidemic weeks. Timely sensitivity is the sum of all outbreaks detected within 2 weeks of the onset date in FluNet divided by the total number of outbreaks. Specificity is the sum of all correctly classified non-epidemic weeks over the total number of non-epidemic weeks. Positive predictive value is the number of weeks correctly classified as epidemic divided by all epidemic weeks. Timeliness or prevented fraction is defined as the difference between the outbreak onset and the time of detection by the system, divided by the length of the whole outbreak. If an outbreak is not detected by the system, the prevented fraction is set to zero.
3.5.2 Performance measured in composite metrics
In addition to these simple metrics, two composite measures were calculated: accuracy is the number of correctly classified weeks over the total number of weeks, so it combines sensitivity per week and specificity. For HealthMap, accuracy was 75% or higher in 7 countries and 50% or higher for all countries except Saudi Arabia and Vietnam (Figure 7). Countries for which HealthMap was over 75% accurate were the United States, Ecuador, Brazil, Argentina, Mexico, India, and Germany. In EIOS, accuracy was over 70% for Brazil, Russia, Bulgaria, and Ecuador, and the countries with the lowest accuracy were Saudi Arabia and Vietnam.