Publisher’s version / Version de l'éditeur:
Vous avez des questions? Nous pouvons vous aider. Pour communiquer directement avec un auteur, consultez la première page de la revue dans laquelle son article a été publié afin de trouver ses coordonnées. Si vous n’arrivez pas à les repérer, communiquez avec nous à [email protected].
Questions? Contact the NRC Publications Archive team at
[email protected]. If you wish to email the authors directly, please see the first page of the publication for their contact information.
https://publications-cnrc.canada.ca/fra/droits
L’accès à ce site Web et l’utilisation de son contenu sont assujettis aux conditions présentées dans le site LISEZ CES CONDITIONS ATTENTIVEMENT AVANT D’UTILISER CE SITE WEB.
American Ceramic Society Bulletin, 67, 8, pp. 1412-1417, 1988-08
READ THESE TERMS AND CONDITIONS CAREFULLY BEFORE USING THIS WEBSITE. https://nrc-publications.canada.ca/eng/copyright
NRC Publications Archive Record / Notice des Archives des publications du CNRC :
https://nrc-publications.canada.ca/eng/view/object/?id=782f3b55-0b16-4fcc-bdf6-c231642794e2
https://publications-cnrc.canada.ca/fra/voir/objet/?id=782f3b55-0b16-4fcc-bdf6-c231642794e2
NRC Publications Archive
Archives des publications du CNRC
This publication could be one of several versions: author’s original, accepted manuscript or the publisher’s version. / La version de cette publication peut être l’une des suivantes : la version prépublication de l’auteur, la version acceptée du manuscrit ou la version de l’éditeur.
Access and use of this website and the material on it are subject to the Terms and Conditions set forth at
Quality-control test for clay brick based on air permeability
0c.t
T H ~
National Research
Consell national
~ 2 1 d
91
Councll Canada
de recherche8 Canada
no.
1565
c. 2
Institute for
lnstitut de
B
iDGConstruction
Research in
construction
recherche en
- - -
Quality-Control Test for Clay Brick Based
on Air Permeability
by M.R. Arnott and G.G. Litvan
A N A L Y Z E D
Reprinted from
American Ceramic Society Bulletin
Vol. 67, No. 8, August 1988
p. 141 2-1 41 7
(IRC Paper No. 1565)
I
N R C-
ClSTl 1R
I R C
L I B R A R Y
1I
7NRCC 29609
i
B I ~ L J ~ T ~ ~ Q U E
I
I R C
i
C N R C-
ICIST!
Le
degrk de cuisson (fonction de la tempkature et du temps de retention) auquel est
soumise une brique contribue de faqon importante
B
dkterminer sa dsistance au gel-dkgel.
On a mis au point un essai de contr6le de qualit6 rapide et simple servant B evaluer cette
dsistance
B
partir de la mesure de la pedabilitk
B
l'air. L'essai est effectuk sur une carotte
cylindrique (de 16'6 mm
de diamhe et 25 mrn de longueur)
B
l'aide d'un appareil Blaine
modifit5 employe initialement pour determiner la surface vraie du ciment portland. La
pemeabilitk
.&
l'air varie, selon la temeatmre de cuisson, d'une mani&re caracteristique
d h n melange donne de brique,
et
elle
prbsente une valeur maximum
B
une temperature de
cuisson relativernent
tlevee.
On croit que
la
perm6abilite h l'air maximum survient
B
la
tem@rature de
cuisson minimum
h laquelfe une fusion suffisante de l'argile a eu pour effet
de
cdet
les
liaisons
interparticulaires nkessaires B la confection d'une brique durable. Cet
essai peut ainsi servir
B
dkfinir la temperature de cuisson minimum pour un melange
d'argile donne.
On a aussi verifie la pertinence des valeurs de permeabilitt?
B
l'air au moyen
d'essais classiques de determination de surface vraie
B
l'azote.
Reprinted from (he American Ceramic Society Dullelin. Vol. 67, No. 8, Augusl 1988
Copyrigl~tO 1988 by The American Ceramic Society. lnc.
-
- -
. - . . . . . Am. ('erunl. Sol.. tlttll., 67 [8] 1412-17 (1988) ~ 5 f i ~ ? 6 * 0 ~ i ~ ~ ~ * dQuality-Control Test for Clay Brick
Based on Air Permeability
-
MARK R. ARNOTT
and
GERARD
G.
LITVAN*
National Research Council of Canada, Institute for Research in Construction, Ottawa, ON, KIA 0R6, Canada
The degree of firing (a function of temperature and re-
tention time) that a brick receives is a major determinant
of its freeze-thaw durability. A rapid, simple quality-
control test was developed to assess freeze-thaw resis-
tance based on the measurement of air permeability. The
test is performed on a cylindrical core (16.6 mm diameter
by 25 mm long) using a modified Blaine apparatus orig-
inally used to determine the surface area of portland ce-
ment. Air permeability varies with firing temperature in
a manner characteristic of a given brick mix and shows
a maximum value at a relatively high firing temperature.
The maximum air permeability is believed to occur at
the minimum firing temperature at which sufficient par-
ticle-surface melting has occurred to develop the inter-
particulate bonds necessary to develop a durable brick.
The test thus can be used to define the minimum firing
temperature for a given clay mix. The significance of the
air-permeability values was further examined by per-
forming conventional nitrogen surface-area tests.
Insufficient resistance to freezing and thawing is a major source of the performance problems experienced with clay brick in cold climates. The lack of a reliable test method to assess the freeze-thaw resistance of brick is probably the chief reason for the slow progress made over the years in eliminating such per- formance problems. A reliable freeze-thaw durability test is a prerequisite for the modification of the manufacturing process and for quality-control purposes.
Saturation coefficient is currently used as the criterion for freeze-thaw r e s i ~ t a n c e , ' . ~ but statistical analysis of a test pro- gram involving 5217 brick showed no reliable relation between absorption properties and freeze-thaw durability.' Compressive strength was also found to be an unreliable indicator of frost susceptibility.'
Nitrogen surface area, determined by the Brunauer- Emmett-Teller (BET) method was shown to be a good basis for testing the freeze-thaw durability of brick.4 It was also estab-
'Member, the American Ceramic Society.
Received December 17, 1987; approved March 9. 1988.
lished that the surface area of brick decreases with increasing heat p r o ~ e s s i n g . ~ These two findings suggested that the quality of firing is a dominant factor in influencing the durability of a given brick, and therefore, parameters characterizing the extent of the firing should be a measure of the ability of the brick to withstand freezing and thawing damage. Tests based on length changes and heats of reactions using dilatometry and differential scanning calorimetry were also proposed for this p ~ r p o s e . ~ These methods, however, require instruments normally not used for the manufacture of brick. Thus, a need exists for a simple qual- ity-control test that can be readily performed by production personnel.
The present work was undertaken to examine the suitability of the Blaine air-permeability test7 (widely used to determine the surface area of portland cement) for the assessment of brick durability. Although surface area is obtained in an indirect way, the simplicity and rapidity of the test method made it a good candidate for this project.
Apparatus
When used for portland cement, the test method consists of packing a known weight of cement powder into a steel cylinder sample holder to form a porous plug that is supported by a perforated disk. The time required to draw a definite quantity of air through the specimen is measured. To retain the integrity of the brick, a sample in the form of a solid cylinder was used. This necessitated a modification of the sample holder to make it suitable for a solid instead of a powdered specimen.
An effective seal to prevent air leakage between the sample and the wall of the sample holder had to be designed. A further requirement was that the seal should be simple and easily in- stalled. A new sample holder was developed, a schematic dia- gram of which is shown in Fig. l . The apparatus consisted of a latex-rubber tube 100 mm long by 19 mm in diameter by 3.2 mm wall thickness placed inside a brass pipe 50 mm long by 29 mm in diameter by 1.5 mm thick. Each end of the rubber tube was folded back onto the brass pipe, and airtight seals were formed with two hose clamps. The brick core specimen 16 mm in diameter by 25 mm long was placed inside the rubber tube and was sealed along its entire length by the rubber tube which can be inflated to 140 kPa through a side arm. The sample holder was attached to the manometer arm that had the same outside diameter as the brick sample, such that the manometer arm butted against the sample inside the sample holder. The rubber sleeve was then inflated to 140 kPa. No air leakage was detected in the manometer after a 4-h test of the assembly containing a solid steel specimen.
Procedure
(1) A water-cooled, diamond-tipped 19-mm-diameter core drill was used to take specimens parallel to the direction of extrusion from a fired brick. They were cut from the same location on Peer Reviewed Contribution
Fig. 1. Sample holder for brick: 1, brass tube; 2, side arm; 3, latex rubber cuff; 4, hose clamp; 5, manometer tube; 6, specimen.
each brick to avoid variations due to systematic inhomogeneity of the extrusion process.
(2) To eliminate skin effects, a 25-mm-long specimen was cut from the center portion of the core.
(3) The specimen was dried a t 1 30°C for 1 h and then cooled
to room temperature.
(4) The specimen was placed in the holder (Fig. l ) , which was then attached to the manometer assembly (Fig. 2), and the rubber cuff was pressurized to 140 kPa to form the seal.
(5) An attached rubber bulb was used to evacuate the space between the specimen and the dibutyl phthalate manometer fluid so that the manometer fluid rose to a point just above the upper reference point (L in Fig. 2). At this point, the rubber bulb was isolated from the manometer by operating the stop- cock. The other manometer arm was open to atmospheric pres- sure.
( 6 ) The time interval for the manometer fluid meniscus to
pass between the upper and lower reference points (L and K in Fig. 2) was measured. This interval is referred to as the Blaine
time, and its value generally lies between 2 and 5 min. The time
required to perform the test, excluding drying time, was =10 min.
Firing of bricks in the laboratory was performed in a labo- ratory furnace* programmed for the firing schedule shown in Fig. 3. The laboratory firing schedule was patterned after a plant's firing schedule. The peak firing temperature was varied between 870" and 1070°C so that underfired, normally fired, and overfired samples could be studied. Three types of red- burning shales were studied. Randomly selected one-eighth por- tions of plant-extruded green brick were used for the firings.
During a plant shutdown a series of buff-burning brick was obtained from kiln cars that were a t various stages of the firing process.
The N, surface area of the specimens was determined, using the single-point BET method and a continuous-flow sorptome- ter.+ Approximately 1.5 g of material which passed through a
No. 8 sieve and were retained on a No. 20 sieve were used for
the test.
*Model 1500 D Rapid Temp Furnace, CM Furnaces, Inc., Bloomfield, NJ. 'Quantisorb, Quantachrome Corp., Syosset, NY.
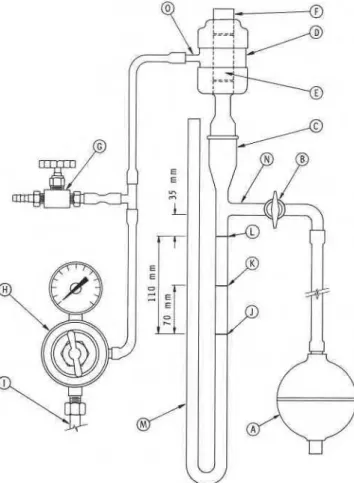
Fig. 2. Blaine apparatus: A, rubber squeeze bulb; B, stopcock; C, ground glass joint; D, sample holder; E, sample; F, spacer; G, pres- sure release valve; H, pressure regulator; I, air line or gas cylinder; J, manometer fluid fill line; K, lower reference line; L, upper reference line; M, Blaine manometer; N, manometer side arm; 0, sample hold- er side arm.
Results
Reproducibility
I
Specimens from five plants were tested to determine the re- producibility of the method. Ten specimens were tested ten times to assess the repeatability. The standard deviations of the Blaine
TIME, h r
Fig. 3. Firing protocol for lab firings.
N o t e . 5 0 0
-
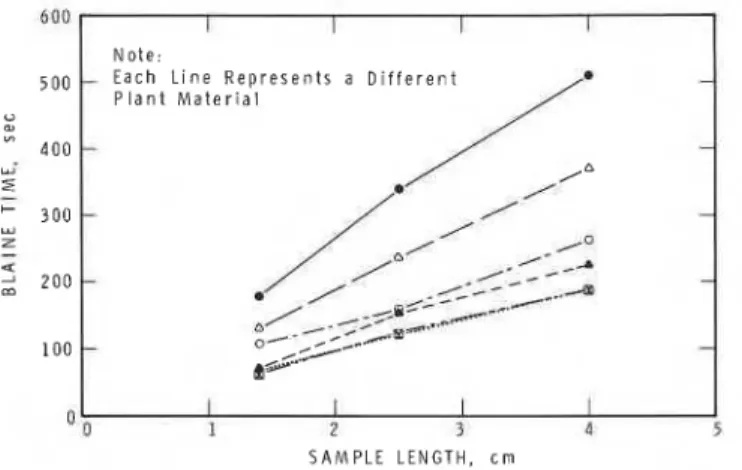
P l a n t 1 0 0 - L i n e R e p r e s e n t s a D i f f e r e n t M a t e r i a l '0 1 2 3 4 5 S A M P L E L E N G T H , c mFig. 4. Blaine time versus sample length.
times ranged from 0.40 to 1.2 s, with an average of 0.75 s or
(1%. From three types of brick, replicate specimens were ob- tained, 12 from each of two brick and eight cores from one brick, and when tested the values of standard deviations in terms
of Blaine times were 9.3, 8.5, and 24.8 s, respectively. As a
percentage these standard deviations are 5.9%, 5.7%, and 7.7% of the average Blaine times of the respective samples. The var- iation could be attributed to a large extent to inhomogeneity of
1 . 2 B L A I N E T l M E 4 2 0. 8 Q + LL LL
::
0 . 6 300z
u. a 3 0 4 200 Z 0 . 2 0 I I I I I I 1 I I I 0 870 890 910 930 950 970 990 1010 1030 1050 1070 TEMPERATURE. "CFig. 6. Blaine time and N, surface area versus firing temperature for series A (laboratory fired).
z
uL
2 2,(,04--0 ---D- -0- -00-
m A---o---.-o o-.-- -. --0 001""---""
--T"- "'--*"L~-."* 1 ooo 20 4 D 6 0 80 100 H U M I D I T Y . % R HFig. 5. Blaine time versus humidity.
the brick. Similarly, in another series, two core specimens were taken from each of 60 brick, and the Blaine times of the du- plicate specimens differed, on average just over 6%.
Specimen Length
The effect of specimen length was examined in experiments involving cores of three different lengths originating from five
brick fired a t various levels. The results shown in Fig. 4 indicate
size sensitivity as expected, but the Blaine time values a t each length have the same ranking order. Therefore, Blaine times can be used for comparative purposes regardless of the sample length.
Error can be reduced by increasing the specimen length. A 25-
mm core length was adopted as a standard in this work as a compromise to achieve good precision within a reasonably short testing time. Reproducibility for a 25-mm sample length was
+ I s.
Moisture Content of Specimens
To assess the effect of moisture content on the Blaine time, tests were performed on specimens which, after drying at 130°C for 18 h, were conditioned a t relative humidities between 3% and 90%. The measured Blaine times were unaffected by ex- posure to different humidities (Fig. 5) except a t relative hu- midities of >90%. Therefore, the degree of drying of specimens, and the r.h. during testing should be an insignificant source of error.
Firing Temperature versus Blaine Time Relation
1 . 4 I 1 . 4 1 2 - B L A I N E T I M E - 6 0 0 1 . 2 m m 0 N 2 S U R F A C E AREA
-
-
NE 1 . 0 - 500 p 1.0 * 4 ; 0 . 8 - 4-
2 0 6 - u. = 3 0 . 4-
N Z Z 0 . 2-
I870 890 910 930 950 970 o 990 1010 1030 1050 1070 O 0 I T E M P E R A T U R E . "CFigures 6 through 8 compare the Blaine times and N, surface areas of the specimens (from the three laboratory-fired series)
B L A I N E T l M E o N 2 S U R F A C E A R E A
I I I I I I I I I '0 890 910 930 950 970 990 1010 1030 1050
TEMPERATURE. 'C
Fig. 7. Blaine time and N, surface area versus firing temperature Fig. 8. Blaine time and N, surface area versus firing temperature for series B (laboratory fired). for series C (laboratory fired).
B L A I N E T l M E 0 N 2 S U R F A C E A R E A 0 -0 9 5 0 9 7 0 9 9 0 1 0 1 0 1 0 3 0 1 0 5 0 T E M P E R A T U R E . 'C
Fig. 9. Blaine time and N, surface area ver- sus firing temperature for series D (plant fired).
as a function of the maximum firing temperature. For series A and B (Figs. 6 and 7) the Blaine time versus firing temperature curves go through a minimum a t =lOOO°C, whereas for series C (Fig. 8) the values decrease less markedly with no minimum value apparent. The N, surface area versus firing temperature curves for all series decrease continuously with increasing firing temperature. Figure 9 shows the results obtained for the samples acquired during the plant shutdown.
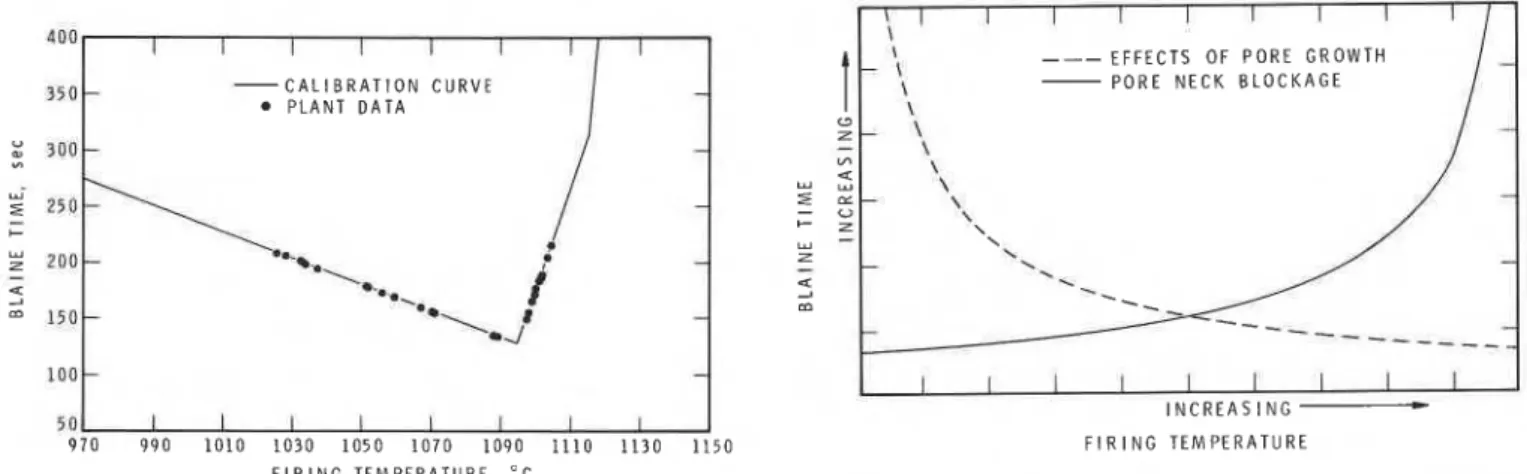
Plant Trials
Plant trials were conducted to assess the ability of plant per- sonnel to perform the test under practical conditions. For this trial, a red-burning Queenstone shale was chosen. Before the plant trials, calibration curves relating Blaine time and N 2 sur- face area to firing temperature in laboratory firings of the plant- extruded green brick were established (Fig. 10). The plant trials were performed in two phases lasting 3 and 60 days, respectively. The first phase was used for setup and training purposes. In the second phase, the trained plant personnel performed the test without assistance or supervision. From the top, middle, and bottom of a kiln car, a pair of brick from each location was obtained and tested. Sampling and testing was performed for 9 days during the 60-day trial period. After testing in the plant, the N, surface areas and Blaine times of the sampled brick were determined in the laboratory. Figure 11 plots the average Blaine
5 0 1 I t I I I I I I
I
970 990 1010 1030 1050 1070 1090 1110 1130 1150
F I R I N G T E M P E R A T U R E . " C
Fig. 11. Plant trial Blaine times and calibration curve.
CERAMIC BULLETIN, VOL. 67, NO. 8, 1988 (OACerS)
B L A I N E T l M E 0 N q S U R F A C E A R E A 500
-
+ Z-
4_
400-
3 0 0 - T E M P E R A T U R E . " C Fig. 10. Plant trial calibration curve.times of the two adjacent samples on the previously established calibration curve. For simplicity, the calibration curve was ap- proximated as a series of straight lines.
Discussion
(1) The good reproducibility of the Blaine test indicates that the modified apparatus functions reliably and that the modified procedure is adequate.
(2) The Blaine time versus firing-temperature curves show that a relation exists between these two parameters. In the study of the effect of firing temperature on the pore-size distribution of clays, May and Butterworth demonstrated that pore systems undergo two types of changes on firing: an increase in pore size and an increase followed by a reduction in total p o r ~ s i t y . ~ An increase in pore size during the initial stages of sintering for substances such as MgO, Fe,O,, and AI20, was reported by Whittemore and S i ~ e . ~ The decrease in Blaine time with in- creasing firing temperature may be attributed to pore growth. At higher temperatures, melting of the less-refractory clays oc- curs, and the pore system becomes partially blocked, resulting in increasing Blaine times. The pore blockage was confirmed by measuring pore-size distributions of the fired samples. Figure
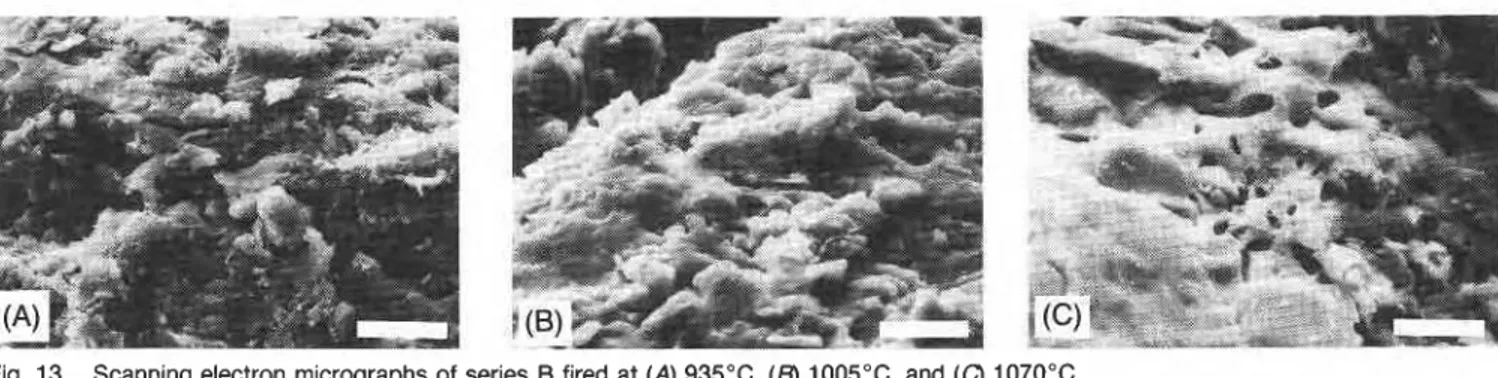
12 shows a schematic representation of the development of these two opposing processes, pore growth and blockage, and their effect on Blaine time. The changes in the structure of clay a t three stages of firing can be seen also in Fig. 13.
(3) The minimum of the Blaine time versus firing tempera-
E F F E C T S O F P O R E G R O W T H P O R E N E C K B L O C K A G E
I I I I I I I I I
I N C R E A S I N G * F I R I N G T E M P E R A T U R E
Fig. 12. Influence of pore growth and pore neck blockage on Blaine time.
Fig. 13. Scanning electron micrographs of series B fired at (A) 935"C, (6) 1005"C, and (C) 1070°C.
ture curve occurs a t a temperature a t which clay melting occurs sufficiently to form good bonding. This temperature can thus be considered the optimum firing temperature for a given firing schedule. Selection of the firing temperature is in practice a compromise between producing a durable brick with good me- chanical properties, achieved a t high temperatures just below the melting point of the material, and producing a warped or deformed product should the firing temperature be too high. Controlling the kiln accurately a t =llOO°C is difficult. Also, because warpage or overfiring is immediately visible whereas poor durability is not, in practice kilns tend to be operated at lower rather than higher temperatures. The difficulties are com- pounded by the lack of a generally accepted test for durability that could be used for quality-control purposes. The establish- ment of the relationship between freeze-thaw durability and the
N, surface area represents a significant improvement because
this physical property is easily measurable and can be related to durability. This test method proved valuable in comparative testing and could determine the ranking order of specimens with
respect to their expected d ~ r a b i l i t y . ~ It is, however, difficult to
define the critical surface area value for acceptance or rejection of a given brick.
The minimum of the Blaine time curve versus firing temper- ature appears to provide means to determine the optimum firing temperature. For a given material the ideal firing temperature could thus be determined, a few degrees below which the kiln
should be operated. Furthermore, by accepting the surface area of brick fired a t the optimum temperature as the critical value, tolerances in terms of surface area for producing good quality brick can be established.
Figures 14 and 15 plot the surface area versus Blaine time for series A and B. The lowest value of the Blaine time and the corresponding surface area as well as the firing temperature
(Figs. 6 and 7) can be readily defined.
(4) The Blaine time as a function of firing temperature for
the plant-fired brick of series D (Fig. 9 and 16) does not go
through a minimum, indicating the absence of melting of the brick material in significant quantities.
The Blaine time results for the clay fired in series C (Fig. 8)
do not follow the trends shown for the other clays (Figs. 6 and
7). The Blaine times do not change with firing temperature and
are relatively low, corresponding approximately to the minimum values obtained in series A and B. This unusual behavior is assumed to result from the low plasticity, a t the time of sam- pling, for this particular material. This resulted in visible de- laminations in both the extruded green and fired brick. The noticeable cracks provided unobstructed passageways through which the air could flow, which produced a Blaine time not entirely dependent on the firing history of the material.
(5) The assessment of brick durability by the air-flow method suffers from two potential weaknesses: the effect of delamina- tions and the fact that similar Blaine times can be obtained
B L A I N E T I M E . s e c
Fig. 14. Blaine time versus N, surface area
for series B.
B L A I N E T I M E , s e c
Fig. 15. Blaine time versus N, surface area
for series A.
B L A I N E T I M E . s e c
Fig. 16. Blaine time versus N, surface area
for series D.
from brick fired at two different temperatures because of the shape of the Blaine time versus firing temperature curve. These disadvantages, however, can be overcome with little difficulty.
Delaminations affecting the results will appear as cracks in the sample and as such are readily noticeable. These specimens should be discarded, and the brick should be resampled. If no specimen without major flaws can be obtained, then other tests such as the N, surface-area test have to be used, although such a situation should seldom occur.
Uncertainty about which portion of the Blaine time versus firing temperature curve the results are located can be relatively easily resolved. Experienced plant personnel usually can readily decide from clues, such as color or a ringing sound when the brick is tapped, whether a given value of Blaine time corre- sponds to under- or overfiring. Should doubt persist, the follow- ing procedure is suggested. The brick that received the least heat processing in a particular kiln, usually in the center of the hack, must be identified, and its Blaine time must be measured. If the Blaine time for this brick is longer than that of the brick fired at the top or bottom of the hack (or brick which experi- enced greater heat processing) then the specimens were fired a t temperatures below the minimum of the Blaine time versus firing temperature curve. The reverse also holds true: if the specimen with the least heat processing has a shorter Blaine time than the greater-heat-processed specimens, then the brick were fired a t temperatures above the minimum on the Blaine time versus firing temperature curve.
( 6 ) During the plant trial the plant personnel performed the
test satisfactorily with no problems with either the test equip- ment or the procedure. When the cored samples were retested in the laboratory the average difference between the laboratory and the plant Blaine time readings was (1%. It was found that a better correlation was achieved if the average Blaine time of two adjacent bricks was used. Figure 11 demonstrates that the
kiln firing temperature can vary
+
10°C to -70°C from theminimum Blaine time temperature. The results show that ap- proximately one-half of the samples were fired close to the min- imum Blaine time temperature. The results also indicate that one-half of the samples tested had a firing temperature signif- icantly different from the minimum Blaine time temperature and that the plant is far more likely to underfire rather than overfire the kiln.
Conclusions
(1) The modified Blaine test method and equipment perform
satisfactorily for determining the Blaine times for brick core samples.
(2) Relations can be established between Blaine time and
firing temperature, and Blaine time and N, surface area. No
two materials have the same sintering characteristics, and there- fore, each material will have a unique set of relations, but the general trends should be the same for all materials.
(3) The test can be used on its own, or it can be used to
establish maximum and minimum criteria for other tests, such as the N, surface-area test. The test can define the point a t which a brick becomes well fired, i.e., the minimum point of the Blaine time versus firing temperature curve.
(4) The Blaine time was found to be affected by the presence
I
of large laminations in a brick.
1
(5) The plant trial demonstrated that the test can be per-
formed satisfactorily in a plant setting by plant personnel and that the test is capable of detecting changes in the firing process.
Acknowledgment
The authors are greatly indebted to the technical officers of the IRC, Building Materials Section, for their assistance in the collection of the data and to the member companies of the Clay Brick Assn. of Canada for supplying the test samples. This work was sponsored by the CBAC/IRC Industrial Research Fellow- ship. This paper is a contribution from the Institute for Research in Construction. National Research Council of Canada.
References
'"Building Brick (Solid Masonry Units Made from Clay of Shale)," ASTM Designation C 62-85a. 1986 Annual Book of ASTM Standards, Val. 4.05, pp. 46-49. American Society for Testing and Materials, Philadelphia, PA.
'"Burned Clay Brick," CSA standard A82.1-M1977. Canadian Standards As- sociation, Toronto, ON, 1977.
'G. C. Robinson, J. R. Holman, and J. F. Edwards, "Relation Between Physical Prooerties and Durabilitv of Commerciallv Marketed Brick." Am. Ceram. Soc. Buil., 56 [12] 1071-75, '1079 (1977). *
' G . G. Litvan; pp. 123-32 in Testing the Frost Susceptibility of Bricks. ASTM Spec. Tech. Puk!., No. 589, 1975.
'J. H. Kung, Frost Durability of Canadian Clay Bricks"; pp. 245-51 in Pro- ceedings of the 7th International Brick Masonry Conference. University of Mel- bourne. Melbourne. Australia. February 1985.
GG. G. Litvan, "Determination of thk Firing Temperature of Clay Brick." Am. Ceram. Soc. Bull.. 63 141 617-18. 627 (1984).
'"Fineness of ~ o r t l a i d ' c e m e n t by permeability Apparatus," ASTM Des- ignation. C 204-84. 1985 Annual Bookof ASTM Standards. Val. 4.01, pp. 207-14. American Society for Testing and Materials, Philadelphia, PA.
XJ. 0. May and B. Butterworth, "Studies of Pore Size Distribution: 111, The Effect of Firine": OD. 201-21 in Science of Ceramics. Val. I. Edited bv G. H.
Steward. ~cadimi'c: London, 1961.
I
YO. J . Whittemore, Jr. and J. J , Sipe. "Pore Growth During the Initial Stages of Sintering Ceramics," Powder Technol., 9 , 159-64 (1974). B