Journal of Antimicrobial Chemotherapy (1994) 34, 485-505
Isolation and in-vitro and in-vivo characterisation of a mutant of Pseudomonas aeruginosa PAOl that exhibited a reduced postantibiotic
effect in response to imipenem
P. A. Majcherczyk"**, S. Kunz\ M. Hattenberger*, J. Vaxelaire,* O. Zak* and T. O'Reilly*
"Department of Medical Microbiology, University of London, UK;bDepartment of Pharma Research, Ciba-Geigy Limited, Basel, CH-4002, Switzerland The postantibiotic effect (PAE) is the persistent inhibition of bacterial growth after a brief exposure to an antibiotic. Most /J-lactams do not induce a PAE for Gram-negative bacteria, but PAEs have been reported for carbapenems and penems. This study investigated the effect of sequential doses of imipenem on the PAE for Pseudomonas aeruginosa and Escherichia coli cultures in a chemostat. The PAE for the bacterial population did not change even after six successive exposures to imipenem. Nevertheless, screening of colonies isolated after repeated drug exposure identified a single P. aeruginosa mutant whose imipenem PAE was shortened, although the MIC was unchanged. The PAEs for the parent and mutant were studied in vitro in batch culture by monitoring: (i) viable counts; (ii) electrical impedance of the culture medium; (iii) incorporation of radiolabelled N-acetyl-D-glucosamine and (iv) cell volume changes. PAEs for the parent and mutant were found to be significantly different by all in-vitro methods used. Moreover, the median cell volume in antibiotic-exposed cultures remained much smaller and less heterogeneous than in the control cultures, even though both cultures were growing at the same rate. The mutant was found to have a reduced expression of a 52 kDa outer membrane protein. These observations suggest that factors in addition to suppression of bacterial growth should be considered when studying the PAE. The PAEs of imipenem for the parent and mutant were studied in a thigh infection model in leucopenic mice. Similar PAEs were observed in vivo for both parent and mutant in one experiment and no PAEs for either organism were found in a second experiment. This study showed that although the PAE is a stable in-vitro phenomenon, the lack of correlation between the in-vitro and in-vivo results warrants caution in attributing clinical significance to the PAE of imipenem.
Introduction
Bacteria often do not resume normal growth for several hours after transient exposure to antibiotics, a phenomenon often termed 'postantibiotic effect' (PAE). Many different classes of antimicrobial induce PAEs, though not in all bacteria. PAEs of jS-lactams, though often substantial for Gram-positive bacteria, are generally minimal or absent for Gram-negative bacteria, which rapidly recover once the antibiotic is removed (Bundtzen et al., 1981). The cabapenems and penems are an exception and have been
•Address for correspondence: 69 Creffield Rd, London W3 9PS, UK.
485
widely reported to induce PAEs in Gram-negative bacteria in vitro (Bustamante et al., 1984; Manek, Andrews & Wise, 1986; Chin & Neu, 1989; Nadler, Pitkin & Sheikh, 1989) and to a lesser extent, in vivo (Gudmundsson, Vogelman & Craig, 1986; Renneberg & Walder, 1989; Jabes, Rossi & Delia Bruna, 1992). In theory at least, such PAEs may be of clinical value, allowing dosage intervals to be extended.
To be useful clinically, however, the PAE should be stable: it would be of little value during therapy if bacterial populations were rapidly over-run by mutants that lacked a PAE. Only two studies have examined the stability of the PAE (Karlowsky et al., 1993; McGrath et al., 1993) to date. McGrath et al. (1993) found that PAEs of tobramycin and temafloxacin for Pseudomonas aeruginosa decreased and increased respectively during three successive exposures to these drugs. Karlowsky et al. (1993) reported that PAEs of ciprofloxacin and gentamicin for Escherichia coli decreased over the course of three exposures. Reductions in antibiotic susceptibility were also noted in repeatedly challenged cultures and complicated analysis of the PAE responses. In contrast McGrath et al. (1993) found no difference in the PAEs of imipenem for P. aeruginosa after three exposures. Wu & Livermore (1990) suggested that mutants lacking a /Mactam PAE are not rapidly selected because no change in the interdose recovery of bacterial populations was noted when a chemostat culture of P. aeruginosa was challenged with four successive doses of imipenem at 12 hourly intervals. In the present study the effect of multiple dosage on the stability of the PAE for E. coli and P.
aeruginosa during repeated exposure to imipenem in a chemostat was investigated.
Investigations then proceeded to determine whether the PAE for individual cells within the population was altered after exposure to imipenem. A PAE-lacking mutant was found and characterised in vitro and in vivo.
Materials and methods Bacterial strains, antibiotics and chemicals
Studies were performed on P. aeruginosa PAO1 (ATCC 15692) and E. coli 220 (clinical isolate). A PAE mutant of P. aeruginosa PAO1, designated CM41, was isolated in the present study and is described below.
Imipenem was obtained as powder from Merck Sharp and Dohme Ltd (Hoddesdon, Herts.) In all in-vivo experiments, imipenem was used as a 1:1 combination with cilastatin. The weights and concentrations of the imipenem/cilastatin mixture quoted in this context relate solely to imipenem, cilastatin amounts being constant throughout. Unless otherwise stated, all non-radioactive chemicals were obtained from the Sigma Chemical Company (Poole, Dorset) or from BDH Chemicals Ltd (Poole, Dorset). Radioactive compounds were obtained from Amersham International PLC (Aylesbury, Bucks.). Commercial growth media were purchased from Unipath Ltd (Basingstoke, Hants), except Don Whitley Impedance Broth (DWI) that was obtained from Don Whitley Scientific Ltd (Shipley, W. Yorks.).
The carbon-limited sodium acetate medium described by Wu & Livermore (1990) was used to grow P. aeruginosa cultures in the chemostat, whereas E. coli was grown in M9 medium (Roberts et al., 1957) pH 7-2, supplemented with filter-sterilised glucose ( 0 1 % w/v).
The postantibiotic effect of imipenem 487
Animal studies
In-vivo experiments were carried out in pathogen-free, 6 week old female MAGF white inbred mice (Ciba-Geigy Tier Farm, Sisslen, Switzerland) each weighing 20 + 1 g. No treatment was carried out for the first 48 h after caging, to allow acclimatisation. Mice were killed by asphyxiation with CO2, immediately dissected and then blood withdrawn
from the vena cava using heparinised syringes.
Leucopenia was induced in mice by two intraperitoneal doses (200 mg/kg each) of cyclophosphamide (Asta-Werke Degussa Pharma Gruppe, Bielefeld, Germany), admin-istered 72 and 48 h before infection (or drug administration in pharamcokinetic experiments). Leucocytes were counted with a Sysmex CC-170M microcell counter (Tao Medical Electronics Company, Kobe, Japan).
Susceptibility tests
Minimum inhibitory concentrations (MICs) were determined in 1 mL volumes of Antibiotic Medium No. 3 (AMN3), appropriate chemostat media or standardised mouse muscle homogenate (SMMH) prepared from mouse thigh. Inocula of 106 cfu/mL
were used. The MIC was defined as the lowest concentration of antibiotic necessary to prevent visible growth after 18 h incubation at 37°C. The MIC in SMMH was defined as the lowest concentration of antibiotic to prevent development of green pigmentation due to pyocyanin and pyoverdin, as in the control tubes. Minimum bactericidal concentrations (MBCs) were established by spotting ten 10/xL of the MIC broths on to antibiotic-free nutrient agar plates and examining for growth after incubation for
18 h at 37°C.
PAE after repeated exposure to imipenem in the chemostat
The continuous culture system (Series 210 Bioreactor, LH Fermentation Ltd, Reading, Berks.) consisted of a 2 L culture vessel with mechanical stirrer, thermostat-regulated heater, aerator, oxygen electrode, pH electrode, foam detector and their respective control modules. The dissolved oxygen level was 80% saturation, the agitation speed was 500 rpm ± 100 rpm and the pH was 7-2. Polypropylene glycol was used as an anti-foaming agent when required ( < l m L / 2 4 h ) . Inocula of 25 mL volumes of overnight batch culture were added to 1000 mL of warm (37°C) medium in the chemostat culture vessel. The culture was then incubated at 37°C for 18 h allowing bacteria to reach stationary phase, after which addition of fresh medium was started at a flow rate that gave a doubling time of 2 h. Cultures were grown for at least ten doubling times, to allow steady state to be attained. Imipenem was then added to a final concentration of 10 mg/L. Antibiotic was eluted from the culture by the inflow of fresh medium, its half-life being equal to the doubling time.
Ten mL volumes of culture were removed at intervals for up to 72 h. Viable counts were determined as described below. Once the viable count had returned to approxi-mately its pre-dose level, about 24 h after addition of imipenem, a second identical dose of drug was added and the fall and rise in bacterial numbers were monitored again. This regimen, (10 mg/L every 24 h) was repeated for 6 days and was designed to promote cells that recovered most quickly after exposure to antibiotic. The time for the viable count to increase by 1 log after the antibiotic had fallen to its MIC was noted after each
exposure. This full procedure was carried out on three separate occasions, each time starting with the parent culture.
Screening of individual colonies from post exposure cultures for altered PAEs. One
colony per sampling interval was selected at random from spread plates prepared for viable counts at 10-22 h after each addition of imipenem to P. aeruginosa cultures and at 6-18 h after its addition to E. coli cultures. Their susceptibilities were determined by diffusion tests with imipenem 10 /ig discs on nutrient agar plates. Isolates whose inhibition zone diameters differed by > 3 mm from those of the parent were discarded. Isolates whose susceptibilities remained unchanged were retained on nutrient agar slopes and their PAE responses to imipenem were measured by the impedance technique. Those isolates with a shortened PAE were later examined by viable counts. This screening procedure was carried out once for all isolates. The isolate whose PAE response was shorter when measured by both methods was then studied in detail.
PAEs studied in batch culture
Viable counts. Overnight broth cultures were diluted 1000-fold with the appropriate
pre-warmed (37°C) broth to give c. 106cfu/mL. Two 25 mL volumes of the diluted
cultures were incubated at 37°C with continuous shaking at 150 rpm for 90 min, to yield cells in mid-log growth. Freshly prepared antibiotic solution (lOmg/L) in broth was then added to one flask, the other serving as a control. Incubation was continued for 90 min, when the antibiotic was removed by the addition of jS-lactamase (Broad Spectrum j?-Lactamase Mixture SRI 13, Unipath Ltd) and the control culture was diluted 1000-fold, to reduce the bacterial numbers to a level similar to that remaining in the antibiotic-treated cultures. The amount of /?-lactamase completely hydrolysed the antibiotic in 10 min (assayed spectrophotometrically). Regrowth of cells in both cultures was followed by removing 1 mL samples at intervals for up to 300 min after drug removal. These were diluted in peptone water (1 -5% w/v), using a ten-fold dilution series and duplicate 100/^L volumes were spread on to pairs of nutrient agar plates. Colonies usually were counted after 24 h incubation at 37°C.
The PAE was calculated as:
PAE = T-C; equation 1 where T was the period required for the viable count of the antibiotic-exposed culture (test) to increase ten-fold after removal of antibiotic and C was the period for the antibiotic-free culture (control) to increase ten-fold after the dilution step (McDonald, Craig & Kunin, 1977). PAEs were determined in parallel for the parent and mutant.
PAE studies by impedance measurement. Exposure to imipenem and its removal were
as described above, except that cultures were grown in DWI broth rather than AMN3. After antibiotic removal, 10 mL volumes of cultures were placed in appropriate pre-warmed (37°C) polypropylene tubes in the impedance measuring system (RABIT, Don Whitley Scientific Ltd). Conductivity was measured every 6 min during the next 24 h. As recommended by the manufacturer, growth was inferred once the conductivity had changed by ^ 5 microSiemens in each of three consecutive 6 min recording intervals.
The durations of PAEs were determined both from the periods for growth to be first inferred and from the periods required to reach the maximum rate of change in conductance. In the former case the PAE was calculated by subtracting from the period
The postantibiotic effect of imipenem 489 for growth to be first inferred in an antibiotic-exposed culture (Tnd) the period for
growth to be first inferred for a similar concentration of bacteria in an antibiotic-unexposed culture (Cud), i.e.
PAE = ru d — Cu d. equation 2
In the latter case, the PAE was calculated by subtracting from the period for the rate of change in conductance to be maximum in an antibiotic-exposed culture (rd S / d l), the
period for an originally identical bacterial concentration in an antibiotic-unexposed culture to reach its maximum rate of change of conductance (CdS/dt) (viable counts were
performed to confirm that bacterial populations were comparable), i.e.
PAE = 7dS/dt - CdS/dt. equation 3
PAE studies by incorporation of radiolabelled ~N-acetyl-D-glucosamine (GlcNac).
Exposure to antibiotic and its removal were exactly as described above, except that the inoculum was prepared from an overnight culture diluted 100-fold rather than 1000-fold. After removal of antibiotic, the OD540nms of both the control and test cultures
were adjusted to an OD of 0-08 by dilution with fresh pre-warmed AMN3.
Two mL volumes of the diluted cultures were dispensed into separate universal bottles and GlcNac (3-5 mg/L) was added. Incubation was continued for 5 min, with shaking
in a water bath at 37°C. Subsequently, 4/iCi of radiolabelled [3H] GlcNac
(26-2 mCi/mg) was added. One hundred fiL samples were withdrawn at intervals for up to 240 min, mixed with equal volumes of cooled trichloroacetic acid (TCA) 10% (w/v) in the wells of a microtitre filtration plate (Multiscreen Filtration Plates, Millipore (UK) Ltd, Watford, Herts.). The TCA-insoluble material was collected by filtration via a MultiScreen Vacuum Manifold (Millipore (UK) Ltd), washed with two 200 n L amounts of cooled TCA (10%), dried and radioactivity measured in a liquid scintillation counter (Mini Beta Liquid Scintillation Counter, Model 1211, Wallac (UK) Ltd, Crownhill) using Ultima Gold scintillant (Packard Instrument B.V.-Chemical Operations, Gronin-gen, Netherlands).
The PAE was calculated according to the formula:
P A E = rc p m- Cc p m; equation 4
where Tcpm was the period required (after antibiotic removal and addition of precursor),
for the radioactivity in the TCA-insoluble material of the test culture to reach 10,000cpm/100 nh sample and Ccpm was the corresponding period for the control
culture to reach 10,000cpm/100fiL sample. The incorporated radioactivity in the control cultures was rising exponentially with time when the activity per 100/iL sample had reached this value.
PAE studies by measurement of changes in cell volume. Log phase cultures in AMN3
containing approximately 108cfu/mL were exposed to 10 mg/L imipenem for 90 min.
Antibiotic was removed by the addition of /?-lactamase. Control cultures were diluted by a factor of 103, to give approximately the same number of cells as the test cultures.
Samples were withdrawn at intervals after the removal of antibiotic and diluted to give approximately 5 x 10⁵cfu/mL in 20 mL of a filtered solution comprising aqueous
formaldehyde 1-9% (w/v) in Cellpack (Toa Medical Electronics Company, Kobe, Japan). Fifty /iL samples were aspirated through a 30 ^ m capillary electrode of a Coulter Counter (Model ZM, Coulter Electronics Ltd, Luton Beds). The distribution of cell size was determined by a channel analyser (Channellyzer 256, Coulter Electronics
Ltd). At each sample point 20,000 to 25,000 cells were measured from each culture. Background counts were performed with uninoculated broth, which was identically diluted in Cellpack.
Outer membrane proteins of P. aeruginosa PAOl and CM41
Outer membrane proteins (OMPs) were examined from P. aeruginosa PAO1 and CM41 cultures that had been grown in AMN3 or SMMH.
Harvesting of bacteria grown in AMN3. Cultures that were grown: (a) overnight in
100 mL of AMN3 or (b) to log phase in 200 mL AMN3 without addition of antibiotic or (c) to log phase in 400 mL AMN3 with antibiotic being added for 90min, as described above. In the last case cells were harvested either immediately after removal of antibiotic with /?-lactamase or after a recovery period of 1 h at 37°C. Harvesting in all cases was by centrifugation at 10,000 g and 4°C for 15 min. After harvesting, the cells were washed with 0-9% saline and resuspended in 5 mL 10 mM HEPES buffer, pH 7-4.
Growth and harvesting of bacteria in SMMH for OMP analysis. Overnight AMN3
cultures were diluted to give an OD540nm reading of 0-8; subsequently 0-3 mL portions
of the diluted cultures were added to 15 mL volumes of SMMH in 100 mL conical flasks. The resulting SMMH cultures were incubated at 37°C with continuous shaking at 150rpm for 20 h. Cells were then harvested by centrifugation at 10,000 g and 4°C for 10 min, resuspended in culture volumes of 0-9% saline, and centrifuged at 8-5 g for 10 min. The pellet of intact murine cells was discarded. Bacterial cells were subsequently collected by centrifugation at 10,000 g and 4°C for 15 min and resuspended in 2 m L 10 mM HEPES buffer, pH 7-4. An uninoculated SMMH culture was treated identically and subsequently electrophoresed to distinguish between bacterial and murine proteins on SDS gels.
Extraction of outer membranes. Cell suspensions in HEPES buffer were disrupted by
passing twice through a French Pressure Mini-Cell (Aminco; SLM Instruments Inc, Urbana, Illinois, USA) at 980 kg/cm2. Unbroken cells were sedimented by
centrifu-gation at 5000 g for 10 min and 4°C and discarded. Subsequent operations were as described by Niven, Donga & Archibald (1989), except that samples containing 10/ig protein per lane were separated by SDS-PAGE on 12% single concentration acrylamide Mini-PROTEAN II gels (Bio-Rad Laboratories Ltd, Hemel Hempstead, Herts.).
Pharmacokinetics of imipenem in leucopenic mice
Administration of imipenem and preparation of plasma and muscle samples. In order
to establish the period for which the concentration of imipenem in plasma and in muscle exceeded the MIC, single dose pharmacokinetics were determined. Fifty leucopenic mice were each injected intraperitoneally with 200mg/kg imipenem in 400/zL volumes of pyrogen-free sterile saline. At intervals, groups of five mice were killed.
To determine imipenem plasma concentrations, blood was withdrawn and immedi-ately centrifuged for 5 min at 10,000 g. Plasma (approximimmedi-ately 250 ^ L per mouse) was mixed with an equal volume of cooled buffer to stabilise inipenem. This consisted of 1 M MOPS buffer:ethylene glycol (1:1) pH 6-8 (Finch et al., 1986). The mixture was quickly frozen on solid carbon dioxide and stored at - 8 0 ° C .
To determine the concentrations of imipenem in muscle tissue, all muscle from the left thigh was dissected from each mouse and rinsed in a cooled filter-sterilised buffer
The postantibiotic effect of imipenem 491 for stabilising imipenem in tissue (10HIM MOPS:ethylene glycol (1:1) pH 70). The muscles from individual mice were blotted dry, weighed and then homogenised with a Polytron tissue homogeniser (Kinematica, Lucerne, Switzerland) in 3 mL volumes of the same buffer. The resulting homogenates were centrifuged at 4000 g at 4°C for 20 min. One mL of the supernatant ('clarified muscle homogenate') was quickly frozen on solid carbon dioxide and subsequently stored at — 80°C before bioassay.
Bioassay. Concentrations of imipenem in the plasma and muscle homogenate samples
were determined by an agar well diffusion assay using Antibiotic Medium Number 1 agar seeded with Micrococcus luteus ATCC 9341 (107cfu/mL). Wells were filled with
50 n L of samples or imipenem standards. For assays of imipenem in plasma, imipenem standards of 128 to 0-06 mg/L as doubling dilutions in pooled mouse plasma were diluted two-fold with the buffer for stabilising imipenem in plasma and quickly frozen on solid carbon dioxide and stored at — 80°C. For assays of imipenem in muscle tissue, imipenem standards of 128 to 006mg/L in doubling dilutions were prepared and diluted in SMMH. These samples were also quickly frozen on solid carbon dioxide and stored at - 8 0 ° C .
Standards were repeated five times and samples repeated twice. After 18 h incubation at 37°C, inhibition zone diameters were measured and the imipenem concentrations in muscle (/ig/g) and plasma (mg/L) were calculated.
In-vivo PAE of imipenem
The PAEs of imipenem for P. aeruginosa PAOl and its PAE deficient mutant, CM41, were studied in parallel in a thigh infection model in leucopenic mice. The experiment was performed on two separate occasions. In each individual PAE experiment the level of leucopenia was measured by bleeding five uninfected mice and counting their leucocytes, as described above.
To prepare the inoculum, overnight broth (AMN3) cultures were diluted 1000-fold in fresh warm (37°C) AMN3 and incubated at 37°C with shaking at 150 rpm for 8 h until the cultures reached late log or early stationary phase. The cultures were then mixed with equal volumes of filter-sterilised 20% (w/v) glycerol and stored at — 140°C in 200 / J L aliquots, each containing 108cfu. These frozen stock cultures (2 x 200/zL
aliquots) were thawed when needed, diluted in 40 mL of fresh pre-warmed (37°C) AMN3, and incubated at 37°C with shaking at 150 rpm for 3 h, to give log phase cells. The OD^on,,, of the cultures was adjusted to 0-04 by dilution with AMN3, corresponding to approximately 107cfu/mL. The number of cells was confirmed by viable count.
Leucopenic mice were infected with 107cfu from these log phase cultures by injection
of 200 pL volumes into left thigh muscle. In each experiment 65 animals were infected with the parent strain and 65 with the mutant.
Imipenem (200mg/kg) was injected intraperitoneally 2h after infection, in 400/JL volumes of pyrogen-free sterile saline into 30 mice from each group. At two hourly intervals for the next 12 h, sets of five mice from each of the four groups (PAOl-infected, treated, n = 30; PAOl-infected, untreated, n = 35; CM41-infected, treated, n = 30; CM41-infected, untreated n = 35) were killed. The left thigh muscles were dissected, rinsed in cooled saline, blotted dry and weighed. Muscles from the individual animals were homogenised in 3 mL volumes of cooled saline, using a Polytron tissue homogen-iser. The numbers of bacteria in each individual muscle homogenate were quantified. Counts of the mutant CM41 were made after 48 h, since colonies were too small to
count after 24 h incubation. Means and S.D.S of the numbers of bacteria per gram of muscle were computed for the groups of five mice killed at each time interval.
The PAE was calculated by a method that took account of the spread of data from individual animals at each time point. Linear regression analysis was performed on the logarithms of the viable counts obtained from individual animals between 4 and 10 h after infection for the mice that were treated with antibiotic and between 2 and 8 h for the animals in the control groups. The regression coefficient (i.e. the slope of the log viable count vs time graph) gave the bacterial growth rate, i.e. increase in log viable counts per hour. The reciprocal of this value was the period required for a 1 log increase in viable count, which corresponds to the period normally used as a basis for calculating the duration of the PAE (equation 1). The PAE was calculated by the equation:
P A E = 7m- Cm; equation5
where Tm was the period for the viable counts of bacteria from treated mice to increase
by 1 log; Cm was the period for a similar increase in the viable counts of bacteria in
untreated mice. Tm and Cm were measured from a time point 2 and 0 h after imipenem
administration respectively, by which time imipenem was no longer detectable in the muscle homogenates of the treated mice and its concentration at the site of infection was probably below the MIC (see Discussion).
Data analyses
The mean S.D. of the PAEs measured in vitro were calculated and compared by unpaired /-tests. PAEs measured in vivo were compared by a modified /-test that compared pairs of regression coefficients (i.e. bacterial growth rates calculated above) thus allowing use of data from individual animals (Bailey, 1992).
Generation times (g) were calculated by linear regression analysis of plots of log cfu/mL vs time or for cultures in mid-log phase or of log cfu/g on time, for bacteria obtained from individual animals between 2 and 8 h after infection, as appropriate. The regression coefficient (k) gave the growth rate. Thus:
g — log 2/k. equation 6
Results
PAE after repeated exposure to imipenem in chemostat
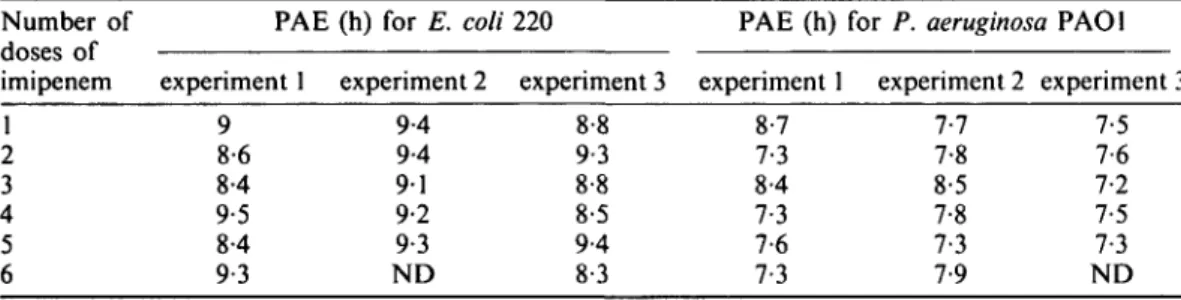
PAEs after successive doses of imipenem are shown in Table I. Even after six successive exposures to imipenem, the PAE for both the E. coli and P. aeruginosa populations did not change. The PAEs measured in the chemostat had an apparently longer duration than those measured in batch culture. However, the definition of the PAE differs between the two methods and so their results are not directly comparable. Firstly, in the chemostat there was no comparison with a control; secondly, bacterial elution continued during the PAE and some regrowth would be required to balance this factor; thirdly, some antibiotic was still present whilst recovery was being measured, whereas in batch culture experiments, antibiotic was completely removed before recovery was measured.
Ninety P. aeruginosa colonies were examined from spread plates prepared for viable counts to imipenem. Five isolates were discarded because they were less susceptible to
Table I. Duration of PAEs observed in continuous culture after successive doses of imipenem (peak 10 mg/L, r,/2 = 2h) Number of doses of imipenem 1 2 3 4 5 6 PAE experiment 1 9 8-6 8-4 9-5 8-4 9-3 (h) for E. coli experiment 2 9-4 9-4 9 1 9-2 9-3 N D 220 experiment 3 8-8 9-3 8-8 8-5 9-4 8-3 PAE (h) experiment 1 8-7 7-3 8-4 7-3 7-6 7-3
for P. aeruginosa PAO1 experiment 2 7-7 7-8 8-5 7-8 7-3 7-9 experiment 3 7-5 7-6 7-2 7-5 7-3 ND ND, Not done.
The PAE was defined as the period required for the viable counts to increase by 1 log after the antibiotic concentrations had fallen to the MIC.
Table II. Comparison of MICs, MBCs and PAEs for P. aeruginosa PAO1 and its PAE mutant, CM41
Values of parameter measured for
Parameter measured PAO1
0-5 1 1-5 + 0-2 1-6 + 0-2 1-5 0-7 015 2-5 3-0 + 0-2 CM41 0-5 1 0-2 + 0-2 0-6 + 0-1 0-3 0-3 015 2-5 1-0 + 0-2
Comparison of PAEs for PAO1 and CM4I by unpaired /-test
/> =
I
In AMN3:
MIC of imipenem (mg/L) MBC of imipenem (mg/L)
PAE of imipenem by viable counts (h)*
PAE of imipenem (10 mg/L) by incorporation method (h)* PAE of imipenem (10 mg/L) by impedance method (h), dS/df PAE of imipenem (10 mg/L) by impedance method (h), ttd'' In chemostat medium:
MIC of imipenem (mg/L) MBC of imipenem (mg/L)
PAE of imipenem (3 mg/L) by viable counts (h)*
<00I°
<001" "Significantly different.
''PAE is the mean + S.D. of three experiments.
rPAE measured in DWI broth and calculated from the period the cultures took to reach their maximum rate of change in conductance (see equation 3). PAE is derived
from a single experiment.
imipenem than their parent in disc susceptibility tests. The PAEs for the remaining colonies were measured by impedance (and calculated according to equation 3) with the parent strains tested in parallel. Two P. aeruginosa isolates had reduced PAEs. In one case the PAE was 0-8 h shorter than the parent (0-7 cf. 1-5 h), in the other the PAE was
1-2 h shorter (0-3 cf. 1-5 h). When the PAEs were determined by viable counts, only the latter isolate, designated CM41 was confirmed to have a shorter PAE than the parent (0-1 cf. 1 -5 h). The PAE for the former isolate was 1-4 h and was discarded, whereas CM41 was subsequently studied in detail (Table II). None of the 90 E. coli colonies examined had a shortened PAE.
In-vitro characterisation of PAE mutant, CM41
In AMN3, generation times for both CM41 and its parent, PAOl were 32 min; in the chemostat medium their generation times were both 58 min. However, P. aeruginosa CM41 grew more slowly than its parent on nutrient agar: PAOl formed visible colonies after 24 h incubation at 37°C, but CM41 required an additional 24 h incubation at room temperature (c. 21 °C) before colonies were large enough to count.
MICs, MBCs and PAEs for the parent and mutant are compared in Table II. The MICs and MBCs of antibiotics for this mutant did not differ from those for the parent when measured in AMN3. P. aeruginosa PAOl and CM41 were as sensitive to imipenem/cilastatin as to imipenem itself. When the MICs of imipenem/cilastatin for P. aeruginosa PAOl and CM41 were determined in SMMH the values were four-fold above those in AMN3 and eight-fold higher for CM41.
The PAEs of imipenem determined from viable counts and by the incorporation of the peptidoglycan precursor GlcNac in AMN3 for P. aeruginosa CM41 were significantly shorter than for P. aeruginosa PAOl (P <00l, unpaired /-test). When measured by impedance, the PAE of imipenem for the parent was 1-5 h and that for the mutant was 0-3 h when calculated from the period required for the rate of change in conductance to be maximum (see equation 3) and 0-7 and 0-3 h respectively when calculated from the period for growth to be first inferred (see equation 2).
Because CM41 was isolated in the chemostat medium, its PAEs in this broth were also considered. When bacteria were exposed to 3 mg/L imipenem (giving the same ratio above the MIC as that observed with 10 mg/L in AMN3), the mean PAE for P. aeruginosa PAOl was 3 0 h and that for CM41 was 10h. These PAEs were longer than those determined in AMN3, but the difference between them remained significant (P < 0 0 1 , unpaired /-test).
The stability of the mutant was not investigated, but its PAE deficiency was not lost upon serial subculture (up to four) on antibiotic-free agar plates. The PAEs of imipenem/cilastatin were not different from the PAEs of imipenem on its own for both P. aeruginosa PAOl and for CM41.
Changes in cell volume during the PAE
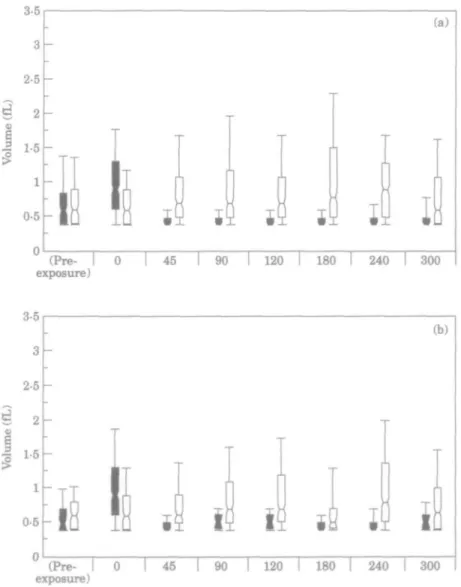
Figures l(a) and (b) shows the cell size distributions of PAOl and CM41 cultures after 90 min exposure to imipenem. After a 90 min exposure to imipenem, the median cell volume of both PAOl and CM41 cultures increased and the population became more
The postantibiotic effect of imipenem 49S
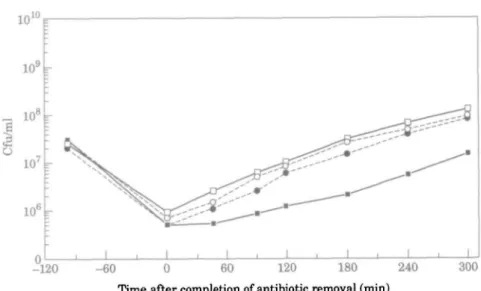
heterogeneous. However, within 45min of antibiotic removal, the median cell volumes in the imipenem-exposed cultures of both PAOl and CM41 became smaller than in the control and cell dimensions became more homogeneous. Over the next 4-25 h the median volume of the CM41 cells increased whilst remaining smaller than that of the control cultures, whereas the median volume of the antibiotic-exposed PAOl cells did not increase. The findings are consistent with the shorter PAE for CM41 than for PAOl. Changes of the viable counts of these cultures with time are shown in Figure 2. (Pre- I 0 exposure) 45 [ 9 0 I 120 I 180 T 240 I 300 (Pre- I 0 exposure) 45 I 90 I 120 I 180 1 240 I 300
Time after completion of antibiotic removal (min)
Figure 1. Cell volume distribution in cultures of P. aeruginosa (a) PAOl and (b) CM41 during regrowth
after 90 min exposure or not to imipenem (lOmg/L). • , imipenem exposed culture; D, control culture. The box indicates the 25th and 75th percentiles and the central line is the median. The points at the end of the whiskers are the 10th and 90th percentiles. 1 femptolitre (fL) = 10~15 L.
-120 - 6 0
Time after completion of antibiotic removal (min)
Figure 2. Regrowth curves of P. aeruginosa PAOI and CM41 cultures after 90 min exposure or not to
imipenem (10 mg/L) • . CM41 imipenem-exposed culture; O, CM41 control culture; • , PAOI imipenem-ex-posed culture; D, PAOI control culture.
Outer membrane proteins of P. aeruginosa PAOI and CM41
When OMP profiles of cultures grown in AMN3 were examined, a protein with a molecular weight of 52 kDa was present in consistently smaller amounts in extracts from
mol wt (kDa) 200 11625 97-4 66-2 45 31 2 1 5 1A I B 2A 2B 3A 3B 4A 4B 14-4 6-5
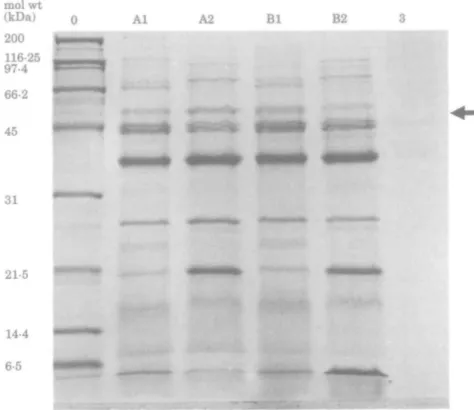
Figure 3. SDS-PAGE, on a 12% single concentration gel, of OMPs from P. aeruginosa PAOI (A) and
CM41 (B) grown in AMN3. Lanes: 1, overnight culture; 2, log-phase culture; 3, 0 min after antibiotic removal; 4, 60 min after antibiotic removal. Lane 0 contains molecular weight standards. The 52 kDa protein, present in smaller amounts in CM41 than in PAOI, is arrowed.
The postantibiotic effect of imipenem 497 mol wt (kDa) o Al A2 Bl B2 3 200 116-25 97-4 66-2 45 I M M mm*k mtaetH^ *•<+** * -31 21-5 14-4 6 5
Figure 4. SDS-PAGE, on a 12% single concentration gel, of OMPs from P. aeruginosa PAO1 (A) and
CM41 (B) grown overnight in SMMH (lane 1) and in AMN3 (lane 2). Lane 3 contains uninoculated SMMH. Lane 0 contains molecular weight standards. The 52 kDa protein is arrowed.
the mutant CM41 than from the parent PAO1 (Figure 3). This occurred whether or not the cells were exposed to imipenem. However, when mutant CM41 was grown in SMMH, the 52 kDa protein was synthesized at similar levels in both the parent and mutant (Figure 4). Moreover, in these conditions the amount of this protein was similar to that present in PAO1 after growth in AMN3.
Pharmacokinetics of imipenem in leucopenic mice
The dosage regimen used to induce leucopenia resulted in a mean + S.D. leucocyte count of 1040 + 210 cells/^L (94% reduction). The dosage regimen was lethal to 8% (14/175) of the mice. All deaths occurred within 24 h of the second injection.
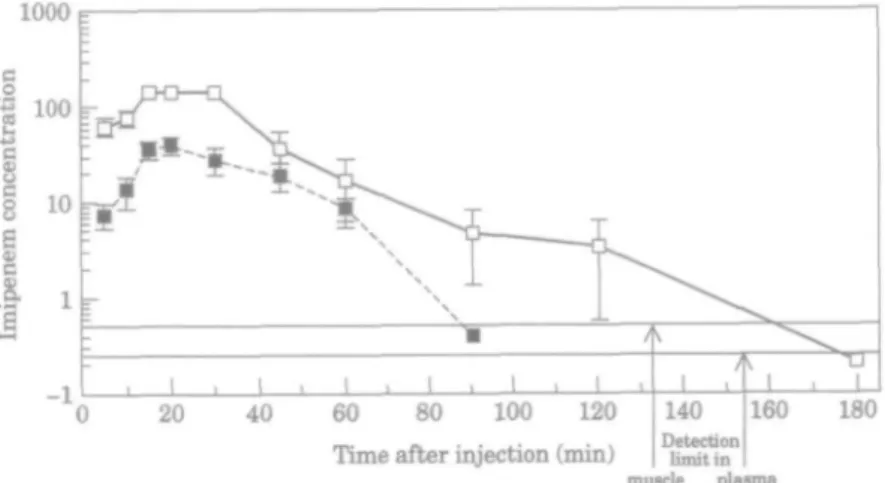
Bioassay allowed the detection of ^0-25 mg/L imipenem in plasma and ^0-5 ng imipenem in muscle homogenates. Imipenem concentrations in plasma and muscle homogenates from leucopenic mice, after a single 200 mg/kg intraperitoneal dose are shown in Figure 5. The peak imipenem concentrations were 146mg/L in plasma and 39-6/xg/g in muscle and the half-lives in plasma and in muscle were 20 and 23min respectively. Imipenem was detectable in the muscle within 5 min of the intraperitoneal
injection and no longer detectable (i.e. <O-5/tg/g) 2 h after injection. The antibiotic concentrations in plasma exceeded the MIC for the test strains for 2 h. Those in muscle homogenate were above MICs for c. 45 min; however, inhibitory concentrations almost certainly applied for longer in the interstitial fluid of the muscle tissue (see Discussion).
In vivo PAEs
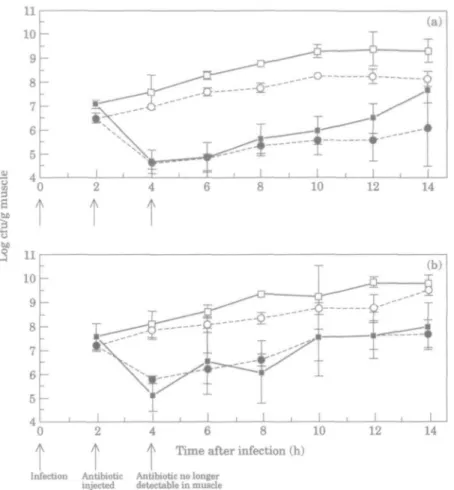
Time course of infection. The growth of P. aeruginosa PAOl and CM41 in
imipenem-treated and -untreated mice is shown in Figure 6. Organisms were recovered in pure culture. Four h after infection, and 2 h after dosage, no antibiotic remained detectable in the mice. Between 4 and 10 h after infection the bacterial counts in the antibiotic-untreated animals increased exponentially but the infection remained localised in the thigh muscle. After 12 h, bacteria appeared in the blood untreated animals and the number of cfu/g muscle stabilised.
Bacterial growth rates. In both experiments A and B the inocula of P. aeruginosa
PAOl and CM41 were matched to ±0-5 log cfu/g muscle. The leucopenia attained in each experiment was similar to within 700 cells//iL. The generation time of
P. aeruginosa PAOl was 61 min (experiment A and B) and that of CM41 was 77 min
and 97 min in experiment A and B respectively. Although these values were not identical, the regression coefficients of log viable counts against time were not significantly different between the parent and the mutant ( / > > 0 1 , comparison of regression coefficients, Bailey 1992). Moreover, although the mutant tended to grow more slowly in experiment B than in experiment A, this difference was not statistically significant.
Killing and regrowth of bacteria. In experiment A, the viable count of P. aeruginosa
PAOl decreased by log 2-38 cfu/g muscle within 2 h after injection of imipenem and that of P. aeruginosa CM41 decreased by log 1-88 cfu/g muscle (Table HI). In experiment B, the viable count of P. aeruginosa PAOl decreased by log 2-47 cfu/g muscle within 2 h after injection of imipenem and that of/3, aeruginosa CM41 by log 1-41 cfu/g muscle
1000
20 40 60 80 100 120
Time after injection (min) 140 Detection
limit in
muscle Dl8sma
160 180
Figure 5. Imipenem concentrations • , /jg/g in muscle; • , mg/L in plasma. Each point represents the mean
The postantibiotic effect of imipenem
t t t
4 6 8 10 Time after infection (h)
12 14
Infection Antibiotic
injected Antibiotic no longerdetectable in mtucl .
Figure 6. (a) Experiment A; (b) experiment B. O Mice infected with mutant, CM41 and untreated; • , mice
infected with mutant, CM41 and treated with imipenem; • • mice infected with parent, PAO1 and untreated; • , mice infected with parent, PAO1 and treated with imipenem; Each point represents the mean viable count (cfu/g muscle) from five mice. Error bars indicate S.D.
(Table III). The difference in the bactericidal activity of imipenem in the two experiments was not statistically different (P = 0-77, unpaired /-test).
The durations of the PAEs observed in the individual experiments are shown in Table III. As no significant difference in growth rates of PAO1 and CM41 was found in untreated mice, the growth rates of these organisms in treated animals were compared in order to establish whether there was a significant difference in the PAEs of imipenem for P. aeruginosa PAO1 and CM41 in each experiment. In experiment A, the PAEs of imipenem for P. aeruginosa PAO1 and CM41 were 1 0 and 1-6 h respectively. The PAEs were not significantly different from each other (P>0l comparison of regression coefficients, Bailey, 1992). In experiment B, the PAEs of imipenem for P. aeruginosa PAO1 and CM41 were found to be - 0 - 9 and —1-8 h respectively. These PAEs were also not significantly different from each other ( P > 0 1 comparison of regression coefficients, Bailey 1992), but were significantly different from the PAEs measured in the first experiment (P < 0 1 unpaired /-test).
separate experiments Log cfu/g in muscle
Decrease in log Generation time before 2 h after cfu/g, 2 h after
Organism Experiment (min) imipenem injection imipenem injection imipenem injection PAE (h) PAO1 CM41 flPAOl CM41 A A B B 61 77 61 97 707 6-48 7-59 7-23 4-69 4-60 512 5-82 2-38 1-88 2-47 1-41 10 1-6 - 0 - 9 - 1 - 8
The postantibiotic effect of imipenem 501
Discussion
/S-Lactams have been used more extensively than any other group of antibiotics. They are relatively non-toxic to man but their activity depends on their serum or tissue concentrations exceeding MICs for the pathogen (Drusano, 1988); as the half-lives of many of these compounds are short, frequent dosing may be needed. A PAE would potentially allow greater tolerance of delayed administration. Although PAEs of these compounds have been widely claimed, only one study (McGrath et al., 1993) examined the stability of /?-lactam PAEs following multiple doses. The results obtained in a chemostat in our study for P. aeruginosa and E. coli agree with those of McGrath et al. (1993) for P. aeruginosa in batch culture experiments, in that multiple doses of imipenem did not cause gross over-run of cultures by mutants with a shortened PAE. This suggests that the PAE is a stable phenomenon, which would be clinically favourable in assessing the possible significance of the PAE. However, some bacterial cells may have a shortened PAE. Wilson & Rolinson (1979) demonstrated, using differential interference contrast microscopy, that individual Staphylococcus aureus cells within a culture exhibited variable periods of growth suppression after exposure to penicillin. Colonies were therefore selected at random from plates inoculated with samples taken from the chemostat. Those isolates for which susceptibility to imipenem had not changed were screened for a shortened PAE of imipenem using the impedance technique since this allowed rapid screening of many samples. However, this screening method did not allow the screening of sufficient samples to establish the frequency of mutation to a shorter PAE and thereby establish whether exposure to imipenem increased this frequency. Nevertheless, a single P. aeruginosa colony, designated CM41, was found to have a consistently shorter imipenem PAE compared with that of its parent. The isolation of a PAE-lacking mutant should help to elucidate the basis of the PAE of carbapenems and penems. To date no previous PAE deficient mutant has been reported.
Numerous in-vitro experiments confirmed a difference in the PAE response for PAO1 and CM41. In batch culture the PAE of imipenem for the mutant, CM41 was significantly shorter than that for the parent. PAEs of imipenem were also shorter for CM41 than for PAO1 when measured by impedance and by the incorpor-ation of radiolabelled GlcNac. The former method measured gross cellular metab-olism whereas the latter measured peptidoglycan synthesis. Despite its shortened PAEs, the mutant had unaltered susceptibilities to the antibiotics studied, suggesting that the primary determinant of the PAE differed from the primary target of anti-biotic action. Moreover, no differences between growth rates of parent, PAO1, and mutant CM41, were noted in liquid media (AMN3 or chemostat medium); however, CM41 formed smaller colonies on agar, suggesting slower growth and/or smaller cell size.
Shortly after drug removal, imipenem-exposed cells of both PAO1 and CM41 became smaller than the unexposed cells and had a more homogenous cell size. Subsequently, the median volume of P. aeruginosa CM41 cells gradually increased, but did not return to that of antibiotic-untreated cultures within the 5 h monitoring period, whereas the median volume of PAO1 cells remained constant and much smaller than that of antibiotic-untreated cultures. The tendency of CM41 cells to resume a normal cell size distribution after exposure to imipenem was consistent with its shorter PAE: it should be pointed out that 3 h after antibiotic removal (after the end of the PAE as defined in equations 1, 2, 3 and 4) the cells of both PAO1 and CM41 remained smaller than
those in control cultures. Discrepancies between the PAE measured by viable counts and the period before which cells resumed normal morphology were also noted by Guan & Burnham (1992). They found that E. coli cells did not resume normal cell size for at least 4 h after treatment with the quinolone enoxacin, whose PAE was 0-7 h. Thus changes in cell size should be considered in addition to inhibition of bacterial growth, when studying the PAE.
When grown in AMN3, CM41 lacked a 52 kDa OMP that was present in PAOl. This protein had a molecular weight close to that reported (45 to 49 kDa; Trias & Nikaido, 1990) for the D2 'carbapenem specific' porin of P. aeruginosa. However, its identity as D2 is open to question: loss of D2 protein from P. aeruginosa is generally associated with imipenem resistance (Trias & Nikaido, 1990), but CM41 was as susceptible as PAOl, in AMN3. There are no obvious reasons why loss of this protein should result in a shorter PAE. When cells were grown in SMMH instead of AMN3, the 52 kDa protein was expressed as strongly in CM41 as in PAOl. Moreover, there was no difference between the PAEs of imipenem for PAOl and CM41 when studied in vivo in the mouse thigh infection model. It is therefore possible that the amount of the 52 kDa OMP present in a cell may be related to its PAE response. It would be interesting to determine whether CM41 could show a PAE to imipenem when grown in vitro in SMMH. Detection of PAE in SMMH would provide strong support for the proposed role of the 52 kDa protein in the induction of a PAE of imipenem. The detection of this OMP by fluorescent antibodies could be used as the basis for the rapid screening of individual cells for an imipenem PAE.
The PAEs of imipenem for PAOl and CM41 were investigated in an animal model to establish whether in-vitro findings could be confirmed in vivo. If differences between the PAEs for PAOl and CM41 could be confirmed in vivo, then the significance of PAE might be established. Antibacterial treatment entailed a single 200 mg/kg intraperitoneal dose of imipenem, giving an antibiotic concentration above the MIC for 120 min in plasma. Imipenem concentrations in muscle homogenate remained above MIC for only 45 min. However, as imipenem does not readily enter mammalian cells, inhibitory concentrations in interstitial fluid seem certain to have persisted for longer (Carbon, 1990). So it is likely that in vivo, the bacteria in interstitial fluid were exposed to antibiotic above the MIC for at least 90 min, as in the in-vitro experiments.
Infection experiments were performed on two separate occasions, designated A and B. In experiment A the PAEs for PAOl and CM41 were 10 and 1-6 h respectively whereas in experiment B the PAEs for PAOl and CM41 were negative, being —0-9 and
— 1 -8 h respectively. Whilst it is difficult to reconcile these two divergent sets of results, the one consistent point from both experiments was that the PAEs for PAOl and CM41 were not significantly different from each other. This was in contrast to the in-vitro situation where the PAE of imipenem was significantly and consistently shorter for mutant CM41 than for parent, PAOl as assayed by a range of methods.
The large variation in the results between the in-vivo experiments A and B is probably due to natural variation amongst mice. The source of this variation is, however, uncertain and was not related to the degree of leucopenia, which was similar in the animals used for both experiments. Variation amongst the bacterial cultures is a less likely explanation since the same inoculum was used for both experiments; moreover the growth rates of bacteria in untreated mice did not differ significantly between experiment A and B. The bactericidal activity of imipenem did not differ between the two experiments.
The postantibiotic effect of imipenem 503 Gudmundsson et al. (1986) also observed considerable variation in the PAEs observed in vivo. These authors observed PAEs of imipenem for P. aeruginosa ATCC 27853 of 1-4 h and 4-6 h in two experiments. On the other hand, Renneberg & Walder (1989) did not observe such high inter-run variation in the PAE of imipenem for
P. aeruginosa ATCC 27853. These groups, however, used different models:
Gudmundsson et al. (1986) used a thigh infection model in neutropenic mice, whereas Renneberg & Walder (1989) used a cotton thread infection model in normal mice. The latter authors also observed in-vitro PAEs of imipenem for P. aeruginosa ATCC 27853 of 1-8 + 0-3 h. Thus demonstration of PAE in vitro seems to correspond to PAE in vivo. However, Hessen, Pitsakis & Levison (1988), working with a rat endocarditis model, failed to detect an in-vivo PAE of imipenem for a strain of P. aeruginosa which had a 3 h PAE in vitro. Likewise, although the combination of imipenem and gentamicin had a 5-4 h PAE in vitro, it gave no PAE in vivo (Hessen et al., 1988). Furthermore, Jabes et al. (1992) did not observe an in-vitro PAE of the penem FCE 24964 for
Klebsiella pneumoniae and E. coli after exposure to 5 x MIC for 2 h. However, when
the PAE (of its orally-absorbed dioxolemethyl ester, FCE 25199) was studied in a tissue cage fluid infection model in mice, PAEs exceeding 5 h were observed. Overall, examination of reports of in-vivo PAEs of carbapenems and penems and our own results suggests the need for caution in drawing conclusions about their in-vivo PAEs from in-vitro results.
In man, imipenem is usually administered at 6 hourly intervals (i.e. four-times a day). The peak serum concentration is c. 35 mg/L in healthy subjects following a 0-5 g intravenous dose and the half-life is 1—1-4 h (MacGregor, Gibson & Bland, 1986). In order to decrease the dosage frequency to three times a day (i.e. to administer it at 8-hourly intervals) the compound should induce a PAE of > 2 h in vivo. Thus, PAEs of < 2 h of imipenem are unlikely to be clinically useful. PAEs measured in vitro and
in vivo in this study were less than 2 h. Imipenem has an approximately four-fold shorter
half-life in mice than in humans (Fliickiger, Segessenmann & Gerber, 1991). Since the duration of the PAE is related both to the concentration of drug and to the duration of exposure, extrapolation of the animal data to man is complicated. In particular, it seems likely that the mouse infection models will underestimate the likely duration of any PAE in man. Use of infection models in mice with impaired renal function, such as that described by Craig, Redington & Ebert (1991) or models in which drug is administered in decreasing doses at short intervals to simulate human pharmacokinetics in mice (Fliickiger et al., 1991) should result in a longer PAE of imipenem. Whilst these in-vivo experiments considered only one strain and mutant in a single experiment, they do underscore the difficulty of extrapolating in-vitro data to the in-vivo situation, since these results suggest little consistency in PAE response to imipenem in vivo, even with organisms that showed a consistent in-vitro PAE response.
In conclusion, this study has shown that repeated exposure to imipenem does not result in a rapid selection of mutants which lack a PAE. This showed that the PAE for individual strains is a stable in-vitro phenomenon. However, a single P. aeruginosa mutant which lacked an imipenem PAE was isolated. The basis of the mutation is currently not known, but a 52 kDa OMP was present in smaller amounts in a
P. aeruginosa mutant with a shortened PAE. Moreover, following antibiotic exposure,
cells were found to be smaller than antibiotic-unexposed cells. Although the significance of such smaller cells is uncertain future studies of the PAE should consider such factors in addition to suppression of bacterial regrowth as measured by viable counts.
Moreover, this study has shown that caution is warranted in inferring any clinical significance of the PAE of imipenem from in-vitro data.
Acknowledgements
We are grateful to Sonja Tobler for her excellent technical assistance and to Dr J. Blaser for helpful discussion.
References
Bailey, N. T. J. (1992). Statistical Methods in Biology, 2nd edn, pp. 90-8. Cambridge University Press, Cambridge.
Bundtzen, R. W., Gerber, A. U., Cohn, D. L. & Craig, W. A. (1981). Postantibiotic suppression of bacterial growth. Reviews of Infectious Diseases 3, 28-37.
Bustamante, C. I., Drusano, G. L., Tatem, B. A. & Standiford, H. C. (1984). Postantibiotic effect of imipenem on Pseudomonas aeruginosa. Antimicrobial Agents and Chemotherapy 26, 678-82.
Carbon, C. (1990). Significance of tissue levels for prediction of antibiotic efficacy and determination of dosage. European Journal of Clinical Microbiology and Infectious Diseases 9, 510-6.
Chin, N. X. & Neu, H. C. (1989). In-vitro activity of FCE 22101 and synergy studies with other antimicrobial agents. Journal of Antimicrobial Chemotherapy 23, Suppl. C, 95-101. Craig, W. A., Redington, J. & Ebert, S. C. (1991). Pharmacodynamics of amikacin in vitro and
in mouse thigh and lung infections. Journal of Antimicrobial Chemotherapy 27, Suppl. C, 29-40.
Drusano, G. L. (1988). Role of pharmacokinetics in the outcome of infections. Antimicrobial Agents and Chemotherapy 32, 289-97.
Finch, R. G., Craddock, C , Kelly, J. & Deaney, N. B. (1986). Pharamcokinetic studies of imipenem/cilastatin in elderly patients. Journal of Antimicrobial Chemotherapy 18, Suppl. E, 103-7.
Fliickiger, U., Segessenmann, C. & Gerber, A. U. (1991). Integration of pharmacokinetics and pharmacodynamics of imipenem in a human-adapted mouse model. Antimicrobial Agents and Chemotherapy 35, 1905-10.
Guan, L. & Burnham, J. C. (1992). Postantibiotic effect of CI-960, enoxacin and ciprofloxacin on Escherichia coli, effect on morphology and haemolysin activity. Journal of Antimicrobial Chemotherapy 29, 529-38.
Gudmundsson, S., Vogelman, B. & Craig, W. A. (1986). The in-vivo post antibiotic effect of imipenem and other new antimicrobials. Journal of Antimicrobial Chemotherapy 18, Suppl. E, 67-73.
Hessen, M. T., Pitsakis, P. G. & Levison, M. E. (1988). Absence of a postantibiotic effect in experimental pseudomonas endocarditis treated with imipenem, with or without gentamicin. Journal of Infectious Diseases 158, 542-8.
Jabes, D., Rossi, R. & Delia Bruna, C. (1992). Postantibiotic effect of the oral penem FCE 25199 in vitro and in vivo by a new cage model in mice. In Program and Abstracts of the Thirty -Second Interscience Conference on Antimicrobial Agents and Chemotherapy, Anaheim. Abstract 385, p. 175. American Society for Microbiology, Washington, DC.
Karlowsky, J. A., Zhanel, G. G., Davidson, R. J., Zieroth, S. R. & Hoban, D. J. (1993). In vitro postantibiotic effects following multiple exposures of cefotaxime, ciprofloxacin, and gentam-icin against Escherichia coli in pooled human cerebrospinal fluid and Mueller-Hinton broth. Antimicrobial Agents and Chemotherapy 37, 1154-7.
MacGregor, R. R., Gibson, G. A. & Bland, J. A. (1986). Imipenem pharmacokinetics and body fluid concentrations in patients receiving high-dose treatment for serious infections. Anti-microbial Agents and Chemotherapy 29, 188-92.
Manek, N., Andrews, J. M. & Wise, R. (1986). The postantibiotic effect of imipenem. Journal of Antimicrobial Chemotherapy 18, 641.
The postantibiotic effect of imipenem 505
McDonald, P. J., Craig, W. A. & Kunin, C. M. (1977). Persistent effect of antibiotics on Staphylococcus aureus after exposure for limited periods of time. Journal of Infectious Diseases 135, 217-23.
McGrath, B. J., Marchbanks, C. R., Gilbert, D. & Dudley, M. N. (1993). In vitro postantibiotic effect following repeated exposure to imipenem, temafloxacin and tobramycin. Antimicrobial Agents and Chemotherapy 37, 1723-5.
Nadler, H. L., Pitkin, D. H. & Sheikh, W. (1989). The postantibiotic effect of meropenem and imipenem on selected bacteria. Journal of Antimicrobial Chemotherapy 24, Suppl. A., 225-31. Niven, D. F., Donga, J. & Archibald, F. S. (1989). Response of Haemophilus pleuropneumoniae to iron restriction, changes in the outer membrane protein profile and the removal of iron from porcine transferrin. Molecular Microbiology 3, 1083-89.
Renneberg, J. & Walder M. (1989). Postantibiotic effects of imipenem, norfloxacin, and amikacin in vitro and in vivo. Antimicrobial Agents and Chemotherapy 33, 1714-20.
Roberts R. B., Cowie, D. B., Abelson, P. H., Bolton, E. T. & Britten, R. J. (1957). Studies of biosynthesis in Escherichia coli, 2nd printing. Carnegie Institution of Washington Publication 607, p. 5.
Trias, J. & Nikaido, H. (1990). Outer membrane protein D2 catalyzes facilitated diffusion of carbapenems and penems through the outer membrane of Pseudomonas aeruginosa. Anti-microbial Agents and Chemotherapy 34, 52-7.
Wilson, D. A. & Rolinson, G. N. (1979). The recovery period following exposure of bacteria to penicillins. Chemotherapy 25, 14-22.
Wu, P. J. & Livermore, D. M. (1990). Response of chemostat cultures of Pseudomonas aeruginosa to carbapenems and other /S-lactams. Journal of Antimicrobial Chemotherapy 25, 891-902.