HAL Id: hal-00327835
https://hal.archives-ouvertes.fr/hal-00327835v2
Submitted on 27 Oct 2003
HAL is a multi-disciplinary open access
archive for the deposit and dissemination of
sci-entific research documents, whether they are
pub-lished or not. The documents may come from
teaching and research institutions in France or
abroad, or from public or private research centers.
L’archive ouverte pluridisciplinaire HAL, est
destinée au dépôt et à la diffusion de documents
scientifiques de niveau recherche, publiés ou non,
émanant des établissements d’enseignement et de
recherche français ou étrangers, des laboratoires
publics ou privés.
Airborne study of a multi-layer aerosol structure in the
eastern Mediterranean observed with the airborne
polarized lidar ALEX during a STAAARTE campaign (7
June 1997)
F. Dulac, P. Chazette
To cite this version:
F. Dulac, P. Chazette. Airborne study of a multi-layer aerosol structure in the eastern
Mediter-ranean observed with the airborne polarized lidar ALEX during a STAAARTE campaign (7 June
1997). Atmospheric Chemistry and Physics, European Geosciences Union, 2003, 3 (5), pp.1817-1831.
�10.5194/acp-3-1817-2003�. �hal-00327835v2�
www.atmos-chem-phys.org/acp/3/1817/
Chemistry
and Physics
Airborne study of a multi-layer aerosol structure in the eastern
Mediterranean observed with the airborne polarized lidar ALEX
during a STAAARTE campaign (7 June 1997)
F. Dulac and P. Chazette
Laboratoire des Sciences du Climat et de l’Environnement, Unit´e Mixte de Recherche CNRS-CEA No.1572, CEA Saclay 709, F-91191 Gif-Sur-Yvette Cedex, France
Received: 12 February 2003 – Published in Atmos. Chem. Phys. Discuss.: 15 May 2003 Revised: 20 October 2003 – Accepted: 23 October 2003 – Published: 27 October 2003
Abstract. We present a case study of tropospheric aerosol
transport in the eastern Mediterranean, based on airborne measurements obtained south of Greece on 7 June 1997. Air-borne observations (backscattering lidar at 0.532 µm with polarization measurements, in situ particle counters/sizers, and standard meteorological measurements) are comple-mented by monitoring with Meteosat visible and infrared images and a ground-based sun-photometer, air-mass back-trajectory computations, and meteorological analyses. As already observed from ground-based lidars in the Mediter-ranean region, the vertical structure of the lower troposphere appears complex, with a superposition of several turbid lay-ers from the surface up to the clean free troposphere which is found here above 2 to 4 km in altitude. The aircraft observa-tions also reveal an important horizontal variability. We iden-tify the presence of depolarising dust from northern Africa in the most elevated turbid layer, which is relatively humid and has clouds embedded. The lowermost troposphere likely contains pollution water-soluble aerosols from eastern con-tinental Greece, and an intermediate layer is found with a probable mixture of the two types of particles. The col-umn optical depth at 0.55 µm estimated from Meteosat is in the range 0.15–0.35. It is used to constrain the aerosol backscattering-to-extinction ratio needed for the backscatter-ing lidar data inversion. The column value of 0.017 sr−1is found applicable to the various aerosol layers and allows us to derive the aerosol extinction vertical profile. The aerosol extinction coefficient ranges from 0.03 km−1 in the lower clean free troposphere to more than 0.25 km−1in the marine boundary layer. Values are <0.1 km−1in the elevated dust layer but its thickness makes it dominate the aerosol optical depth at some places.
Correspondence to: F. Dulac
(fdulac@cea.fr)
1 Introduction
The Mediterranean Sea is at the interface between three con-tinents and the Atlantic Ocean. Its atmosphere is severely affected by aerosols from a variety of natural and anthro-pogenic types of continental sources: desert, vegetation, fos-sil fuel and biomass combustion, industry, etc (e.g. Berga-metti et al., 1992; Kubilay and Saydam, 1995; Mihalopou-los et al., 1997; Moulin et al., 1998; Guerzoni et al., 1999; Formenti et al., 2001). Column integrated aerosol data such as those provided by space-borne passive remote sensing in-struments are insufficient to derive natural and anthropogenic contributions to the aerosol load. It has been shown for in-stance that frequent desert dust plumes from northern Africa found over the Mediterranean are lifted over marine or pol-luted European air masses (Bergametti et al., 1989; Dulac et al., 1992). The vertical structure of the aerosols with ele-vated dust layers has been observed in southern Europe with ground-based backscattering lidars (Hamonou et al., 1999; Gobbi et al., 2000; Barnaba and Gobbi, 2001; Papayannis et al., 2001; De Tomasi et al., 2003). Observations within the EU-supported Mediterranean Dust Experiment (MEDUSE; S¨oderman and Dulac, 1998) even revealed a complex dust transport pattern with the systematic superposition of several dust layers from different origins in Africa (Hamonou et al., 1999).
Until recent methodological developments (Sicard et al., 2002; Wandinger and Ansmann, 2002), the ground-based lidars did not allow the observation of the lowermost tro-posphere which contains a significant part of the column aerosol load (e.g. Marenco et al., 1997). Measurement of the aerosol extinction profile down to the surface required to fly the lidar system (e.g. Karyampudi et al., 1998; Chazette et al., 2001). We report here on the use of an airborne polarized lidar system over the eastern Mediterranean (Fig. 1) within the EU-supported programme Scientific Training and Access to Aircraft for Atmospheric Research Throughout Europe
1818 F. Dulac and P. Chazette: Airborne study of a multi-layer aerosol structure in the eastern Mediterranean Athens Peloponnese, GREECE CRETE Isl. EASTERN MEDITERRANEAN LONGITUDE (°E) LA TI TU D E ( °N ) Leg 1 Leg 2
(a)
0 500 1000 1500 2000 2500 3000 3500 4000 4500 5000 1 601 1201 1801 2401 3001 3601 4201 4801 5401 6001 6601 7201 7801Time since 07:47:50 GMT (s)
Fl
ig
h
t al
ti
tu
d
e (m)
21 22 23 24 25 26 27 28 29 30 31 32 33 34 35 36 37 38L
ati
tu
d
e (°N)
Lon
git
ude
(
°E
)
(b)
leg 2
leg 3
leg 4
slow
descent
quick
descent
leg 1
Fig. 1. Flight trajectory from Athens (take-off at 7:52 GMT, 9:52 local time): (a) 2-D projection with emphasis
of constant altitude legs with lidar measurements; (b) altitude (line), latitude (dotted line) and longitude (dashed
line) during all flight. Leg 1 (08:06-08:25 GMT) and leg 2 (08:28-08:48 GMT) occurred at 4660 m in altitude
with downward remote sensing with the lidar. Leg 3 (08:54-09:15 GMT) and leg 4 (09:39-10:02 GMT) occurred
at 2315 m and 900 m, respectively, on the same track as leg 2.
Athens Peloponnese, GREECE CRETE Isl. EASTERN MEDITERRANEAN LONGITUDE (°E) LA TI TU D E ( °N ) Leg 1 Leg 2
(a)
0 500 1000 1500 2000 2500 3000 3500 4000 4500 5000 1 601 1201 1801 2401 3001 3601 4201 4801 5401 6001 6601 7201 7801 Time since 07:47:50 GMT (s) Fl ig h t al ti tu d e (m) 21 22 23 24 25 26 27 28 29 30 31 32 33 34 35 36 37 38 L ati tu d e (°N) Lon git ude ( °E )(b)
leg 2 leg 3 leg 4 slow descent quick descent leg 1Fig. 1. Flight trajectory from Athens (take-off at 7:52 GMT, 9:52 local time): (a) 2-D projection with emphasis
of constant altitude legs with lidar measurements; (b) altitude (line), latitude (dotted line) and longitude (dashed line) during all flight. Leg 1 (08:06-08:25 GMT) and leg 2 (08:28-08:48 GMT) occurred at 4660 m in altitude with downward remote sensing with the lidar. Leg 3 (08:54-09:15 GMT) and leg 4 (09:39-10:02 GMT) occurred at 2315 m and 900 m, respectively, on the same track as leg 2.
Fig. 1. Flight trajectory from Athens (take-off at 7:52 GMT, 9:52 local time): (a) 2-D projection with emphasis of constant altitude legs with
lidar measurements; (b) altitude (line), latitude (dotted line) and longitude (dashed line) during all flight. Leg 1 (08:06–08:25 GMT) and leg 2 (08:28–08:48 GMT) occurred at 4660 m in altitude with downward remote sensing with the lidar. Leg 3 (08:54–09:15 GMT) and leg 4 (09:39–10:02 GMT) occurred at 2315 m and 900 m, respectively, on the same track as leg 2.
(STAAARTE). Model forecasts and real-time monitoring of dust transport with Meteosat (S¨oderman and Dulac, 1998) allowed us to document a case of complex aerosol vertical structure in the lower troposphere with African dust trans-port. To discuss the aerosol vertical structure, we combine the STAAARTE airborne remote sensing and in situ particle counting, meteorological data and air-mass back-trajectories, and Meteosat remote sensing. Special emphasis is put on the lidar data. On one side, lidar signal depolarisation by non
spherical particles is particularly adapted to the identifica-tion of non spherical particles like mineral dust (Iwasaka et al., 1988; Gobbi et al., 2000). On the other side, the aerosol extinction profile is inverted by taking as a constraint the col-umn aerosol optical depth derived from passive remote sens-ing with Meteosat.
2 Observations
2.1 Airborne measurements
Airborne active remote sensing and in situ measurements were performed onboard a twin jet pressurized research air-craft, the Myst`ere Falcon-20 E5, D-CMET, of the German Aerospace Research Establishment (DLR). Details on this platform can be found at http://www.dlr.de/FB/OP/d-cmet e. html and http://www.esf.org/eufar/. The flight (No. 2981) took place over seawater off Greece in the morning of 7 June 1997 (take-off at 9:50 local time, 07:50 GMT). Only about two hours corresponding to the first half of the flight were al-located to this work. Dust from Africa and a minimum in the cloud cover were expected there from remote sensing mon-itoring (Dulac et al., 1997) and predictions of a mesoscale meteorological model including dust transport (Nickovic and Dobricic, 1996; S¨oderman and Dulac, 1998).
Our flight track is plotted in Fig. 1. Standard meteoro-logical parameters were measured during all flight. During the transit flight from Athens international airport to west-ern Crete along NNW-SSE direction at 4660 m, the down-ward viewing backscattering lidar system ALEX of the DLR (Renger et al., 1997) was operated between approximately 37◦N, 23.3◦E and 35.25◦N, 23.65◦E (Fig. 1a). Then the air-craft flew back and forth at different levels south of the Pelo-ponnesian peninsula in a ESE-WNW direction between ap-proximately 35.5◦N, 23◦E and 36.25◦N, 21.5◦E (Fig. 1b). There, it performed 3 legs of about 20 mn each at constant altitude (4660, 2315 and 900 m). During the north-south transit flight (leg 1) and the first east-west leg (leg 2), both at 4660 m in altitude, the lidar was operated at 10 Hz and served to identify in real time the vertical structure of the lower troposphere with a vertical resolution of 15 m. We only analysed measurements performed at 532 nm, includ-ing the parallel and perpendicular polarizations since the UV and infrared channel measurements of the lidar were not found quantitatively exploitable. To improve the signal to noise ratio, we used a binomial low pass filter (Godin et al., 1999) which yielded a vertical resolution of profiles close to 50 m. The Klett’s (1983) forward inversion scheme was used for the lidar inversion in terms of aerosol extinction, assuming a Rayleigh atmosphere in the free troposphere be-low the aircraft. The aerosol backscatter to extinction ratio (BER) was assumed constant and its value was chosen to ad-just the vertically integrated lidar-derived aerosol extinction to the Meteosat-derived aerosol optical depth. Details will be given hereafter. Using the available dual polarisation mea-surements, we also derived the backscattering depolarisation ratio (Young, 1980).
The raw backscattering and depolarisation signals as a function of altitude were used onboard to identify two layers with distinct aerosol properties at 2.3 and 0.9 km in altitude where the two subsequent legs were performed for in situ particle counting and sizing measurements (Fig. 1b). Two
Particle Measuring Systems Inc. (PMS) optical probes were operated at 1 Hz by the GKSS Research Centre: a PCASP-100X (diameter range 0.09–3.25 µm) and a FSSP-100 (2– 32 µm). Each of the PMS probes had 15 channels, but chan-nels of the bigger size range were below or very close to the detection limit for both instruments. We only considered the ranges 0.09–0.325 µm (first 6 channels) and 2–10 µm (first 4 channels), respectively, which seem reliable during the whole flight. Data were smoothed using a moving aver-aging window of 35 s.
2.2 Meteosat data
Full resolution (2500 lines×2500 pixels) Meteosat-6 visible (VIS) and infrared (IR) noon images were acquired daily at 12:00 GMT in the frame of MEDUSE using a Meteosat Primary Data User Station of Data Tools Products (http: //www.data-tools.com) with a 3.1-m antenna. There was un-fortunately no data for 5 June. We use the colour quick-look graphical product which was produced operationally as described in Dulac et al. (1997). It is based on a sim-ple colour encoding of sub-samsim-pled data (ISCCP-B1 for-mat, 832 lines×832 pixels for the full Earth disk) combin-ing both VIS and IR images. It allows a monitoring of dust and clouds at the synoptic scale. Windows from avail-able quick-looks of 7 June and preceding days are shown in Fig. 2. VIS data were further sub-sampled (ISCCP-B2 format, 416×416) for MEDUSE real time estimate of the aerosol optical depth at 550 nm (AOD) over the Mediter-ranean and the north-eastern Atlantic (not shown), based on the look-up table inversion method extensively described in Moulin et al. (1997a, 1997b) and a VIS sensor calibra-tion following Moulin et al. (1996). The low resolucalibra-tion of such data (about 35 km×35 km) combined to the presence of clouds south of Greece results in the absence of optical depth values in the study area. Available spaceborne POLDER aerosol products (http://smsc.cnes.fr/POLDER/) correspond-ing to almost coincident observations (10:30 local time) were also tentatively considered, but the relatively low resolu-tion (18.5 km×18.5 km) also yields results in not enough pixels for being considered with confidence. Inversion of full resolution (about 6 km×6 km) Meteosat images allows a much better spatial coverage in AOD. Such Meteosat-derived values in the Mediterranean have been found to be accurate within about ±0.06 compared to sun-photometer-derived AODs (unpublished data; Dulac and Paronis, 1998). We analysed the full resolution image of 7 June in order to obtain values of AOD in the area flown.
We also processed low resolution IR images using a dif-ference algorithm allowing the detection of dust over Africa by the apparent cooling of the hot surfaces that it produces (Legrand et al., 2001). A warm reference image was com-puted from a series of 15 successive images taken at the same hour, and the difference between the given image and the reference image was made to detect anomalously cold areas.
1820 F. Dulac and P. Chazette: Airborne study of a multi-layer aerosol structure in the eastern Mediterranean
4
th
6
th
7
th
Fig. 2. Meteosat colour quick-look windows for June 4, 6
and 7 (June 5 image missing). Ocean pixels with clear sky
appear in dark blue. The concentration of aerosol over
Mediterranean seawater increases from light blue to
yellow, orange and red (areas dotted with colours
correspond to partly cloudy pixels). Land surfaces appear
in dark grey, and clouds in white or very light grey.
Fig. 2. Meteosat colour quick-look windows for 4, 6 and 7 June (5 June image missing). Ocean pixels with clear sky appear in dark blue.
The concentration of aerosol over Mediterranean seawater increases from light blue to yellow, orange and red (areas dotted with colours correspond to partly cloudy pixels). Land surfaces appear in dark grey, and clouds in white or very light grey.
The derived infrared cooling has been found well correlated to horizontal visibility in Africa (Legrand et al., 1994). In both VIS and IR channels, cloudy pixels are detected using thresholds on the local standard deviation.
2.3 Other data
We obtained meteorological information from the European Meteorological Bulletin (Deutscher Wetterdienst, 1997) in-cluding daily standard charts at 0 GMT (surface only) and 12 GMT, and daily aerological diagrams from rawindson-des launched from Athens operational meteorological sta-tion (12 GMT). We also used the TM2-Z atmospheric trans-port model in reverse mode to compute 3-D, 5-day back-trajectories based on the meteorological analysed winds from ECMWF, Reading, interpolated at the 2.5◦×2.5◦
resolu-tion of the model (Ramonet et al., 1996; Chazette et al., 2001). Model layers in the low troposphere are 0–0.4, 0.4– 1.2, 1.2–2.6, 2.6–4.7 and 4.7–7.3 km. We computed trajec-tories arriving in the lower troposphere south of Pelopon-nese (36◦N, 22.5◦E), at 0 and 12 GMT on 7 June. The trajectory model disperses, with reverse time and reverse winds, a tracer amount which is released at the end point of the trajectory (Ramonet et al., 1996). Every six hours, the trajectory point is computed as the centre of mass of the tracer plume. The standard deviation of the tracer concen-tration field was found of the order of 600 km after three days of transport (Chazette et al., 2001). Finally, the aerosol column optical depth was also monitored at the Univer-sity of Heraklion coastal atmospheric station at Finokalia in northeastern Crete (35.2◦N; 25.4◦E) with an automated
sun-tracking CIMEL Electronique photometer CE-318 (http: //www.cimel.fr/photo/sunph.htm) in the frame of MEDUSE (Paronis et al., 1998). We used measurements at 440 and 670 nm to derive the Angstr¨om spectral exponent and AOD at 550 nm for comparison with results derived from Me-teosat and the lidar. Triple measurements were taken in or-der to detect cloud contamination based on short term vari-ations in solar light transmission. Relative errors in optical depth and Angstr¨om exponent are discussed in Hamonou et al. (1999). They are generally of the order of a few percent for AOD>0.1.
3 Results and discussion
3.1 Meteorological situation and column aerosol optical depth
Meteosat quick-look images (Fig. 2) illustrate that a low-pressure system crossed the whole basin from west to east in a few days, which is a typical situation for dust export from Africa to southern Europe (Moulin et al., 1998). Few sun-photometer-derived AODs are available at Finokalia due to clouds from 4–7 June. We find that AOD at 550 nm was below 0.1 with an Angstr¨om exponent of 1 or more from
Fig. 3. Distribution of the aerosol optical depth at 550 nm
over clear seawater on June 7, 1997, 11:45 GMT, as derived from the full resolution noon Meteosat VIS image. Masked pixels (land, coastal waters or cloud contamination) are in white and approximate coastlines are drawn in black. Reported in red are the tracks of the airborne legs 1 and 2, which were performed more than three hours earlier than the Meteosat image.
Fig. 3. Distribution of the aerosol optical depth at 550 nm over clear
seawater on 7 June 1997, 11:45 GMT, as derived from the full res-olution noon Meteosat VIS image. Masked pixels (land, coastal waters or cloud contamination) are in white and approximate coast-lines are drawn in black. Reported in red are the tracks of the air-borne legs 1 and 2, which were performed more than three hours earlier than the Meteosat image.
4–6 June. A value of the order of 0.2 with an Angstr¨om ex-ponent of about 0.5 can be speculated on 7 June from very few points. The former situation is typical of background and the latter is typical of an African dust plume from Africa (Paronis et al., 1998). A rain with a high pH of about 6.7 occurred in Finokalia (N. Mihalopoulos, personal commu-nication), which is characteristic of a high desert dust con-tent (Lo¨ye-Pilot et al., 1986). Meteosat products confirm the presence of dust in the south of the eastern Mediterranean basin on 6 and 7 June. The turquoise colour off Libya on June-6 quick-look (Fig. 2) corresponds to AODs of about 0.4. Figure 3 displays AOD results from the full resolution Me-teosat image of 7 June. Values of more than 0.3 are found in the clear part of the basin off Egypt but a distinct aerosol plume oriented SW-NE is visible in the flight area, and was crossed by the track of legs 2–4. AOD values in the plume are of about 0.25 but the central part is masked. This is the sign of large local heterogeneities likely due to clouds.
Figure 4 shows the potential temperature (θp) and relative
humidity (RH ) profiles obtained south of the Peloponnesian peninsula with the aircraft. Temperature inversions and hu-midity maxima are found at about 1.3 and 2.3 km in altitude (Fig. 4a). It must be noted, however, that horizontal variabil-ity is large (Fig. 4b). During the flight at 4660 m from Athens (leg 1), relative humidity ranges between 66% and 55% in the
1822 F. Dulac and P. Chazette: Airborne study of a multi-layer aerosol structure in the eastern Mediterranean 0 500 1000 1500 2000 2500 3000 3500 4000 4500 5000 1 601 1201 1801 2401 3001 3601 4201 4801 5401 6001 6601 7201 7801 Time since 07:47:50 GMT (s) Fl ig ht a lt it u de ( m ) 0 10 20 30 40 50 60 70 80 90 100 R el ativ e h u m id ity (% ) 2 x P ot en ti al t em p er at u re ( °C ) Altitude (m) RH (%) 2 x θp (°C) leg 4 leg 3 leg 2 leg 1 (b) 20 30 40 50 60 70 80 90
Relative humidity (%) and potential temperature (°C, x 2)
RH (%) 2 x θp (°C) (a) 0 500 1000 1500 2000 2500 3000 3500 4000 4500 5000 1 601 1201 1801 2401 3001 3601 4201 4801 5401 6001 6601 7201 7801 Time since 07:47:50 GMT (s) Fl ig ht a lt it u de ( m ) 0 10 20 30 40 50 60 70 80 90 100 R el ativ e h u m id ity (% ) 2 x P ot en ti al t em p er at u re ( °C ) Altitude (m) RH (%) 2 x θp (°C) leg 4 leg 3 leg 2 leg 1 (b) 20 30 40 50 60 70 80 90
Relative humidity (%) and potential temperature (°C, x 2)
RH (%) 2 x θp (°C)
(a)
Fig. 4. Potential temperature (θ
p) and relative humidity (RH) measured during the flight in the early morning of
June 7, 1997: (a) profiles during the descents of the aircraft south of the Peloponnese from leg 2 to leg 3 and
from leg 3 to leg 4; note that there is a geographical discontinuity (about 200 km) between the beginning and the
end of leg 3 at the altitude of 2315 m (arrow); (b) chronological values together with the flight altitude during all
flight.
Fig. 4. Potential temperature (θp) and relative humidity (RH ) measured during the flight in the early morning of 7 June 1997: (a) profiles
during the descents of the aircraft south of the Peloponnese from leg 2 to leg 3 and from leg 3 to leg 4; note that there is a geographical discontinuity (about 200 km) between the beginning and the end of leg 3 at the altitude of 2315 m (arrow); (b) chronological values together with the flight altitude during all flight.
northernmost part and then decreases sharply down to values of 19.5% (minimum at 36.40◦N). Values between 30% and
45% are found during the rest of leg 1 and leg 2 at this alti-tude. During the descent to 2315 m, RH stays between 35% and 40% down to 3870 m and then slightly increases. Values of 50–55% are found down to 3020 m followed by a transi-tion to a dryer layer with a minimum of 33% at 2600 m. This dry layer is found between 21.9◦E and 22.8◦E during leg 3 at 2315 m (with RH values ranging between 30% and 42%) and at about the same longitude between 2180 and 1660 m during the descent (minimum of 25%). However, a relative maximum of 60% in RH is found in the westernmost part of leg 3 and another one at 90% in the easternmost part. Below 1550 m and during all leg 4 at 900 m, RH is relatively high with values between 63 and 81%. At take-off in Athens, RH is low (50–55%) at the surface and increases with height in the MBL.
Wind speed and direction during the flight are plotted in Fig. 5. Near Athens, northerly winds were found at the sur-face and up to the altitude of leg 1 with a shift in direction from NNE at the ground to NNW at high altitude. Wind speed increased from a few m s−1near the surface up to 12– 16 m s−1in altitude. During leg 1 wind intensified and reg-ularly shifted W when going south so that high WNW wind was encountered at 4660 m over western Crete. During leg 2 WNW wind remained high and shifted back to NW. During the quick descent to the altitude of leg 3, wind speed dropped to 5 m s−1. During leg 3 back towards Crete at 2315 m, the wind changed significantly. Direction varied from NW to WSW with a speed increase from 5 to 12 m s−1. During the slow descent down to the altitude of 900 m of leg 4, wind speed rapidly decreased below 5 m s-1 and direction shifted back to north. Between 1700 and 1500 m, a layer with a
con-stant NNW wind direction was crossed. Below 1300 m and during all leg 4 at 900 m the wind was relatively steady (NE, 4–6 m s−1).
3.2 Aerosol layers
In agreement with thermodynamical profiles, raw backscat-tering lidar data (Fig. 6) and depolarisation ratio (Fig. 7) show a complex vertical structure of aerosol layers with much horizontal variability. The upper air below the aircraft shows a very weak aerosol backscattering and a minimum depolarisation ratio close to the value of 0.018 for a molec-ular atmosphere. This is clearly the free troposphere and it extends down to very variable altitudes along legs 1 and 2, ranging between about 4 km over western Crete to less than 2 km a bit farther west (35.8◦N, 22.4◦E).
In the northernmost part of the study area (Fig. 6, right), the boundary layer seems relatively aerosol-free. It extends up to more than 2 km, in agreement with the single inver-sion observed a few hours later at about 2.9 km in altitude by the 12 GMT rawindsounding from Athens airport (37.88◦N) (not shown). Clouds were present at several altitudes be-low the aircraft in the eastern part of the study area, but es-sentially clear sky below the aircraft occurred west of 23◦E
(Figs. 6 and 7, left). In this area, the marine boundary layer (MBL) top varied between 200 and 400 m in altitude with discontinuities around 35.75◦N, 22.5◦E and at the extreme west (36.1◦N, 21.8–21.9◦E). Pixels masked at about 22.5◦E on the Meteosat-derived AOD image (Fig. 3) likely indicate clouds formed between the morning flight and the Meteosat scanning hour (13:45 local time) due to cloud condensation at the top of the humid layer following convection in these areas of discontinuities of the MBL top. Indeed, apart from
0 300 600 900 1200 1500 1800 2100 2400 2700 3000 3300 3600 3900 4200 4500 4800 1 60 1 12 01 18 01 24 01 30 01 36 01 42 01 48 01 54 01 60 01 66 01 72 01 78 01
Time since 7:47:50 GMT (s)
F lig h t a lti tu d e ( m ) 0 2 4 6 8 10 12 14 16 H o ri zo n ta l w ind s p ee d ( m s -1 ) Wi n d d ir ec ti o n Altitude Wind speed Wind direction N W S SW NW NE leg 1 leg 2 leg 3 leg 4Fig. 5. Horizontal wind speed, wind direction and altitude
during the flight.
Fig. 5. Horizontal wind speed, wind direction and altitude during the flight.
the cloudy areas near Crete at the end of leg 3, the layer sam-pled between 1500 and 900 m in altitude had the highest RH (Fig. 4).
Along leg 4 small fluctuations in RH (between 65% and 80%; Fig. 4) correspond to variations in depolarisation. Where RH was maximum (Fig. 4b), a relative minimum in depolarisation occurred with similar values to those in the MBL. The relatively lower backscattering and larger depo-larisation found between 22 and 23◦E, between leg 4 altitude of 900 m and the MBL top (Figs. 6 and 7, left) might be due to drier conditions.
In summary, the lidar data (Figs. 6 and 7) allow us to distinguish four main regions in agreement with thermody-namical data. The depolarisation ratio in the MBL is low, in the range 0.020–0.045. Between the free troposphere and down to about 1.2 km, the aerosol is depolarising with a max-imum depolarisation ratio (∼0.07–0.09) in the humid and turbid air mass near Crete. Intermediate values are found be-low between this layer and the MBL. The cleaner and non-depolarising air from the free troposphere extends down to about 3 to 4 km in altitude near western Crete but down to less than 2 km a bit more west at 22.4◦E. It turns out that potential temperature inversions found at 2.9, 2.3 and 1.3 km (Fig. 4a) correspond to transitions between aerosol contain-ing layers and the clean free troposphere air, which was tem-porarily encountered in the course of leg 3 and during the descent to leg 4: the first transition was crossed at about (36.25◦N; 21.25◦E) during the quick descent from leg 2 to leg 3, and the other two during the slow descent from leg 3 to leg 4 (Fig. 6, left). Combination of Figs. 4b and 6 left shows that the lowest RH of 30–40% during legs 1, 2 and even 3 were in fact measured in free troposphere air. Small
struc-tures between 1.5 and 3 km in altitude are apparent in Figs. 6 and 7, in particular in the central part of leg 3, and reveal mixing between the free troposphere and the depolarising air mass.
Results from the PMS probes are illustrated in Fig. 8. A few of the short term variations observed coincide with small changes in the angles of attack and sideslip of the aircraft during turns and descents, which indicates that PMS mea-surements appear sometimes affected by the aircraft attitude. This can be explained by a changing sampling efficiency of the probe as a function of particle size. The most striking instance is the minimum in small particle number at 4660 m which occurred during the turn at constant altitude between leg 1 and leg 2 (8.40–8.44 GMT): a decrease by about a fac-tor 2 in particle number was registered when the aircraft an-gle of attack only increased from 4.1 to 4.6 deg and the anan-gle of sideslip from 0.75 to 1 deg. It is nevertheless difficult to quantify such an influence and this would have needed ded-icated tests. Between 9:27 and 9:46 GMT, the small particle number varies only between 43 and 61 in the altitude range 1640–900 m relatively independently from significant varia-tions in aircraft angles (angle of attack varies from 6.1◦ to 4.9 deg during the descent and the beginning of leg 4). Typ-ically the angle of attack was 4.2±0.1 deg during legs 1 and 2, 5.2±0.05 deg during leg 3, and between 4.75 and 5 deg during leg 4. Because of such aircraft attitude variations ac-cording to the flight level, the observed evolution of particle concentrations as a function of altitude might be regarded cautiously. Keeping in mind those possible source of errors, the PMS probes show two orders of magnitude variations in both small (0.1–0.3 µm diameter) and large (2–10 µm) par-ticle number concentration between the surface near Athens
1824 F. Dulac and P. Chazette: Airborne study of a multi-layer aerosol structure in the eastern Mediterranean
Leg 2 Crete Leg 1 Athens
A ltitu de (k m ) L a titu d e (° N ) L atitude (°N )
Fig. 6. Geometrically corrected raw lidar data from legs 1 and 2. Location of in situ measurements in lower
layers below the track of leg 2 is reported (leg 3 in white, descent in grey and leg 4 in black).
Fig. 6. Geometrically corrected raw lidar data from legs 1 and 2. Location of in situ measurements in lower layers below the track of leg 2
is reported (leg 3 in white, descent in grey and leg 4 in black).
Leg 2 Crete Leg 1 Athens
LONGITUDE ALTI TU D E ( k m ) LONGITUDE
Lidar depolarisation ratio
LONGITUDE Crete
LONGITUDE Crete
Fig. 7. Lidar depolarisation ratio observed during legs 1 and 2.
Fig. 7. Lidar depolarisation ratio observed during legs 1 and 2.
and 4660 m. The concentration of small particles (N ) was 1300 cm−3 at 100 m in altitude at take-off. At 4660 m, N was in the range 15–50 cm−3during leg 1 with a tendency to decrease towards south. Low values (14–25 cm−3) were also found near Crete during the first half of leg 2. N increased by a factor 2 between 23.1 and 23.3◦E (8:36–8:47 GMT), accompanied by a small increase in the proportion of large particles, which remained relatively constant during the rest of the flight. At 2315 m (leg 3), N ranged between 80 and 250 cm−3with a sharp minimum at 42 cm−3at 22.8◦E in a cell of clean free troposphere air encountered just before en-tering the depolarising and backscaten-tering air-mass (Figs. 6 and 7, left). The largest values (>175 cm−3) during leg 3 were found in its westernmost part, in air containing
depo-larising aerosol. The small-scale variations found in the rest of the leg seem due to the dilution of the depolarising layer by the free troposphere already mentioned. At 900 m (leg 4), N ranges between about 400 and 750 cm−3. The minimum at the end of leg 4 coincides with a small change in the hor-izontal wind direction, and maxima correspond to minima in depolarisation. The ratio between fine and large particles (Fig. 8) increases with altitude: it is the lowest near Athens and highest values are found during the high altitude legs 1 and 2; the low altitude leg 4 at 900 m shows intermediate val-ues and a transition between both levels is observed during leg 3 at 2315 m. The similarity between the ratio of fine to large particles between the end of leg 3 and leg 4 (Fig. 8) together with the fact that both air masses show high RH
10 100 1000 10000 7,8 8,0 8,2 8,4 8,6 8,8 9,0 9,2 9,4 9,6 9,8 10,0 Hour GMT
Fine particle concentration (cm-3)
Ratio of fine/large particles
0 500 1000 1500 2000 2500 3000 3500 4000 4500 5000 Altitude (m) Mean N Ratio fine/large Altitude
leg 1 leg 2 leg 3 leg 4
8:00 8:12 8:24 8:36 8:48
7:48 9:00 9:12 9:24 9:36 9:48 10:00
Fig. 8. Concentration of fine particles (0.1-0.3 µm in diameter) and ratio between fine and large (2-10 µm)
particles (right axis; note that the scale is inverted), and flight altitude (left axis) along the flight.
Fig. 8. Concentration of fine particles (0.1–0.3 µm in diameter) and ratio between fine and large (2–10 µm) particles (right axis; note that
the scale is inverted), and flight altitude (left axis) along the flight.
(Fig. 4b) suggest that turbid air encountered at the end of leg 3 was advected from below by convection.
Figure 9 presents some examples of small particle size dis-tributions obtained at different instants during the flight. It illustrates that the short term variability in size distribution increases when the concentration decreases, likely due to an increase in the relative uncertainty. Noteworthy, the size dis-tributions taken in the depolarising air during leg 3 seem to have a distinct flat shape between 0.1 and 0.3 µm, whereas other distributions show a steep decrease in particle number with increasing size in this range.
3.3 Aerosol sources and transport
All computed back-trajectories arrive south of Greece from the north-west by the Ionian Sea and coastal Greece, as il-lustrated in Fig. 10. This is consistent with the airborne measurements of the wind direction (NW; Fig. 5) for the upper trajectories. NE winds observed between 1300 and 900 m are not well represented by the intermediate trajec-tory. It is likely that average transport between 400 and 1200 m at the 2.5◦scale of the model was dominated by NW
winds since the rawindsounding from Athens confirms that wind direction shifted to NW below 900 m. In the MBL, the trajectories arriving at 0 and 12 GMT are short and es-sentially marine or coastal. We conclude that low polarisa-tion values, corresponding to spherical particles, at low alti-tude (Fig. 7) are due to sea salts and water-soluble secondary aerosols which adsorb water vapour and generally dominate in the MBL. The trajectory finishing at 1900 m originates from South Tunisia on 2 and 3 June. Infrared Meteosat data
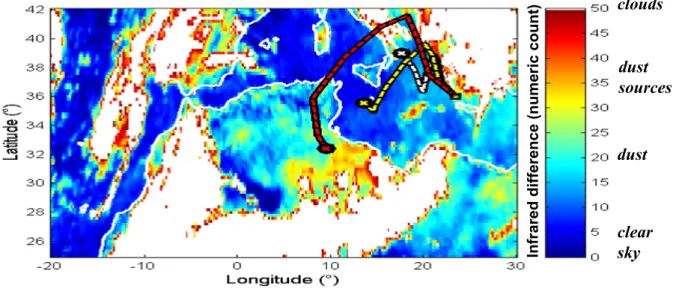
confirm high dust concentration over South Tunisia and west-ern Libya on 2 and 3 June (Fig. 10), a region known to be a desert dust source for the Mediterranean atmosphere at that season (Moulin et al., 1998). High depolarisation can there-fore definitely be attributed to the presence of non spherical mineral dust from north Africa. It is striking that depolari-sation is the highest in the elevated layer of dust near Crete (Fig. 7) despite its high relative humidity (Fig. 4) yielding some clouds (Fig. 6). Trajectories finishing in the two up-per layers (2.6–4.7 km and 4.7–7.3 km; not shown) were also over a known dust source region in northern Algeria (West-ern Grand Erg) on 2 June, at only about 2 km in altitude. But infrared images show that no dust emission occurred in this area, which explains the low aerosol content above 3 km in altitude.
The trajectory finishing at 0.8 km in altitude (humid and turbid layer) follows approximately the same way than the trajectory at 1.9 km, but it is shorter and the air mass was al-ready off Tunisia over the central Mediterranean when dust was raised. It spent its last two days over the eastern coast of Greece where it had the opportunity to encounter conti-nental sources of water soluble particles. Intermediate depo-larisation (Fig. 7, left) in this humid layer is consistent with a mixing of dust particles and water-soluble particles. We conclude that this intermediate layer contains a mixture of dust particles and marine polluted particles. Horizontal and vertical variability visible in Figs. 6, left, and 7, left, proba-bly result from changes in the respective influence of the two types of particles.
1826 F. Dulac and P. Chazette: Airborne study of a multi-layer aerosol structure in the eastern Mediterranean 1 10 100 1000 10000 Particle diameter (µm) dN/dLnD (cm -3 ) 100 m (7.864 GMT) 100 m (7.864 GMT) 100 m (7.864 GMT) 900 m (9.9 GMT) 900 m (9.9 GMT) 2300 m (8.9 GMT) 2300 m (8.9 GMT) 2300 m (9.25 GMT) 2300 m (9.25 GMT) 4600 m (8.1 GMT) 4600 m (8.1 GMT) 4600 m (8.7 GMT) 4600 m (8.7 GMT) 100 m 4600 m 2300 m 900 m 0.1 0.2 0.3 0.4 0.5 0.6
Fig. 9. Examples of particle size distributions measured in situ at different altitudes with the PCASP (1 Hz data).
Size ranges of the different counting channels are 0.10-0.12, 0.12-0.14, 0.14-0.17, 0.17-0.20, 0.20-0.25, 0.25-0.30, 0.30-0.40, 0.40-0.50, and 0.50-0.70 µm.
Fig. 9. Examples of particle size distributions measured in situ at different altitudes with the PCASP (1 Hz data). Size ranges of the different
counting channels are 0.10–0.12, 0.12–0.14, 0.14–0.17, 0.17–0.20, 0.20–0.25, 0.25–0.30, 0.30–0.40, 0.40–0.50, and 0.50–0.70 µm.
3.4 Aerosol extinction profiles
Retrieval of the aerosol extinction profile from the backscat-tering lidar measurements requires the knowledge of the ra-tio (so called BER) between aerosol backscatter and extinc-tion coefficients (Klett, 1983; Fernald, 1984). This ratio de-pends on the aerosol-type (i.e. size distribution and refrac-tive index) and can consequently vary with height. Relarefrac-tively large errors in the extinction profile may result from assum-ing a vertically constant value (e.g. Sasano et al., 1985). In the absence of direct information on the BER profile, a columnar average BER value may be adjusted when an in-dependent measure of the aerosol optical depth is available so that the vertical integral of the lidar-derived aerosol ex-tinction coefficient matches this optical depth (Welton et al., 2000; Stephens et al., 2001; Chazette, 2003). We constrained the columnar BER value by comparing the vertically inte-grated lidar-derived extinction (τ0.532) with the independent Meteosat-derived aerosol optical depth data (τ0.55; Fig. 3). Given respective uncertainties in aerosol optical depth re-trievals, the difference in wavelengths is small enough to be neglected. Uncertainties in the determination of the aerosol extinction coefficient have three main causes: the statistical fluctuations of the measured signal, the uncertainty in BER, and the uncertainty resulting from the chosen reference al-titude. The lidar signal uncertainty followed a Poisson law that is a function of the number of photons backscattered to the telescope. Here our signal to noise ratio is higher than 10 and this error sources is negligible compared to the others. The reference altitude is taken in the free troposphere where
no aerosol is present (the decrease of the backscattered sig-nal as a function of altitude closely follows a Rayleigh atmo-sphere) and the residual relative error on the extinction coef-ficient due to the use of a climatologic value of the molec-ular scattering is less than 5%. The major source of error is linked to the choice of the BER, assumed constant with height (Marenco et al., 1997).
The scanning by Meteosat was performed at about 11:45 GMT so that there is a lag of 3 to 4 hours between lidar and Meteosat measurements. With winds of 5 m s−1or more (Fig. 5), this is a long enough time lag to prevent an exact matching of both results, but short enough to consider that the ranges of τ from the lidar and from Meteosat should be similar. Meteosat-derived aerosol optical depth sections along the tracks of lidar measurements (first two legs) are plotted in Fig. 11 (top). Discrete variations in τ0.55from one pixel to the next reflect the limited digitisation of the Me-teosat signal, which yields by itself an uncertainty of ±0.03 on τ0.55. Values between 0.15 and 0.26 are found along leg 1 track with a possibly cloud-contaminated maximum of 0.36 for a pixel adjacent to the central cloud band. Along the track of leg 2, values range between 0.18 and 0.36. Clouds seen by Meteosat (Fig. 3) were not yet present during the air-borne flight in the early morning. The best agreement with the lidar was obtained by considering a BER of 0.017 sr−1 (Fig. 11, centre). Following a Monte Carlo approach as in Chazette (2003), we estimate that the relative uncertainty on τ0.55from Meteosat yields an uncertainty of ±0.005 sr−1on the BER. The resulting relative uncertainty on the extinction coefficient is ∼35%. The evolution of the vertical profile
In fr ar ed d if fe re n ce (n u m er ic co u n t)
clouds
clear
sky
dust
dust
sources
Fig. 10. Meteosat infrared difference image of June 3, 12:00 GMT, and 4-days air mass trajectories arriving at
(36°N, 23.5°E) in the flight area on June 7, 12:00 GMT (white: layer 0-0.4 km; yellow: 0.4-1.2 km; red: 1.2-2.6 km).
Fig. 10. Meteosat infrared difference image of 3 June 12:00 GMT, and 4-days air mass trajectories arriving at (36◦N, 23.5◦E) in the flight
area on 7 June 12:00 GMT (white: layer 0–0.4 km; yellow: 0.4–1.2 km; red: 1.2–2.6 km).
of aerosol extinction along the lidar legs is also plotted in Fig. 11 (bottom). Results indicate that the extinction coef-ficient in the dust layer is relatively low (<0.1 km−1) com-pared to the intermediate layer and the boundary layer. Val-ues up to more than 0.25 km−1are found in the MBL.
It may be questioned whether the columnar BER value of 0.017 sr−1is applicable to the various aerosol layers encoun-tered since the errors propagate down in altitude in the pro-file inversion process. Relatively larger values are found in the literature for African dust plumes: Chazette et al. (2001) compute a value of 0.035 sr−1 from Mie calculations in the Azores region; Powell et al. (2000) and Welton et al (2000) derive a BER of 0.029±0.004 and 0.027±0.007 sr−1, respectively. But L´eon et al. (2003) derive lower values of 0.018 and 0.024 sr−1in elevated dust layers during a Saharan outbreak off west Africa. More recently, Mattis et al. (2002) used the Raman lidar technique to measure the BER value of elevated dust layers during two episodes over Germany. Indeed, the additional detection of Raman backscatter by N2 molecules provide a mean to measure separately backscatter and extinction profiles (Ansmann et al., 1992). They report BER values between 0.013 and 0.025 sr−1. Liu et al. (2002) and Murayama (2002) also report layer averaged BER in ranges 0.018–0.024 and 0.022–0.025 sr−1, respectively, for Asian dust over Japan. Radiative model calculation indicate that lower values than expected from Mie computations for dust particles can in fact be attributed to non-sphericity ef-fects (Liu et al., 2002; Mattis et al., 2002). For instance Ack-ermann (1996) computes BER values of 0.040–0.050 sr−1 based on the Mie theory but Barnaba and Gobbi (2001) com-pute smaller values of 0.020–0.028 sr−1at 500 nm for non-spherical dust aerosols. Finally, De Tomasi et al. (2003) re-cently reported Raman lidar observations (351–382 nm) of
elevated Saharan dust layers over southern Italy for two dust episodes in May 2001. They find average BER values in the UV of 0.018–0.020 sr−1and a range of 0.013–0.025 sr−1. Our value appears therefore realistic for the dust layer.
Regarding the lowermost troposphere, we are not aware of BER estimates for the eastern Mediterranean. Values reported for maritime aerosol are large (0.030–0.070 sr−1; Ackerman, 1998; Doherty et al., 1999; Franke et al., 2001) but the eastern Mediterranean lower troposphere is known to be severely impacted by continental pollution (e.g. Mi-halopoulos et al., 1997). Anderson et al. (2000) report BER values for polluted aerosols in Illinois down to 0.014 sr−1and Chazette et al. (2002) report larger value of 0.018 sr−1 for Paris urban area. In the Maldives Islands, southwest of India, aerosols of the lowermost 1000 m of the tropospheric column also show small BER values during winter monsoon. Val-ues down to 0.010 sr−1were measured under the influence of Asian pollution (in particular due to soot carbon) during the February–March 1999 INDOEX intensive field phase with averages of 0.020±0.008 sr−1(Franke et al., 2001). On the southwestern coast of India (Goa), Chazette (2003) also re-ports an average value of 0.028±0.01 sr−1in February 1999. Comparable particulate soot carbon concentrations are found in the eastern Mediterranean (Sciare et al., 2002) and the north tropical Indian Ocean (Cantrell et al., 2000) due to con-tinental influence and our value finally appears also quite re-alistic for the polluted MBL aerosol. However, we cannot exclude that the BER was actually not constant in the col-umn.
In Fig. 12 are plotted the local vertical profiles of aerosol extinction coefficient and lidar depolarisation obtained dur-ing leg 2 west of Crete at about 35.6◦N, 22.9◦E, where po-larizing dust particles are found up to about 3 km (Fig. 7,
1828 F. Dulac and P. Chazette: Airborne study of a multi-layer aerosol structure in the eastern Mediterranean Leg 2 Leg 1 τ a t 550 nm τ a t 550 n m
Fig. 11. Aerosol extinction vertical profile and aerosol optical depth along leg 2 (left side) and leg 1 (right side).
Top: Meteosat-derived aerosol optical depth; centre: lidar-derived aerosol optical depth; bottom: lidar-derived aerosol extinction profiles. The vertical line on the left refers to Fig. 12.
Fig. 11. Aerosol extinction vertical profile and aerosol optical depth along leg 2 (left side) and leg 1 (right side). Top: Meteosat-derived
aerosol optical depth; centre: lidar-derived aerosol optical depth; bottom: lidar-derived aerosol extinction profiles. The vertical line on the left refers to Fig. 12.
left). The four aerosol layers are clearly identified. The inte-grated optical depth is ∼0.24 in good agreement with values derived from Meteosat (and the sun-photometer in Crete). About a third of this optical depth is due to the dust layer (1.2–3 km). The optical thickness is about 0.1 in the polluted MBL (0–0.4 km) and 0.06 in the intermediate layer (0.4– 1.2 km) containing pollution and dust particles. A bit farther east (∼23.25◦E), extinction in the dust layer dominates the optical depth.
4 Conclusions
We have presented a detailed case study of the vertical struc-ture of the low troposphere and associated aerosols observed in the eastern Mediterranean in June 1997. The study com-bines data from an airborne payload composed of a backscat-tering lidar with polarization measurements, in situ particle counters/sizers, and standard meteorological measurements, together with Meteosat visible and infrared images, sun-photometer measurements, air-mass back-trajectories and meteorological charts. An original closure of the lidar inver-sion by satellite-derived aerosol optical depth was presented. Below the clean free troposphere, three main layers of geographically variable thickness were superimposed which
contained distinct aerosols. The lowermost marine bound-ary layer appeared polluted by water-soluble aerosols likely from eastern Greece. We identified the presence of depolariz-ing dust particles from the region of south Tunisia and west-ern Libya in an elevated layer found between about 1.2 km and up to less than 2 to almost 4 km. Clouds were strikingly present in this dust layer, in regions of maximum extinction. Despite the very high relative humidity, maximum depolar-ization was observed in the vicinity of clouds, likely due to multiple scattering. The intermediate layer likely con-tained a mixture of the two types of aerosols. We could ad-just the column average aerosol backscattering to extinction ratio for the lidar signal inversion by using the Meteosat-derived aerosol optical thickness as a constraint. The fit-ted value of 0.017 sr−1 was found realistic for aerosol par-ticles in the different layers from the MBL to the free tro-posphere. This allowed us to derive the aerosol extinction vertical profile, which revealed that dust particles are respon-sible for up to more than half of the total aerosol optical depth which ranged between 0.15 and 0.35. This study illustrates the complex horizontal and vertical structure of aerosols in the lower troposphere and its variability at the regional scale, even in a marine environment. It stresses both the need for aerosol optical depth measurements from passive sensors in
Fig. 12. Example of the vertical profiles of aerosol
extinction coefficient and of lidar depolarisation showing
the different aerosol layers west of Crete. Location of the
profiles is marked on Fig. 12e. The “Mixed layer”
characterizes the transition region where different aerosol
types are mixed.
Fig. 12. Example of the vertical profiles of aerosol extinction
co-efficient and of lidar depolarisation showing the different aerosol layers west of Crete. Location of the profiles is marked on Fig. 11. The “Mixed layer” characterizes the transition region where differ-ent aerosol types are mixed.
coincidence with the forthcoming spaceborne backscatter-ing lidar measurements (http://virl.gsfc.nasa.gov/glas/index. html; http://www-calipso.larc.nasa.gov) for data inversion, and the great interest of coincident lidar depolarisation mea-surements to interpret the data in terms of aerosol types. However, surface-based lidars with Raman backscattering capabilities and/or multi-angular lidar measurements will likely remain most helpful for constraining aerosol extinc-tion profiles from space lidars.
Acknowledgements. M. Krautstrunk, F. R¨osler, H. Finkenzeller,
H. Brockstieger, A. Giez, D. Zander, M. Wirth, V. Weiß, and others from the DLR flight operation team as well as F. Albers and U. Maixner from GKSS are gratefully acknowledged for their role in the acquisition and pre-processing of airborne data. The STAAARTE campaign was funded by the EU/DGXII programme Training and Mobility of Researchers. The planning of the flight during the campaign was greatly facilitated by J. K. D. S¨oderman who provided 3D model predictions of dust transport, and by X. Schneider and M. Legrand who performed real-time analyses of Meteosat visible and infrared images, respectively. MEDUSE was funded by the EU/DGXII programme Environment and Climate (contract No. ENV4-CT95-0036). An anonymous reviewer is ac-knowledged for providing additional relevant references on lidar ob-servations. This is LSCE contribution No. 1026.
References
Ackermann, J.: The extinction-to-backscattering ratio of tropo-spheric aerosol: A numerical study, J. Atmos. Oceanic Technol., 15, 1043–1050, 1998.
Anderson, T. L., Masonis, S. J., Covert, D. S., Charlson, R. J., and Rood, M. J.: In situ measurements of aerosol extinction-to-backscatter ratio at a polluted continental site, J. Geophys. Res., 105, 26 907–26 915, 2000.
Ansmann, A., Wandinger, U., Riebesell, M., Weitkamp, C., and Michaelis, W.: Independent measurement of extinction and backscatter profiles in cirrus clouds by using a combined Raman elastic-backscatter lidar, Appl. Opt., 31, 7113–7131, 1992. Barnaba, F. and Gobbi, G. P.: Lidar estimation of tropospheric
aerosol extinction, surface area and volume: Maritime and desert-dust cases, J. Geophys. Res., 106, 3005–3018, 2001. Bergametti, G., Gomes, L., Remoudaki, E., Desbois, M., Martin,
D., and Buat-M´enard, P.: Present transport and deposition pat-terns of African dusts to the north-western Mediterranean, in: Paleoclimatology and Paleometeorology: Modern and Past Pat-terns of Global Atmospheric Transport., edited by Leinen, M. and Sarnthein, M., Kluwer, Dordrecht, 227–251, 1989.
Bergametti, G., Remoudaki, E., Losno, R., Steiner, E., Chatenet, B., and BuM´enard, P.: Source, transport and deposition of at-mospheric phosphorus over the northwestern Mediterranean, J. Atmos. Chem., 14, 501–513, 1992.
Cantrell, W., Shaw, G., Leck, C., Granat, L., and Cachier, H.: Rela-tionships between cloud condensation nuclei spectra and aerosol particles on a south-north transect of the Indian Ocean., J. Geo-phys. Res., 105, 15 313–15 320, 2000.
Chazette, P., David, C., Lefr`ere, J., Godin, S., Pelon, J., and M´egie, G.: Comparative lidar study of the optical, geometrical, and dy-namical properties of stratospheric post-volcanic aerosols, fol-lowing the eruptions of El Chichon and Mount Pinatubo, J. Geo-phys. Res., 100, 23 195–23 207, 1995.
Chazette, P., Pelon, J., Moulin, C., Dulac, F., Carrasco, I., Guelle, W., Bousquet, P., and Flamant, P.-H.: Lidar and satellite retrieval of dust aerosols over the Azores during SOFIA/ASTEX, Atmos. Environ., 35, 4297–4304, 2001.
Chazette, P., Randriamiarisoa, H., Sanak, J., Flamant, C., and Pelon, J.: Airborne lidar for the survey of the Paris aerosol production in the frame of ESQUIF program, In Lidar Remote Sensing in Atmospheric and Earth Sciences, edited by Bissonnette, L. R., Roy, G., and Vall´ee, G., Defence R&D Canada Valcartier, Val-B´elair, Canada, Vol. 1, 173–175, 2002.
Chazette, P.: The monsoon aerosol extinction properties at Goa dur-ing INDOEX as measured with lidar, J. Geophys. Res., 108, doi 10.1029/2002JD002074, 2003.
De Tomasi, F., Blanco, A., and Perrone, M. R.: Raman lidar moni-toring of extinction and backscattering of African dust layers and dust characterization, Appl. Opt., 42, 1699–1709, 2003. Deutscher Wetterdienst: European Meteorological Bulletin,
Deutscher Wetterdienst, Offenbach, Germany, daily publication, June 1997.
Doherty, S. J., Anderson, T. L., and Charlson, R. J.: Measurement of the lidar ratio for atmospheric aerosols with a 180◦backscatter nephelometer, Appl. Opt., 38, 1823–1832, 1999.
Dulac, F., Tanr´e, D., Bergametti, G., Buat-M´enard, P., Desbois, M., and Sutton, D.: Assessment of the African airborne dust mass over the western Mediterranean Sea using Meteosat data, J.
Geo-1830 F. Dulac and P. Chazette: Airborne study of a multi-layer aerosol structure in the eastern Mediterranean
phys. Res., 97, 2489–2506, 1992.
Dulac, F., Hamonou, E., Schneider, X., Moulin, C., Chazette, P., Liberti, G. L., Paronis, D., Lambert, C. E., Legrand, M., De-fossez, J. B., Balis, D., Papayannis, A., Ancellet, G., and Mi-halopoulos, N.: Meteosat and ground-based optical measure-ments of desert dust within European project MEDUSE, Pro-ceeding of the 1997 EUMETSAT Meteorological Satellite Data Users’ Conference, Publication EUM P21, EUMETSAT, Darm-stadt, 549–556, 1997.
Dulac, F. and Paronis, D.: Quantitative remote sensing of aerosols in the Mediterranean region, Contract UE DGXII ENV-CT96-5057 final report, Dec. 1998.
Fernald, F.G.: Analysis of atmospheric lidar observations: some comments, Appl. Opt., 23, 652–653, 1984.
Formenti, P., Andreae, M. O., Andreae, T. W., Galani, E., Vasaras, A., Zerefos, C., Amiridis, V., Orlovsky, L., Karnieli, A., Wendisch, M., Wex, H., Holben, B. N., Maenhaut, W., and Lelieveld, J.: Aerosol optical properties and large scale trans-port of air masses: Observations at a coastal and a semiarid site in the eastern Mediterranean during summer 1998, J. Geophys. Res., 106, 9807–9826, 2001.
Franke, K., Ansmann, A., M¨uller, D., Althausen, D., Wagner, F., and Scheele, R.: One-year observations of particle lidar ratio over the tropical Indian Ocean with Raman lidar, Geophys. Res. Lett., 28, 4559–4562, 2001.
Gobbi, G. P., Barnaba, F., Giorgi, R., and Santacasa, A.: Altitude-resolved properties of a Saharan dust event over the Mediter-ranean, Atmos. Environ., 34, 5119–5127, 2000.
Godin, S., Carswell, A., Donovan, D., Claude, H., Steinbrecht, W., McDermid, S., McGee, T., Gross, M. R., Nakane, H., Swart, D. P. J., Bergwerff, J. B., Uchino, O., Von Der Gathen, P., and Neuber, R.: Differential absorption lidar ozone algorithm inter-comparison, Appl. Opt., 38, 6225–6236, 1999.
Guerzoni, S., Chester, R., Dulac, F., Herut, B., Loye-Pilot, M. D., Measures, C., Migon, C., Molinaroli, E., Moulin, C., Rossini, P., Saydam, C., Soudine, A., and Ziveri, P.: The role of atmo-spheric deposition in the biogeochemistry of the Mediterranean Sea, Progr. Oceanog., 44, 147–190, 1999.
Hamonou, E., Chazette, P., Balis, D., Dulac, F., Schneider, X., Galani, E., Ancellet, G., and Papayannis, A.: Characterization of the vertical structure of Saharan dust export to the Mediterranean basin, J. Geophys. Res., 104, 22 257–22 270, 1999.
Iwasaka, Y., Yamato, M., Imasu, R., and Ono, A.: Transport of Asian dust (KOSA) particles; importance of weak KOSA events on the geochemical cycle of soil particles, Tellus, 40B, 494–503, 1988.
Karyampudi, V. M., Palm, S. P., Reagen, J. A., Fang, H., Grant, W. B., Hoff, R. M., Moulin, C., Pierce, H. F., Torres, O., Browell, E. V., and Melfi, S. H.: Validation of the Saharan dust plume conceptual model using lidar, Meteosat, and ECMWF data, Bull. Am. Meteor. Soc., 80, 1045–1075, 1999.
Klett, J. D.: Lidar calibration and extinction coefficients, Appl. Opt., 22, 514–515, 1983.
Kubilay, N. and Saydam, A. C.: Trace elements in atmospheric particulates over the Eastern Mediterranean; concentrations, sources, and temporal variability, Atmos. Environ., 29, 2289– 2300, 1995.
Legrand, M., N’doum´e, C., and Jankowiak, I.: Satellite-derived cli-matology of the Saharan aerosol. Passive Infrared Remote
Sens-ing of Clouds and the Atmosphere II, edited by Lynch, D. K., SPIE, 127–135, 1994.
Legrand, M., Plana-Fattori, A., and N’Doum´e, C.: Satellite detec-tion of dust using the IR imagery of Meteosat, 1. Infrared differ-ence dust index, J. Geophys. Res., 106, 18 251–18 274, 2001. L´eon, J.-F., Tanr´e, D., Pelon, J., Kaufman, Y. J., Haywood, J. M.,
and Chatenet, B.: Profiling of a Saharan dust outbreak based on a synergy between active and passive remote sensing, J. Geophys. Res., 108, doi 10.1029/2002JD002774, 2003.
Liu, Z., Sugimoto, N., and Murayama, T.: Extinction-to-backscatter ratio of Asian dust observed with high-spectral- resolution lidar and Raman lidar, Appl. Opt., 41, 2760–2767, 2002.
Lo¨ye-Pilot, M.-D., Martin, J.-M., and Morelli, J.: Influence of Saha-ran dust on the rain acidity and atmospheric input to the Mediter-ranean, Nature, 321, 427–428, 1986.
Marenco, F., Santacesaria, V., Bais, A. F., Balis, D., di Sarra, A., Pa-payannis, A., and Zerefos, C.: Optical properties of tropospheric aerosols determined by lidar and spectrophotometric measure-ments (Photochemical Activity and Solar Ultraviolet Radiation campaign). Appl. Opt., 36, 6875–6886, 1997.
Mattis, I., Ansmann, A., M¨uller, D., Wandinger, U., and Althausen, D.: Dual-wavelength Raman lidar observations of the extinction-to-backscatter ratio of Saharan dust, Geophys. Res. Lett., 29, doi 10.129/2002GL014721, 2002.
Mihalopoulos, N., Stephanou, E., Kanakidou, M., Pilitsidis, S., and Bousquet, P.: Tropospheric aerosol ionic composition in the Eastern Mediterranean region, Tellus, 49B, 314–326, 1997. Moulin, C., Lambert, C. E., Poitou, J., and Dulac, F.: Long-term
(1983–1994) calibration of the Meteosat solar (VIS) channel us-ing desert and ocean targets, Int. J. Remote Sens., 17, 1183– 1200, 1996.
Moulin, C., Guillard, F., Dulac, F., and Lambert, C. E.: Long-term daily monitoring of Saharan dust load over ocean using ISCCP-B2 data, 1. Methodology and preliminary results for 1983–1994 in the Mediterranean, J. Geophys. Res., 102, 16 947–16 958, 1997a.
Moulin, C., Dulac, F., Lambert, C. E., Chazette, P., Jankowiak, I., Chatenet, B., and Lavenu, F.: Long-term daily monitoring of Sa-haran dust load over ocean using ISCCP-B2 data, 2. Accuracy of the method and validation using Sun photometer measurements, J. Geophys. Res., 16 959–16 969, 1997b.
Moulin, C., Lambert, C. E., Dayan, U., Masson, V., Ramonet, M., Bousquet, P., Legrand, M., Balkanski, Y. J., Guelle, W., Mar-ticorena, B., Bergametti, G., and Dulac, F.: Satellite climatol-ogy of African dust transport in the Mediterranean atmosphere, J. Geophys. Res., 103, 13 137–13 144, 1998.
Murayama, T.: Optical properties of Asian dust aerosol lofted over Tokyo observed by Raman lidar, in: Lidar Remote Sensing in Atmospheric and Earth Sciences, edited by Bissonnette, L. R., Roy, G., and Vall´ee, G., Defence R&D Canada, Val-B´elair, Vol. 1, 331–334, 2002.
Nickovic, S. and Dobricic, S.: A model for long-range transport of desert dust, Mon. Weather Rev., 124, 2537–2544, 1996. Papayannis, A., Boselli, A., Calpini, B., et al.: Simultaneous
ob-servations of free tropospheric Saharan dust layers over Europe monitored by a co-ordinated ground-based lidar network in the frame of the EARLINET project, J. Aerosol. Sci., 32, S389– S390, 2001.
Paronis, D., Dulac, F., Chazette, P., Hamonou, E., and Liberti, G.
L.: Aerosol optical thickness monitoring in the Mediterranean, J. Aerosol Sci., 29, S671–S672, 1998.
Powell, D. M., Reagan, J. A., Rubio, M. A., Erxleben, W. H., and Spinhirne, J. D.: ACE-2 multiple angle micro-pulse lidar obser-vations from Las Galletas, Tenerife, Canary Islands, Tellus, 52B, 652–661, 2000.
Ramonet, M., Roulley, J.-C., Bousquet, P., and Monfray, P.: Radon-222 measurements during the TROPOZ II campaign and compar-ison with a global atmospheric transport model, J. Atmos. Chem., 23, 107–136, 1996.
Renger, W., Kiemle, C., Schreiber, H. G., Wirth, M., and M¨orl, P.: Correlative measurements in support of LITE using the airborne backscatter lidar ALEX, in: Advances in Atmospheric Remote Sensing with Lidar, edited by Ansmann, A,. Neuber, R., Rairoux, P.,and Wandinger, U., Springer-Verlag, Berlin, 165–168, 1997. Sasano, Y., Browell, E. V., and Ismail, S.: Error caused by using
a constant extinction/backscattering ratio in the lidar solution., Appl. Opt., 24, 3929–3932, 1985.
Sciare, J., Bardouki, H., Moulin, C., and Mihalopoulos, N.: Aerosol sources and their contribution to the chemical composition of aerosols in the Eastern Mediterranean Sea during summertime, Atmos. Chem. Phys. Discuss., 2, 1287–1315, 2002.
Sicard, M., Chazette, P., Pelon, J., Won, J. G., and Yoon, S.-C.: Variational method for the retrieval of the optical thickness and the backscatter coefficient from multiangle lidar profiles, Appl. Opt., 41, 493–502, 2002
S¨oderman, J. K. D. and Dulac, F.: Monitoring and prediction of the atmospheric transport and deposition of desert dust in the Mediterranean region, Proceeding of the First LAS/WMO Inter-national Symposium on Sand and Dust Storms, Damascus, Syr-ian Arab Republic, Report TD864, World Meteorological Orga-nization, Geneva, 181–186, 1998.
Stephens, G. L., Engelen, R. J., Vaughan, M., and Anderson, T. L.: Toward retrieving properties of the tenuous atmosphere using space-based lidar measurements, J. Geophys. Res., 106, 28 143– 28 157, 2001.
Wandinger, U. and Ansmann, A.: Experimental determination of the lidar overlap profile with Raman lidar, Appl. Opt., 41, 511– 514, 2002.
Welton, E. J., Voss, K. J., Gordon, H. R., Maring, H., Smirnov, A., Holben, B. N., Schmid, B., Livingston, J. M., Russell, P. B., Durkee, P. A., Formenti, P., and Andreae, M. O.: Ground-based lidar measurements of aerosols during ACE-2: lidar description, results, and comparisons with other ground-based and airborne measurements, Tellus 52B, 636–665, 2000.
Young, S. A.: Analysis of lidar backscatter profiles in optically thin clouds, Appl. Opt., 32, 7019–7030, 1980.