HAL Id: halshs-00389916
https://halshs.archives-ouvertes.fr/halshs-00389916
Preprint submitted on 30 May 2009
HAL is a multi-disciplinary open access archive for the deposit and dissemination of sci-entific research documents, whether they are pub-lished or not. The documents may come from teaching and research institutions in France or abroad, or from public or private research centers.
L’archive ouverte pluridisciplinaire HAL, est destinée au dépôt et à la diffusion de documents scientifiques de niveau recherche, publiés ou non, émanant des établissements d’enseignement et de recherche français ou étrangers, des laboratoires publics ou privés.
The EU ETS: CO2 prices drivers during the learning
experience (2005-2007)
Emilie Alberola, Julien Chevallier, Benoît Chèze
To cite this version:
Emilie Alberola, Julien Chevallier, Benoît Chèze. The EU ETS: CO2 prices drivers during the learning experience (2005-2007). 2009. �halshs-00389916�
The EU ETS: CO
2prices drivers
during the learning experience (2005-2007)
Emilie Alberola1, Julien Chevallier2 and Benoît Chèze3
Abstract:
This chapter identifies the main price drivers of European Union Allowances (EUAs), valid for compliance under the European Union Emissions Trading Scheme (EU ETS) created in 2005 to regulate CO2 emissions of more than 10,000 high carbon-intensive installations across Member States. Based on key design features of the EU ETS, this chapter develops carbon pricing strategies based on allowances supply and demand, institutional decisions, and the influence of other energy markets and weather conditions. Finally, we discuss the likely effects on economic growth on CO2 emissions and carbon prices as a by product. The discussions developed in this chapter focus on Phase I (2005-2007) of the EU ETS, which may described as the “pilot” period for the future development of this environmental market scheme.
Keywords: EU ETS; Cap-and-Trade Program; Climate Change Policy; CO2 Price;
Energy Markets; Weather Influences; Institutional Influences; Energy Policy
1. Introduction
The primary objective of the European Union Emissions Trading Scheme (EU ETS) is to regulate CO2 emissions from the most energy-intensive industrial sectors. Installations have to surrender as many allocated allowances as their previous year’s emissions. By allowing the emergence of a price – called a European Union Allowance (EUA) - for each emitted ton of
1 Mission Climat Caisse des Dépôts, Paris. Emilie.alberola@caissedesdepots.fr
2 Corresponding author. Imperial College London (Grantham Institute for Climate Change),
j.chevallier@imperial.ac.uk. South Kensington Campus, London SW7 2AZ, UK.
3
CO2, the EU ETS aims at conveying appropriate price signals to industrial operators. They can select a combination of capital investments, operating practices, and emissions releases to minimise the sum of abatements costs and allowance expenses. The main characteristic of cap-and-trade systems consists in leaving to each firm the ability to decide its abatement strategies depending on its own risk preferences and perceptions about regulatory uncertainties, as well as technical opportunities (i.e. in terms of fuel-switching).
The EU ETS needed to be functional on January 1, 2005. Its creation required the deployment of new governance processes between the European Commission, national State authorities, and operators in the 10,000 (and over) installations covered by the Directive 2003/87/CE. The development of technical tools was also necessary to deal with the delivery of allowances on industrials’ accounts, and to guarantee the monitoring of transactions.
This fast-track operational implementation was carried out with some delays (e.g., the start-up of the Polish registry) but without major difficulties. In 2005, the European Union carbon finance sector was born. Within the first three years of its infancy, active players in the market multiplied, organised exchanges were established, and trading activity quickly developed. The volume of over-the-counter trades in emission allowances and on the marketplaces has been constantly growing since then.
This chapter aims at analyzing the price fundamentals of CO2 allowances during 2005-2007. The remainder of the chapter is organized as follows. Section 2 reviews the key design issues of the EU ETS. Section 3 analyzes the CO2 price drivers by detailing the emissions shortfall factor, supply and demand mechanisms, the influence of other energy markets and weather events, as well as the likely effects of economic growth. Section 4 concludes.
2. Key design issues on the EU ETS
This section briefly reviews the main design features of the European carbon market. The EU ETS has been created by the Directive 2003/87/CE. Across its 27 Member States, the EU ETS covers large plants from CO2-intensive emitting industrial sectors with a rated thermal input exceeding 20MWh. One allowance exchanged on the EU ETS corresponds to one ton of CO2 released in the atmosphere. 2.2 billion allowances per year have been distributed during
Phase I (2005-2007). 2.08 billion allowances per year will be distributed during Phase II (2008-2012). With a value of around 20€ per allowance, the launch of the EU ETS thus corresponds to a net creation of wealth of around 40 billion €. In January 2008, the European Commission extended the scope of the EU trading system to other sectors such as aviation and petro-chemicals by 2013, and confirmed its functioning for a third Phase until 2020. In the next section, we detail the price fundamentals of CO2 allowances.
3. EUA Price drivers
In this section, we define first the emissions shortfall factor, second we detail the allowances supply and demand mechanisms, third we detail the influences of policy decisions, other energy markets and weather events. Fourth, we investigate the likely effects of economic growth on the price development of carbon prices.
3.1 The “emissions shortfall” factor
Whereas on energy markets the central pricing issue concerns the state of stocks, on the ETS the main question is the expected “emissions shortfall” factor during each compliance year. The emissions shortfall factor, defined as the difference between verified emissions and allocated allowances within a given compliance year, depends on the emissions abatements required by the cap, which are unknown but estimable based on reliable recent data.
3.2 Allowances supply and demand mechanisms
As for other commodity markets, the EUA price is driven by the balance between supply and demand, and by other factors related to market structure and institutional policies. However, EUAs exhibit strong features of being a non-standard commodity: installations do not need to physically hold allowances to produce, but only to match them with verified emissions for their yearly compliance report to the European Commission.
On the supply side, the first period of the market was quite limited, as no other carbon credits than Phase I EU allowances could be used for compliance: neither the use of Kyoto credits – even if transactions started in 2003 – nor Phase II EUAs – through borrowing - were allowed. Thus, the number of allowances available on the market was strictly equal to the number of allowances initially allocated to installations and to new entrants4.
3.2.2. Demand of EUAs
While allowance supply is politically fixed by each Member States through National Allocation Plans (NAPs), allowance demand is function of expected CO2 emissions. In the short and long run, the level of emissions depends on a large number of factors.
Short term abatement decisions, and thus the demand for allowances, are mainly driven by unexpected fluctuations in energy demand, energy prices and weather conditions (temperatures, rainfall and wind speed). CO2 emissions in the EU-ETS are linked one-to-one to the use of fossil fuels (such as oil, gas, coal). In turn, the demand for fossil fuels depends on their absolute and relative prices. The marginal fuel switching costs from high carbon-intensive sources of energy to low carbon-carbon-intensive sources for power and heat generation are the most important measures for carbon abatement in the short run, since power and heat operators are major actors on the EU ETS5.
Other factors influencing the demand for allowances are unexpected fluctuations of demand for energy in the short run. As outlined by Alberola et al. (2008), CO2 prices are affected by unexpected weather variations like temperatures, rainfall and wind. Cold winters increase the need for heating by electricity or fuels, whereas warm summers lead to higher electricity demand for cooling and lower rate of utilization of nuclear power plants due to reduced cooling by rivers. Rainfall, wind speeds and sun shine hours affect the share of power generated by carbon-free heat generation from hydropower, wind and solar energy. As a
4 Note the equilibrium market price may also be affected by flexibility mechanisms, such as banking and
borrowing provisions and the inflow of project mechanism credits, but these features were not applicable during Phase I.
5 The main sector whose share is the largest in terms of emissions covered by the EU ETS in Phase I is the power
sector, which accounts for over 50% of emissions capped by the scheme. Their emissions abatement costs are assumed to be the lowest compared to others sectors, notably through fuel switching from coal to gas.
whole, weather is widely acknowledged to have played an important role in explaining CO2 prices.
In the long run, the demand of allowances can be affected by economic growth and marginal abatement costs. Abstract from very long term investments like carbon capture and storage (CCS), CO2 emissions cannot be reduced by end-of -pipe technologies. Long-term marginal abatement costs are determined by investment decisions in low carbon-intensive energy utilities and in energy efficiency measures. Overall, with respect to high investment costs and uncertainties about the future of the EU ETS in 2005, firms faced mainly short term abatement costs during the first trading period when deciding on their allowance demand.
3.3 Institutional factors, other energy markets and weather influences
One of the most difficult factors to capture the influence on EUA demand is “market sentiment”. This expression refers to factors such as uncertainty about future energy prices and policy decisions. These factors are indeed especially important for investors’ expectations and the formation of their risk strategies.
There exists an emerging literature analysing the empirical relationships between EU carbon prices and its determinants during 2005-2007 that we propose to detail below.
3.3.1 Evidence on the impacts of the European Commission’s voice
Institutional decisions on the overall stringency of the cap have an impact on the carbon price formation through initial allocation. Besides, any decision or announcement from regulators (being Member States or the European Commission) may induce changes in market players’ behaviour. Official communications by the European Commission were essential to reach a better information flow on installations' net short/long positions6 during Phase I. The disclosure of compliance results may be seen as the cornerstone of changes in market participants’ expectation and strategies. In April 2006, when Member States and the European Commission disclosed the 2005 verified emissions for all EU ETS installations, the gap
6 An installation is defined as short (long) when it records a deficit (surplus) of allowances allocated with respect
between initial allocation to industrials and business-as-usual emission forecasts appeared positive, thereby causing a sharp fall in carbon prices of all maturities (more than 50% in four days).
Political choices can also impact the functioning of the market: in October 2006, announcements by the European Commission to validate more strictly NAPs during Phase II reinforced the general feeling that the market could be short during 2008-2012. From this date, Phase II prices increased and stabilized over 20€/ton of CO2. Alberola et al. (2008) identify statistically two structural endogenous breaks in the time-series of spot prices during 2005-2007: the first compliance period break goes from April 24, 2006 to June 12, 2006; and the second break due to the EU Commission stricter Phase II validation occurred from October 26, 2006 onwards7.
3.3.2 Evidence of the relationships between energy prices and carbon prices
Energy prices are the most important short term drivers of the demand for EUAs, due to the ability of power generators to switch between their fuel inputs (Mansanet-Bataller et al. (2007), Delarue and D’haeseleer (2007), Alberola et al. (2008), Bunn and Fezzi (2008), Ellerman and Feilhauer (2008)). As shown by Alberola et al. (2008), energy prices forecast errors have basically driven EUA price changes during 2005-2007, but their influence changed depending on institutional events. Brent, natural gas, coal, clean dark and spark spreads, as well as switch prices8 all impact significantly carbon spot prices, but their influence vary following the two structural breaks detected in the time series, and the corresponding sub-periods under consideration.
As detailed above, weather conditions have an impact on EUA prices by influencing energy demand. During the winter 2006, colder temperatures than the decennial average have
7 Phase I spot prices decreased towards zero until the end of Phase I due to banking restrictions implemented
between 2007 and 2008 (Alberola and Chevallier (2009)).
8 The dark spread is the theoretical profit that a coal-fired power plant makes from selling a unit of electricity
having purchased the fuel required to produce that unit of electricity. The spark spread refers to the equivalent for natural gas-fired power plants. The equilibrium between these clean spreads represents the carbon price above which it becomes profitable for an electric power producer to switch from coal to natural gas, and below which it is beneficial to switch from natural gas to coal. As long as the market carbon price is below this switching price, coal plants are more profitable than gas plants - even after taking carbon costs into account. This switching price is most sensitive to changes in natural gas prices than to coal prices changes (Kanen, 2006). These three profitability indicators are used to determine the preferred fuel in power generation.
had the expected statistical positive impact on EUA price changes. During the summer 2006 and the winter 2007, hotter temperatures than their decennial averages have affected negatively carbon price changes. (Alberola et al. (2008)).
3.4 The puzzle of economic activity effects on CO2 emissions and EUA prices
Economic activity is maybe the most obvious and the less understood driver of CO2 price changes. Economic growth leads to an increase in energy demand, and to higher industrial production in general. The first empirical analysis devoted to this topic may be related to Alberola et al. (2009a).
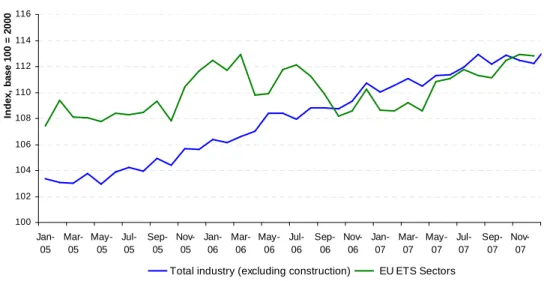
Figure 1: Industrial production in EU 27 during 2005-2007
100 102 104 106 108 110 112 114 116 Jan-05 Mar-05 May-05 Jul-05 Sep-05 Nov-05 Jan-06 Mar-06 May-06 Jul-06 Sep-06 Nov-06 Jan-07 Mar-07 May-07 Jul-07 Sep-07 Nov-07 In d e x , b a s e 1 0 0 = 2 0 0 0
Total industry (excluding construction) EU ETS Sectors
Source: Eurostat– calculations from the Mission Climat of Caisse des Dépôts.
As shown in Figure 1, economic activity in Europe has been relatively robust since the launch of the EU ETS in 2005: Gross Domestic Product (GDP) in the EU 25 grew by 1.9% in 2005, and 3.0% in 2006 according to Eurostat. Industrial production, seasonally adjusted by Eurostat, rose by 2.8% in 2005, and by 4.4 % in 2006. The trend has been similarly rising during 2007.
Figure 2: Industrial productions in EU ETS sectors 95 100 105 110 115 120 125 Jan-05 Mar-05 May-05 Jul-05 Sep-05 Nov-05 Jan-06 Mar-06 May-06 Jul-06 Sep-06 Nov-06 Jan-07 Mar-07 May-07 Jul-07 Sep-07 Nov-07 In d e x b a s e 1 0 0 = 2 0 0 0
Glass Cement Iron and steel Electricity, gas, steam and hot water supply EU ETS Sectors
Source: Eurostat– calculations from the Mission Climat of Caisse des dépôts.
As shown in Figure 2, production growth in the EU ETS sectors was contrasted during the first three years of the scheme. In 2005, four sectors recorded a negative growth at the aggregated EU level: coke, refineries, glass and ceramics sectors. The EU coke sector recorded a strong decrease by -20%, mainly localized in Poland (-32%), and in the United-Kingdom (-7%). The decrease in annual production in three other sectors was limited. The glass production decreased strongly by -9.88% in Germany, by -4.28% in the United-Kingdom whereas it increased by 5.02% in Spain, and by 13.72% in Poland. The production of ceramics decreased in 2005 in all Member States, with the exception of Poland where it increased by 19.55%. Five sectors recorded a positive production growth in 2005: paper, cement, iron, metal and combustion9. More particularly, in the combustion sector production grew in all MS, from 2.24% in the UK to 12.95% in Italy.
9
The combustion sector represents the largest share of installations in the EU ETS with 70\% of the EU allocation. The combustion sector was defined in a different way by each MS and contains too many sub-activities. Based on the CITL data and the Classification NACE Rev.1 C-F, Trotignon and McGuiness (2007) and Trotignon et al. (2008) classify between large electricity production plants, district heating facilities (cogeneration when details were available) and other installations.
In 2006, whereas industrial production increased in seven industries, the combustion sector recorded a decrease by - 4.93% at the EU level, and in all countries from 1.83% in Spain to -8.13% in Germany and -9.36% in Italy. These trends were stable during 2007.
Based on these characteristics of the global economic context and of diverging industrial production changes in EU ETS sectors, Alberola et al. (2009a) attempt to disentangle econometrically potential impacts ranging from the production to the environmental spheres on carbon price changes. Their econometric analysis shows that three among nine sectors have a significant effect on EUA price changes from July 1, 2005 to April 30, 2007. These sectors are combustion, paper and iron and total 78% of allowances allocated. Besides, they identify through which channels variations of industrial production from EU ETS sectors may operate on EUA price changes: both the variation of production and the net short/long position are significant and have the expected effects on CO2 price changes. The role played by yearly compliance positions and production peaks on this new market is demonstrated. Finally, it is worth emphasizing that Alberola et al. (2009b) have extended these results to a country-specific analysis of industrial sectors during 2005-2007. The latter results revealed the role played by the German power sector in overall affecting EUA price changes based on this decomposition between industrial activity and CO2 emissions effects.
4. Conclusion
This chapter features an analysis of the CO2 price determinants in the EU ETS during the “pilot” Phase (2005-2007). Following a brief review of key design issues in the EU ETS, we have detailed the main carbon price drivers based on classic supply and demand analysis, but also with respect to the salient characteristics of the European cap-and-trade program (especially in terms of aggregated level of verified emissions and compliance). Finally, we have emphasized that the main price drivers are linked to institutional decisions, other energy market prices (oil, gas, coal, electricity, and more generally fuel-switching in the power sector), and unanticipated temperatures changes. The last puzzle that remains to be solved concerning Phase I EUA price drivers lies in the determination of the influence of economic activity, through changes in CO2 emissions levels, as initiated by recent empirical analyses.
REFERENCES
Alberola, E. and Chevallier, J. 2009. European Carbon Prices and Banking Restrictions: Evidence from Phase I (2005-2007). The Energy Journal 30(3), 107-136.
Alberola, E., Chevallier, J., and Chèze, B., 2008. Price Drivers and Structural Breaks in European Carbon Prices 2005-2007. Energy Policy 36(2), 787-797.
Alberola, E., Chevallier, J., and Chèze, B., 2009a. The EU Emissions Trading Scheme: Disentangling the Effects of Industrial Production and CO2 Emissions on Carbon Prices. International Economics 116.
Alberola, E., Chevallier, J. and Chèze, B. 2009b. Emissions Compliances and Carbon Prices under the EU Trading Scheme: A Country Specific Analysis of Industrial Sectors. Journal of Policy Modeling 31, 446-462.
Bunn, D., and Fezzi, C., 2007. Interaction of European Carbon Trading and Energy Prices. Fondazione Eni Enrico Mattei Working Paper 123.
Delarue, E.D. and D’haeseleer, W.D., 2007. Price determination of ETS allowances through the switching level of coal and gas in the power sector. International Journal of Energy Research 31, 1001-1015.
Ellerman, A.D., and Buchner, B.K., 2008. Over-allocation or abatement? A preliminary analysis of the EU ETS based on the 2005-06 emissions data. Environmental and Resource Economics 41, 267-287.
Ellerman, A.D., and Feilhauer, S. 2008. A Top-down and Bottom-up Look at Emissions Abatement in Germany in Response to the EU ETS. MIT CEEPR Working Paper 2008-017.
Mansanet-Bataller, M., Pardo, A., and Valor, E., 2007. CO2 Prices, Energy and Weather. The Energy Journal 28 (3), 67-86.
Trotignon, R., and McGuiness, M., 2007. Technical Memorandum on Analysis of the EU ETS Using the Community Independent Transaction Log. MIT-CEEPR Working Paper 2007-012.
Trotignon, R.,McGuiness, M.,and Delbosc, A., 2008. European CO2 Market and the CITL: The Trial Period Under Scrutiny. Research Report Mission Climat, Caisse des Dépôts, Paris.