HAL Id: hal-00304629
https://hal.archives-ouvertes.fr/hal-00304629
Submitted on 1 Jan 2001HAL is a multi-disciplinary open access archive for the deposit and dissemination of sci-entific research documents, whether they are pub-lished or not. The documents may come from teaching and research institutions in France or abroad, or from public or private research centers.
L’archive ouverte pluridisciplinaire HAL, est destinée au dépôt et à la diffusion de documents scientifiques de niveau recherche, publiés ou non, émanant des établissements d’enseignement et de recherche français ou étrangers, des laboratoires publics ou privés.
adjustments and inclusion of nitrogen dynamics in the
MAGIC model
B. J. Cosby, R. C. Ferrier, A. Jenkins, R. F. Wright
To cite this version:
B. J. Cosby, R. C. Ferrier, A. Jenkins, R. F. Wright. Modelling the effects of acid deposition: refine-ments, adjustments and inclusion of nitrogen dynamics in the MAGIC model. Hydrology and Earth System Sciences Discussions, European Geosciences Union, 2001, 5 (3), pp.499-518. �hal-00304629�
Modelling the effects of acid deposition: refinements, adjustments
and inclusion of nitrogen dynamics in the MAGIC model
B.J. Cosby
1, R.C. Ferrier
2, A. Jenkins
3and R.F. Wright
4 1 Department of Environmental Sciences, University of Virginia, Charlottesville, VA22901 USA 2 Macaulay Institute, Craigiebuckler, Aberdeen AB9 2QJ, UK3 Centre for Ecology and Hydrology, Wallingford, Oxon OX10 8BB, UK 4 Norwegian Institute for Water Research, Box 173 Kjelsas, N-0411 Oslo, Norway
Email for corresponding author: [email protected]
Abstract
The MAGIC model of the responses of catchments to acidic deposition has been applied and tested extensively over a 15 year period at many sites and in many regions around the world. Overall, the model has proven to be robust, reliable and useful in a variety of scientific and managerial activities. Over the years, several refinements and additions to MAGIC have been proposed and/or implemented for particular applications. These adjustments to the model structure have all been included in a new version of the model (MAGIC7). The log aluminium – pH relationship now does not have to be fixed to aluminium trihydroxide solubility. Buffering by organic acids using a triprotic analog is now included. Dynamics of nitrogen retention and loss in catchments can now be linked to soil nitrogen and carbon pools. Simulation of short-term episodic response by mixing fractions of different water types is also possible. This paper presents a review of the conceptual structure of MAGIC7 relating to long-term simulation of acidification and recovery, describes the conceptual basis of the new nitrogen dynamics and provides a comprehensive update of the equations, variables, parameters and inputs for the model.
Keywords: process-based model, acid deposition, recovery
Introduction
A number of mathematical models of soil and surface water acidification in response to atmospheric deposition was developed in the early 1980s (e.g. Christophersen and Wright, 1981; Christophersen et al., 1982; Schnoor et al., 1984; Booty and Kramer, 1984; Goldstein et al., 1984; Cosby et al., 1985a,b,c). These models were based on process-level information about the acidification process and were built for a variety of purposes ranging from estimating transient water quality responses for individual storm events to estimating chronic acidification of soils and base flow surface water. The Model of Acidification of Groundwater In Catchments (MAGIC) (Cosby et al., 1985a,b,c) has now been in use for more than 15 years. MAGIC has been applied extensively in North America and Europe to both individual sites and regional networks of sites and has also been used in Asia, Africa and South America. The utility of MAGIC
for simulating a variety of water and soil acidification responses at the laboratory, plot, hillslope and catchment scales has been tested using long-term monitoring data and experimental manipulation data. MAGIC has been widely used in policy and assessment activities in the United States and in several countries in Europe.
Several refinements or additions to MAGIC have been proposed or implemented over the years as a result of the many applications of the model. These changes address inadequacies in the original structure revealed by the repeated application and testing of the model and incorporate new processes in the model that recent research has indicated are of increasing importance in natural systems. The refinements to the original model structure relate to assumptions regarding aluminium (Al) solubility (e.g. Sullivan and Cosby, 1998) and organic acid buffering (e.g. Cosby et al., 1995; Sullivan et al., 1996). The new additions
to the model provide: (1) a facility for simulating short-term episodic responses in lakes and streams (e.g. Cosby, 1998); and (2) process-based nitrogen (N) dynamics in soils controlled by soil N pools (a new formulation described here for the first time). In light of the accumulated refinements to the MAGIC model and in consideration of the fact that the original MAGIC model is still in widespread use, the refined model is referred here as MAGIC7 (MAGIC version 7) to distinguish it from the earlier versions of MAGIC. The objectives of this paper are: (1) to provide a brief review of the physical, chemical and biological processes affecting long-term acidification and recovery, and describe their conceptual inclusion in the MAGIC model; (2) to give brief descriptions and explanations of the refinements to the earlier versions of MAGIC that have been incorporated in MAGIC7; (3) to provide details of the new N dynamics included in MAGIC7; and (4) to document the revised mathematical formulation of MAGIC7 including the equations, parameters and inputs.
Conceptual basis of acidification
models
Research has focused attention on certain biological and chemical processes in the soils of catchments as keys to the responses of surface water quality to acidic deposition. These processes include:
z anion retention by catchment soils (e.g. sulphate (SO4) adsorption);
z weathering of minerals in catchment soils as a source of base cations (calcium (Ca), magnesium (Mg), sodium (Na), potassium (K));
z adsorption and exchange of base cations and Al by catchment soils;
z buffering of soil solution pH by weak organic acids (e.g. humic and fulvic acids) and by weak inorganic acids (e.g. Al hydroxides and carbonic acid);
z formation of Al complexes with fluoride (F) and sulphate ions and with organic compounds;
z biologically mediated transformations and uptake of cations and anions (particularly base cations and both oxidized and reduced N species);
z generation of acid neutralising capacity (ANC) by dissociation of carbonic acid with subsequent exchange of hydrogen (H) ions for base cations.
A critical issue is how quickly and to what extent these processes affect the responses of surface water chemistry to changes in rates of acidic atmospheric deposition. Water chemistry changes in response to changed deposition occur
over time scales of years to decades in natural systems. The model uses existing information to estimate the patterns, time scales and magnitudes of long-term changes in surface water chemistry in response to actual or assumed changes in the levels of atmospheric sulphur (S) and N deposition.
A number of models such as SMART (Posch et al., 1993) and SAFE (Warfvinge et al., 1993) have been developed to simulate acidification responses. While the models may vary in details of their application (different spatial and temporal scales and resolution), they are all based on similar conceptualisations of the chemical and physical processes. MAGIC is a lumped-parameter model of intermediate complexity, developed to predict the long-term effects of acidic deposition on soils and surface water chemistry. The model simulates soil solution chemistry and surface water chemistry to predict the monthly and annual average concentrations of the major ions in lakes and streams. MAGIC represents the catchment with aggregated, uniform soil compartments (one or two) and a surface water compartment that can be either a lake (with finite turnover time) or a stream. The soil layers can be arranged vertically or horizontally to represent important vertical or horizontal flowpaths through the soils. If a lake is simulated, seasonal stratification of the lake can be implemented. Time steps are monthly or yearly. Time series inputs to the model include annual or monthly estimates of: (1) deposition of ions from the atmosphere (wet plus dry deposition); (2) discharge volumes and flow routing within the catchment; (3) biological production, removal and transformation of ions; (4) internal sources and sinks of ions from weathering or precipitation reactions; and (5) climate data. Constant parameters in the model include physical and chemical characteristics of the soils and surface waters, and thermodynamic constants. The model is calibrated using observed values of surface water and soil chemistry for a specified period. Details of the inputs and parameters are provided below, following a brief consideration of the physical and chemical processes involved in the acidification and recovery of soils and surface waters.
PROCESSES AFFECTING ACIDIFICATION AND RECOVERY
The most important effects of acidic deposition on catchment surface water chemistry are decreased pH and ANC and increased base cation and Al concentrations. Reuss (1980; 1983) proposed a simple system of reactions describing the equilibrium between dissolved and adsorbed ions in the soil-soil water system. Reuss and Johnson (1985) expanded this system of equations to include the effects of carbonic acid resulting from elevated carbon dioxide (CO2) partial pressure
in soils and demonstrated that large changes in surface water chemistry should be expected as either CO2 or SO4 concentrations varied in the soil water. The conceptual approach of Reuss and Johnson is attractive in that a wide range of observed catchment responses can be theoretically produced by a rather simple system of soil reactions. These reactions lie at the heart of MAGIC.
Definition of ANC and soil reactions affecting its constituents
Acid neutralising capacity is defined as the sum of base cation concentrations minus the sum of strong acid anion concentrations:
ANC = 2(Ca2+) + 2(Mg2+) + (Na+) + (K+) + (NH4+) – 2(SO
4
2-) – (Cl-) – (NO 3
-) (1)
where all concentrations are in moles per litre. Considering the dominant ions in fresh surface waters, and applying charge balance considerations, the definition of ANC above (Eqn. 1) is equivalent to:
ANC = 2(CO32-) + (HCO 3
-) + (OH-) + m(Am-)
– (H+) – n(Aln+) (2)
where n(Aln+) represents the net charge on the species of inorganic Al present, and m(Am–) represents the net charge on the species of organic anion present.
While numerically equivalent, the former definition (Eqn. (1)) is commonly referred to as the “charge balance ANC”, while the latter definition (Eqn. (2)) is the familiar definition of bicarbonate–carbonate alkalinity. Regardless of the definition used, any chemical or physical process that affects the concentration of any constituent ion must be considered in constructing a model of ANC response to atmospheric deposition. Natural soil processes directly affect ionic concentrations in both definitions of ANC. Atmospheric deposition, however, directly affects only the constituents of the charge balance definition. As these ions change (and the ANC adjusts) the ionic concentrations in Eqn. (2) are indirectly affected. In the discussion below, the chemical processes that affect ANC and that occur naturally in soils are briefly reviewed, followed by a discussion of the changes in these processes that can occur as a result of acidic atmospheric deposition.
Carbon dioxide is produced in soils by respiration. The CO2 dissolves in soil water to form carbonic acid, which then dissociates to H ion and bicarbonate (HCO3) and carbonate ions:
CO2 + H2O = H+ + HCO 3
- (3)
Various solid phases of Al trihydroxide exist in soils as a result of the weathering of primary and secondary minerals in the soils. Hydrogen ions in soil solution react with these Al solids to produce inorganic Al in the soil solution:
3H+ + Al(OH) 3 = Al
3+ + 3 H
2O (4)
The trivalent Al in solution will undergo a number of hydrolysis and complexation reactions to produce the array of Al species represented as n(Aln+) and m(Am-) in the ANC definition above.
Mineral and organic solids in soils have distributed surface charges that provide a substrate for cation adsorption and exchange. Generally, the cation exchange sites on the soil matrix have a higher affinity for the trivalent Al cation than for di- or monovalent base cations. An exchange of cations between dissolved and adsorbed phases results:
Al3+ + BC
3X = AlX + 3BC
+ (5)
where BC+ represents a base cation and X represents the soil exchange complex.
Combining the definitions of ANC with a consideration of these general soil processes, the following conclusions can be reached: (1) any process that produces strong base cations increases the ANC of the soil solution; (2) any process that produces strong acid anions decreases the ANC of the soil solution; (3) if ANC decreases, pH will decrease and inorganic Al will increase; and (4) a large strong base cation exchange pool provides a buffer against ANC change. The converse statements are also true.
Dependence of ANC on interacting soil processes
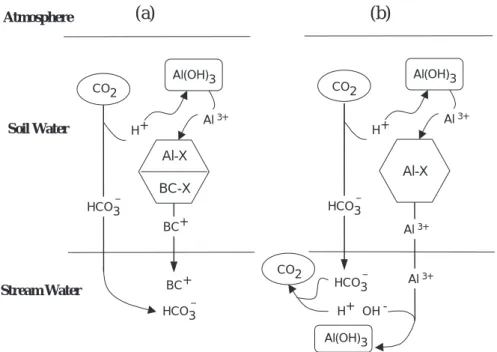
To illustrate the reasoning behind the conclusions above, consider the interactions of these soil processes in a natural setting (Fig. 1a). As the CO2 partial pressure in the soil increases due to respiration, H and HCO3 ions are produced by the dissociation of carbonic acid. The H ions thus produced dissolve inorganic Al, which in turn displaces a strong base cation (BC+) from the soil exchange complex. The overall results are net increases in base cation and HCO3 concentrations, and thus a net production of ANC in soil solution. If the soil water is removed from contact with the soil matrix and is exposed to the atmosphere (i.e. soil water enters a lake or stream channel), the solution will degas CO2 due to the lower atmospheric partial pressure of CO2. Because the solution is no longer in contact with the soil, however, cation exchange reactions do not occur and
changing the CO2 partial pressure of the HCO3 buffer solution will result in a change of pH but no net change in ANC. Thus, the ANC of the soil solution is equal to the ANC of the stream water, even though CO2 partial pressure is generally much lower in surface waters.
In this example a single base cation is considered. In real systems, all four base cations are present and have different affinities for the soil exchange sites, dissolved trivalent Al can complex with dissolved anions (e.g. SO4 or F) or can be hydrated to form dissolved Al (OH), Al(OH)2, Al(OH)3 and Al(OH)4 species, and organic acids can provide additional buffering of H ions. These additional complexities can affect the final pH of the surface water, but they do not change the ANC. The broad conclusion illustrated by Fig. 1a is that natural soil processes (in the presence of strong base cations adsorbed on the soil matrix) result in the production of ANC in soil solution that can be exported to surface waters.
If there are few exchangeable base cations on the soil matrix the situation is different (Fig. 1b). Production of HCO3 and H from dissolved CO2 and mobilisation of Al from ion exchange or dissolution proceed as before. There is, however, now limited possibility of exchange of Alfor base cations (this situation may occur before all base cations are lost from the soil if the soil affinity for base cations is large). The soil solution in this case consists primarily of HCO3, H and Al ions. When the soil water enters the stream, CO2 degasses consuming one HCO3 and one H ion for each molecule of CO2 lost. As the concentration of H ions
decreases, the solubility of the Al solid phase is exceeded and Al precipitates as Al(OH)3, releasing H. These reactions proceed until a new equilibrium is reached. Again there is no net change in ANC as the water passes from soil to surface (although the ANC in this case is nearly zero). The broad conclusion illustrated by Fig. 1b is that a lack of exchangeable base cations on the soil matrix means that there is essentially no possibility of net ANC production in the soils (and no ANC export to surface waters).
The situation changes when an external source of strong acid, such as sulphuric acid (H2SO4) from atmospheric deposition, is added to the soil (Fig. 2a). Some of the SO4 may be retained in the soil by adsorption or reduction processes, but the remainder will move through the soil. The H ions that accompanied the SO4 from atmospheric deposition exchange or dissolve additional Al (relative to the case with no acidic deposition; Fig. 1a), which in turn forces the cation exchange reactions to proceed further. As the base cation concentrations increase, however, relatively less of the additional Al can be exchanged, and Al concentration begins to rise also. The amount of additional Al that can be exchanged (and thus the amount of atmospheric H that can be buffered) depends on the amount of exchangeable base cations on the soil. Soils with a large amount of exchangeable base cations will respond to acidic deposition by neutralising essentially all of the atmospherically deposited H. Soils with a small amount of exchangeable base cations will be able to neutralise little of
Atmosphere Soil Water Stream Water Al-X Al(OH)3 HCO3 HCO3 H+ Al 3+ Al 3+ Al 3+ H+ OH -Al(OH)3 CO2 CO2 Al-X BC-X CO2 Al(OH)3 HCO3 BC+ BC+ H+ Al 3+ HCO3
Fig. 1. Schematic illustration of the responses of the system of soil reactions included in MAGIC7 in
the absence of acidic deposition: (a) with exchangeable base cations; and (b) without exchangeable base cations.
the atmospherically derived acidity. In either case, the initial effects of acidic deposition on catchment soils are increases in base cation concentrations, an increase in Al concentration, and a partial reduction of ANC in soil water. This is termed the “salt effect”(Reuss and Johnson, 1986). As the soil solution enters the stream, there is again no change in the net ANC of the soil solution. The base cation salts of HCO3 and SO4 remain totally dissociated as the pH rises. The initial effect of adding a strong acid to the system is to increase the ionic strength of the streamwater. Stream ANC may not be reduced significantly. The magnitude of ANC decrease depends largely on the amount of exchangeable base cations on the soil (i.e. the soil base saturation). The broad conclusion illustrated by Fig. 2a is that the acidity of acidic atmospheric deposition can be largely neutralised in soils that have a large supply of exchangeable base cations, resulting in little acidification of surface waters (no decline in pH or increase in inorganic Al).
If the H2SO4 is added to the soil with few exchangeable base cations (Fig. 2b), the acidity of the precipitation is effectively not buffered. As before, some or all of the SO4 passes through the system. The H ion deposited from the atmosphere exchanges for or dissolves Al. No base cation exchange occurs so all of the dissolved Al enters the stream. When the solution degasses, that portion of the Al produced by the carbonic acid is consumed as Al(OH)3 precipitates. The excess Al produced by the atmospheric H ion is not
balanced by an equivalent amount of HCO3 alkalinity. As the stream pH rises, some of the excess Al ions precipitate, producing free H ions in the stream. The net result is acidic streamwater with a negative ANC, lower pH and higher Al concentration. The broad conclusion illustrated by Fig. 2b is that soils with small pools of exchangeable base cations are not capable of buffering acidic deposition, with the result that surface waters will become acidic with declining pH and increasing inorganic Al.
Long-term production of ANC in natural soils
The reactions illustrated above deal with the initial mass action shifts in soil equilibrium processes. These equilibria are assumed to occur instantaneously. The question arises: what controls the long-term response of the catchment streamwater chemistry? Clearly, in the pristine case (Fig. 1), the situation in a catchment would be expected to shift from that in Fig. 1a to that in Fig. 1b if there were no long-term supply of base cations to replace those lost from the exchange sites. That long-term supply must be the base cations in deposition and the weathering of primary minerals in the catchment soils. If the system had been operating long enough to achieve a steady state, the output flux of base cations in the stream would equal the deposition plus the primary weathering input fluxes. The degree of base saturation (fraction of soil cation exchange sites occupied by base cations) at a steady state is, thus, a function of the
Atmosphere Soil Water Stream Water Al-X BC-X CO2 Al(OH)3 HCO3 BC+ BC+ H+ Al 3+ HCO3 H+ H2SO4 SO4 2-SO4 2-H+ H2SO4 SO4 2-SO4 2-Al-X Al(OH)3 HCO3 HCO3 H+ Al 3+ Al 3+ Al 3+ H+ OH -Al(OH)3 CO2 CO2 OH -
H+ Al 3+
Fig. 2. Schematic illustration of the responses of the system of soil reactions included in MAGIC7 to
the addition of H2SO4 to a soil: (a) with exchangeable base cations, and (b) without exchangeable base cations. Catchments in sensitive settings exhibit responses to acidic deposition between these
two extremes.
atmospheric deposition of base cations, the primary weathering rate, the cation selectivity of the soil and the hydrological response of the catchment.
Changes in the production of ANC in response to acidic deposition
If the steady state catchment is suddenly subjected to acidic deposition (Fig. 2a), the base cations produced by the mobile anion effect must be derived from the exchangeable base cations of the soil. This assumes that primary mineral weathering is not increased by the acidic deposition. This assumption seems valid since the net effect of the soil processes is to buffer the soil pH. Changes in soil pH will lag the onset of acidic deposition. Unless soil solution pH changes, primary weathering will not be affected. The increased loss of base cations from the catchment will move the system away from the steady state. The base saturation of soils will decline and the system will move from the situation depicted in Fig. 2a towards that shown in Fig. 2b. If the acidic deposition remains constant at a high enough level, the stream base cation concentrations may eventually begin to decline after the initial increase due to the salt effect. When a new steady state is reached, the stream base cation concentrations will have returned to close to their pre-acidification levels (stream output of base cations equals deposition plus unchanged weathering input of base cations). The increased mobile anion charge will be balanced primarily by H and Al, and the stream ANC and pH will have declined. If the deposition acidity exceeds the ANC production capacity of the catchment, the stream becomes acidic.
The crucial questions are: How long will it take to reach the new steady state? What happens to the system during the transition? When acidic deposition decreases, how and when will the systems return to the pristine state? It is to address such questions that mathematical models of soil and surface water processes have been developed.
Mathematical formulation of MAGIC
The equations in MAGIC are grouped into three categories to facilitate the presentation of the mathematical structure (Table 1). The model is composed of a set of equilibrium equations which quantitatively describe the equilibrium soil processes and the chemical changes that occur as soil water enters the stream channel, a set of mass balance equations which quantitatively describe the catchment input-output relationships for base cations and strong acid anions, and a set of N immobilisation equations that describe the control of nitrate (NO3) and ammonium (NH4) immobilisation in
catchment soils. The variables, parameters and inputs for these equations are defined in Tables 2, 3 and 4, respectively. Cosby et al. (1984, 1985a,b) described the derivation of the model equations, their assumptions and the solution routines, and discussed the adequacy of this lumped parameter representation of soil equilibrium processes. Those descriptions are summarised briefly below. Refinements that have been made in MAGIC7 are noted where applicable. The N immobilisation equations have not been previously presented and will be considered here in more detail.
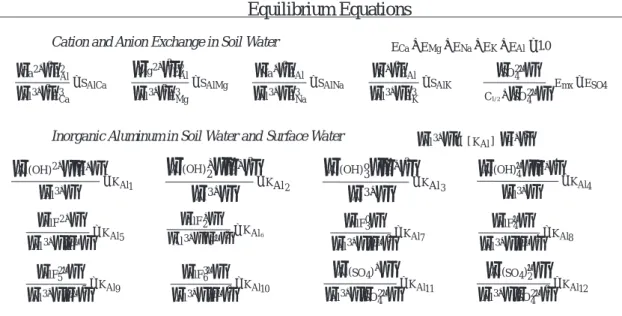
EQUILIBRIUM EQUATIONS
Cation and anion exchange in soil water
Cation exchange reactions between the soil matrix and soil solution are assumed to result in an equilibrium partitioning of Ca, Mg, Na, K and Al between solid and aqueous phases. The equilibrium expressions for cation exchange (Table 1) are constructed using a Gaines-Thomas expression (Gaines and Thomas, 1953). Exx represents exchangeable fractions of each base cation on the soil (equivalents of each base cation per total cation exchange capacity of the soil). The sum of all exchangeable fractions must equal one. Base saturation of the soil is defined as the sum of the exchangeable fractions of the base cations (Table 2). The selectivity coefficients (Table 3) must be calibrated for each aggregated soil layer in the model. The calibration procedure relies on observations of the exchangeable fractions of base cations in soils and measured base cation concentrations in streamwater (see Cosby et al., 1984, 1985a,b).
Anion exchange reactions are assumed to occur only for SO4 ion. The relationship between dissolved and adsorbed SO4 (Table 1) is assumed to follow a Langmuir isotherm (Couto et al., 1979; Hasan et al., 1970). MAGIC is a catchment-scale model and it is often the case that the effective values of aggregated parameters intended to represent large-scale function cannot be derived by a direct scaling-up of similar parameters measured in a laboratory setting (see Rastetter et al., 1992). The SO4 adsorption parameters (Table 3) used in MAGIC must, therefore, be calibrated for each site. Cosby et al. (1986) described a method for calibrating SO4 adsorption parameters in whole catchment simulations based on input/output budgets and deposition histories for the site.
Inorganic aluminium in soil water and surface water Inorganic Al speciation in soils is described by one reaction describing the combined effects of soil cation exchange and dissolution of a solid phase of Al trihydroxide (the
Table 1. Equations in the MAGIC model. Parentheses denote molar concentration and brackets denote activities (calculated from concentrations using the extended Debye-Huckel equation).
Equilibrium Equations
Cation and Anion Exchange in Soil WaterCa Mg Na K Al E +E +E +E +E =10.
{ }
{ }
3 2 2 2 3 3 + + = Ca E Al E S Al Ca AlCa{ }
{ }
3 2 2 2 3 3 + + = Mg E Al E S Al Mg AlMg{ }
{ }
3 3 3 + + = Na E Al E S Al Na AlNa{ }
{ }
3 3 3 + + = K E Al E S Al K AlK{ }
{ }
4 2 4 2 4 1/ 2 − − + ∗ = SO C SO Emx ESOInorganic Aluminum in Soil Water andSurface Water
{ }
Al3+ = K ∗{ }
H+ Al SAl [ ]{
}
{ }
{ }
2 3 1 + + + = Al OH H Al KAl ( ){
}
{ }
{ }
23 2 2 + + + = Al OH H Al Al K ( ){
}
{ }
{ }
33 3 3 o Al OH H Al Al K ( ) + + ={
}
{ }
{ }
4 4 3 4 − + + = Al OH H Al KAl ( ){ }
{ }{ }
2 3 5 + + − = AlF Al F KAl { } { }{ }
2 3 2 6 + + − = AlF Al F KAl{ }
{ }{ }
3 0 3 3 7 AlF Al F KAl + − ={ }
{ }{ }
4 3 4 8 − + − = AlF Al F KAl{ }
{ }{ }
5 2 3 5 9 − + − = AlF Al F KAl{ }
{ }{ }
6 3 3 6 10 − + − = AlF Al F KAl{
}
{ }{ }
+ + − = Al SO Al SO KAl ( 4) 3 4 2 11{
}
{ }{ }
2 4 3 2 4 2 12 − + − = Al SO Al SO KAl ( )Inorganic and Organic Carbon in Soil Water and Surface Water; Dissociation of Water
{ }{ }
H+ OH− =K w{
2 3}
2 2 1 H CO PCO KCO * ={
}
{ }{
23 3}
22 − + = HCO H H CO KCO *{ }
{ }{
3}
2 3 3 2 − + − = CO H HCO KCO{ }{ }
{ }
2 3 1 H A H H A KOA − + ={ }{ }
{ }
2 2 2 − + − = HA H H A KOA{ }{ }
{ }
3 2 3 − + − = A H HA KOA{ }
{ }{ }
AlA Al A KOA 3+ 3− 4 ={
}
{ }{ }{ }
+ + + − = Al H A Al H A KOA ( ) 3 3 5Mass and Ionic Balance
Ionic Balance in Soil Water and Surface Water( )
( )
( ) ( ) ( ) ( ) ( ) (
)
(
)
( )
( ) (
)
(
)
2 2 2 2 3 2 2
4 3 2 2 2 2 4
+ + + + + + + + + + ++ + + ++ + + ++ + + + + +
Ca Mg Na K NH H Al AlOH Al OH( ) AlF AlF AlSO Al H A( )
=
2( ) ( ) ( ) ( ) ( ) (
42) ( ) (
2)
2( ) ( )
3(
)
( ) ( )
23 3 32 2 2 3 4 4 52
− + −+ − + − + − + − + −+ − + − + − + − + −+ −
SO Cl NO F OH HCO CO H A HA A Al OH( ) AlF AlF
( )
(
)
+3 −+ − 6 3 2 4 AlF Al SO( )Mass Balance for Ions in Soil Water and Surface Water (rates of change in eq m-2 yr -1
)
( )
T Ca Ca Ca dCa dt =AD +W +SS − ∗Q Ca + 2 2 3( )
3 3 3 3 3 3 T NO NO NO NO NO dNO dt =AD +W +SS +NIT−IM −UP −DEN− ∗Q NO −( )
T Mg Mg Mg dMg dt =AD +W +SS − ∗Q Mg + 2 2 4 4 4 4 4 4( )
4 T NH NH NH NH NH dNH dt =AD +W +SS +MIN−IM −UP −NIT− ∗Q NH +( )
T Na Na Na dNa dt =AD +W +SS − ∗Q Na + 4[
( ) (
)
(
)
]
4 4 4 2 42 4 2 42 T SO SO SO dSO dt =AD +W +SS − ∗Q SO + AlSO + Al SO − + ( )−( )
T K K K dK dt =AD +W +SS − ∗Q K + T( )
Cl Cl Cl dCl dt =AD +W +SS − ∗Q Cl −( ) ( ) ( ) ( ) ( ) ( ) ( )
[
]
T F F F dFdt =AD +W +SS − ∗Q F + AlF + AlF + AlF + AlF + AlF + AlF
− 2+ + − − −
2 30 4 52 63
2 3 4 5 6
Mass Balance for Soil Organic Matter (rates of change in mol m -2 yr -1
)
Org Org Org dC dt =C IN−C OUT−DCMP Org NO NH Org IN Org OUT dN dt IM IM MIN C C N C C N IN OUT = 3+ 4− + − ( / ) ( / )
Nitrogen Immobilization Equations
Immobilization of Nitrate and Ammonium by Soil Organic Matter (mol m-2 yr-1)
[ ]
NO NO NO NO NO NO
IM 3=P 3∗AD 3+SS 3+W 3+NIT−UP 3 IMNH4=PNH4∗[ADNH4+SSNH4+WNH4+MIN−NIT−UPNH4]
where PNO3 = [C/N-CNLONO3]/[CNUPNO3-CNLONO3]; where PNH4 = [C/N-CNLONH4]/[CNUPNH4-CNLONH4]; = 1 if C/N > CNUPNO3; = 0 if C/N < CNLONO3 = 1 if C/N > CNUPNH4; = 0 if C/N < CNLONH4
State Variables (functions of time, calculated by model)
Aqueous Phase - Ionic Concentrations in Soil Water and Surface Water (mol m-3)
Base Cations:
( )
2( )
2( ) ( ) ( )
4
+ + + + +
Ca ,Mg ,Na ,K ,NH Strong Acid Anions:
( )
SO24−,( ) ( ) ( )
Cl−,NO3−,F−Hydrogen and Hydroxyl Ions:
( )
H+,( )
OH− Inorganic Carbon:(
) (
) (
)
2 3 3 32
H CO*,HCO−,CO−
Aluminum:
( ) (
3 2)
(
) (
) (
)
( )
( ) ( ) ( ) (
) (
) (
)
(
)
2 30 4 2 2 30 4 52 63 4 42
+ + + − + + − − − + −
Al ,AlOH ,Al OH( ) ,Al OH( ) ,Al OH( ) ,AlF ,AlF ,AlF ,AlF ,AlF ,AlF ,AlSO ,Al SO( )
Organic Carbon:
(
) (
)
( )( )
( )
(
)
3 2 2 3
H A ,H A−,HA−,A−,AlA ,Al H A( ) +
Solid Phase - Exchangeable Ions on Soil Matrix; Soil Organic Matter Constituents
Exchangeable Cations (fraction): ECa,EMg,ENa,EK,EAl Exchangeable Sulphate (eq kg-1): ESO4
Organic Carbon and Nitrogen (mol m-2): COrg,NOrg
Defined Variables (derived from state variables)
Total Ions for Mass Balance (eq m-2) SO4T=SM E∗ SO4+SV TOT∗ SO4
( )
T Ca Ca =SM CEC E∗ ∗ +SV∗2Ca2+( )
T Na Na =SM CEC E∗ ∗ +SV∗ Na+ NO3T=SV∗( )
NO3− ClT=SV∗( )
Cl−( )
T MgMg =SM CEC E∗ ∗ +SV∗2Mg2+ KT=SM CEC E∗ ∗ K+SV∗
( )
K+ NH4T=SV∗( )
NH4+ FT=SV TOT∗ FTotal Aqueous Concentrations (eq m-3)
( )
( )
( ) ( )
SBC=2Ca2++2Mg2++ Na++ K+
Al TOT
TOT =3(Al) TOTF=
( )
AlF2+ +2( ) ( ) ( ) (
AlF+2 +3AlF03+4AlF4−+5AlF52−) (
+6AlF63−)
( )
( ) ( ) ( )
SAA=2SO24−+ Cl− + NO3− + F− DOCAl=3(Al)DOC TOTSO4=2
( ) (
SO42− +2AlSO4+)
+4(
Al SO( 4)2−)
Summed Species (mol m-3) ( )
(
)
(
)
SO
Al 4= AlSO4+ +Al SO( 4)2− (Al)DOC=
( )
AlA +(
Al H A( ) +)
(
)
(
) (
) (
)
OH
Al AlOH Al OH Al OH Al OH
( ) = 2++ ( )2++ ( )30+ ( )−4 (Al)F=
( )
AlF2++( ) ( ) ( ) (
AlF+2 +AlF03+ AlF4− +AlF52−) (
+ AlF63−)
( )
( ) ( ) ( ) ( )TOT SO OH F DOC
Al Al Al Al Al Al
( ) = 3+ + + + +
4 (OA)TOT=
(
H A3) (
+ H A2 −)
+( ) ( )
HA2− +A3− +( )
AlA +(
Al H A( ) +)
Charge Balance Alkalinity (eq m-3) CALK=SBC+
( )
NH+4 +SAA Soil C/N ratio C N C NOrg Org
/ =
Solution pH, pAl pH= −log10
( )
H+ pAl= −log10( )
Al3+ Soil Base Saturation BS E= Ca+EMg+ENa+EKTable 3. Parameters in the MAGIC model.
Soil Physical/Chemical Properties
Surface Water properties
D = depth (m) CEC = cation exchange capacity (eq kg-1) RT = retention time (yr)
P = porosity (fraction) C½ = sulphate adsorption half saturation (eq m-3) RA = relative area of lake/stream (fraction)
BD = bulk density (kg m-3) E
mx = sulphate adsorption Maximum (eq kg
-1) K
Al = aluminium solubility constant (log10)
SM = soil mass (D*BD) KAl = aluminium solubility constant (log10) SAl = slope of pH-pAl relationship SV = soil pore volume (D*P) SAl = slope of pH-pAl relationship
Aqueous Phase – Equilibrium Constants (log10) Organic Acid: 3 2 1 OA OA OA ,K ,K K Organic Aluminium: 5 4 OA OA ,K K
Inorganic Aluminium Speciation:
12 11 10 9 8 7 6 5 4 3 2 1 Al Al Al Al Al Al Al Al Al Al Al Al ,K ,K ,K ,K ,K ,K ,K ,K ,K ,K ,K K
Inorganic Carbon Speciation and Dissociation of water:
w CO CO CO ,K ,K ,K K 3 2 2 2 1 2
Solid Phase – Weathering and Exchange Constants
Cation Exchange Selectivity Coefficients (log10):
AlK ALNa AlMg
AlCa,S ,S ,S S
Weathering Rates (eq m-2 yr-1):
F NO Cl SO NH K Na Mg Ca,W ,W ,W ,W ,W ,W ,W ,W W 3 4 4 (can be pH dependent)
Soil Organic Matter – Nitrogen Immobilization Constants
Upper C/N Threshold (C/N above this value – 100% immobilization):
4
3 NH
NO ,CNUP
CNUP
Lower C/N Threshold (C/N below this value – 0% immobilization):
4
3 NH
NO ,CNLO CNLO
expression for equilibrium dissolution of Al trihydroxide is mathematically equivalent to the expression for cation exchange of H and Al), and twelve reactions involving formation of aqueous complexes of Al. The same reactions are assumed to occur in surface waters with the exception of cation exchange. The Al speciation reactions are represented in the model by a series of equilibrium equations (Table 1). Values of the equilibrium constants for the aqueous phase complexation reactions (Table 3) can be found in the literature. The Al solubility constants for the soils in the model are represented by aggregated values that account for both cation exchange and solution-dissolution of a solid phase. These values are not, therefore, necessarily associated with a particular crystalline form of Al(OH)3 and must be selected as part of the calibration process.
Refinement. The relationship between Al and H in surface waters has generally been modelled using a cubic relationship based on an assumed equilibrium with a solid
form of Al trihydroxide in surface waters. The cubic relationship arises from the equilibrium expression for this solubility reaction:
{Al3+}/{H+}3 = K
SO (6)
where brackets denote activities and KSO is the solubility product of the dissolution reaction. This relationship can also be expressed as a linear equation with slope of three and an intercept as:
pAl = 3pH - KAl (7)
where pAl and pH are the negative logarithms (base 10) of Al and H ion activities and KAl is the logarithm (base 10) of the solubility product for the reaction. Model estimates of changes in the concentration of Al in surface waters using this formulation, however, have shown a consistent pattern
Input Fluxes and Conditions (functions of time that must be specified)
Conditions are annual averages (monthly averages are specified for seasonal simulations)
Temperature (oC), Carbon Dioxide (atm), Organic Acid (mol m-3): TEMP P, CO2, (OA)TOT
[CO2 partial pressure and Organic Acid concentration control the weak inorganic and organic carbon buffers]
Fluxes are annual values (monthly fractions of annual fluxes are specified for seasonal simulations)
Catchment Discharge (m yr-1) and Flow Fractions: Q F, 1, F2, F3
[Flow fractions specify the pathway of water flux through the modelled system and can vary seasonally]
Atmospheric Deposition (eq m-2 yr-1): ADCa, ADMg, ADNa, ADK, ADNH4, ADSO4, ADCl, ADNO3, ADF [Deposition is specified as the product of precipitation concentrations and amount, scaled by a dry deposition factor] Sources and Sinks of Ions (eq m-2 yr-1):
Ca Mg Na K NH SO Cl NO F
SS , SS , SS , SS , SS 4, SS 4, SS , SS 3, SS
[Sources and sinks are distinct and represent processes, inputs or outputs not explicitly included in the model] Sources and Sinks of Organic Carbon and Nitrogen (mol m-2 yr-1):
IN OUT
Org Org IN OUT
C , C , ( / )C N , ( / )C N [Organic nitrogen sources and sinks are derived from the carbon sources and sinks and the specified C/N ratios]
Decomposition; Mineralization (mol m-2 yr-1): DCMP C N MIN DCMP
C N DCMP DCMP , ( / ) ( / ) =
[Nitrogen mineralization is derived from the carbon decomposition and the specified C/N ratio]
Plant Nitrogen Uptake, Nitrification and Denitrification (mol m-2 yr-1): UPNO3, UPNH4, NIT, DEN [Plant uptake is net uptake into plant biomass; separate uptake fluxes are specified for nitrate and ammonium ions]
The flow fractions determine atmospheric deposition fluxes into each soil and surface water compartment. Other fluxes and conditions must be specified separately for each model compartment (if appropriate).
Initial Values
Initial values of these state variables must be specified for each model compartment (if appropriate)
Cation and Anion Concentrations (mol m-3):
( )
2( )
2( ) ( ) ( ) ( )
( ) ( ) ( )
4 42 3
+ + + + + − − − −
Ca ,Mg ,Na ,K ,NH ,SO ,Cl ,NO ,F
Exchangeable Ions (fraction): ECa,EMg,ENa,EK Soil Organic Matter (mol m-2): COrg,NOrg
Table 4. Inputs to the MAGIC model.
of overestimating the change in Al concentration in response to experimental treatment (Sullivan et al., 1995), even when the constant KAl is estimated from observed Al data for a given site. Sullivan and Cosby (1998) examined the relationship between pH and pAl for surface waters with pH in the range 4 to 6 using observations from several different regions of the eastern United States. The slope of the relationship was consistently near two for these data, ranging from 1.82 to 2.34. These results suggest that, for
model simulation of Al concentrations, an empirically determined slope (SAl) of the pH-pAl relationship should be used along with the fitted value of KAl. The values of these constants should be based on local observations of Al dynamics in surface waters. The MAGIC7 model incorporates these suggestions and requires values for both KAl and SAl (Tables 1 and 3) for soil compartments as well as surface water compartments.
Inorganic and organic carbon in soil water and surface water; dissociation of water
Inorganic carbon (C) reactions in MAGIC7 consist of dissolution of CO2 to form carbonic acid, followed by dissociation to HCO3 and CO3. These reactions are assumed to occur both in soil solution and in surface waters in the model and can be represented by equilibrium equations (Table 1) whose “constants” are temperature dependent. Values of the equilibrium “constants” for the CO3-HCO3 system and for the dissociation of water (Table 3) and their temperature dependencies are well known and can be found in the literature.
Organic acids are the dominant form of dissolved organic material in natural waters (e.g. McKnight et al., 1985; David and Vance, 1991). Organic acids are effective H ion buffers and can form complexes with inorganic Al. Considerable evidence has accumulated suggesting that organic acids influence the response of surface waters to changes in strong acid inputs, most likely by changes in the protonation of the organic acid anions (see Wright, 1989). Organic acids were not included in the original formulation of MAGIC because specification (and calibration) of organic acid analogue models was hampered by lack of data on organic acid behaviour (e.g. Jenkins and Cosby, 1989). In 1994, Driscoll et al. (1994) compared several organic acid analogue models (mono-, di-, and triprotic organic acid analogues and the model of Oliver et al., 1983) with respect to their abilities to resolve mass balance discrepancies in measured water samples from Adirondack lakes. They concluded that organic acids were important buffers in surface waters even when dissolved organic carbon (DOC) was low. They obtained the best agreement between predicted and observed pH values using a triprotic organic acid analogue model. A triprotic organic acid analogue model can also be used to describe the complexation of Al by organic solutes (Schecher and Driscoll, 1993; Driscoll et al., 1994).
Refinement. A triprotic organic acid analogue model was incorporated into the structure of MAGIC (Tables 1 and 3). The triprotic acid undergoes three dissociation reactions:
H3A = H+ + H 2A
- (8)
H2A = H+ + HA2- (9)
HA = H+ + A3- (10)
The trivalent organic anion reacts with trivalent Al to form organic-Al complexes:
Al3+ + A3- = AlA (11)
Al3+ + H+ + A3- = Al(H)A+ (12) Sullivan et al. (1996) evaluated the importance of adding the triprotic organic acid analogue model to MAGIC by comparing MAGIC hindcast simulations (done with and without organic acids) with historical reconstructions of lake pH inferred from diatom stratigraphy in the sediments of a group of Adirondack lakes. Cosby et al. (1995) examined the improvements in model simulation of pH using data from the RAIN (see Wright et al., 1993) and HUMEX (see Gjessing, 1994a,b) experiments in Norway, where it had been demonstrated that changes in organic acid contributions to ionic concentrations were important in moderating the response of H ion to changes in acid inputs. In both the regional evaluation in the Adirondack Lakes and the site-specific evaluations in Norway, the inclusion of a triprotic organic acid in MAGIC improved significantly the ability of the model to match the observed data.
MASS AND IONIC BALANCE EQUATIONS
The model as generally applied is implemented with one or two soil layers and a surface water compartment. The soil characteristics are aggregated and assumed to be representative for the whole catchment. If two soil layers are employed, they may be arranged vertically (to represent horizons or layers within a soil profile), or horizontally to represent different soil types within a catchment (e.g. hillslope vs riparian soils). The routing of flow into or out of the two soils, however arranged, can be varied from month-to-month to simulate details of seasonal cycles in hydrology and meteorology. It is thus possible, with a relatively simple structure, to emulate complex patterns of water and mass movement within the catchment, including the accumulation and melt of snowpacks. If more spatial resolution is needed, the original catchment soil types (or soil profile) can be divided into catchments (or sub-horizons) and each sub-catchment (or sub-horizon) can be modelled separately. When the outflows of the multiple models are appropriately re-combined, the catchment outflow can be simulated.
The surface water compartment in MAGIC can be used to simulate either streams or lakes. In either case, the surface water compartment receives deposition inputs directly from the atmosphere as well as drainage from the terrestrial portion of the catchment. If lake simulation is chosen, the retention time of water within the lake must be specified. For seasonal simulations, the lake can be stratified with catchment inflows entering and lake discharge leaving the
epiliminion. As the stratification deepens, ions initially included in the hypolimnion are entrained into the epilimnion and can leave the lake. When the lake is unstratified, the entire volume of the lake is mixed with the terrestrial drainage. Sources and sinks of ions within the water column can be specified, as can a loss to the sediments due to settling or interactions of the water column with lake sediments.
Within each compartment in the model, mass balance is required for the total amounts of base cations and strong acid anions (Table 1). That is, input minus output of each mass balance ion must equal the rate of change of the total amount of that ion in each compartment of the model. Total amounts in surface water compartments are calculated from concentrations and the water volume. In soil compartments, total amounts include both dissolved amounts in the pore water and adsorbed amounts (if applicable) on the soil matrix. Process related inputs (Table 4) are by atmospheric deposition, primary mineral weathering (in soil compartments) and biological production (decomposition and mineralisation). Process related outputs are by drainage water discharges or biological removal (uptake or immobilisation). Unspecified sources and sinks of each ion are also available in the model. These may be used to simulate processes or perturbations not explicitly represented in the model (such as experimental additions of ions, losses of ions resulting from land use changes, etc.).
The long-term changes in atmospheric deposition necessary as inputs to drive the model can be derived by separate models of deposition and interception by the forest canopy such as DEPUPT (Johansson et al., 1996) and MAKEDEP (Alveteg et al., 1998).
While there is a number of ordinary differential equations in the model, not all of the variables and processes in MAGIC can be represented in a continuous state-space. As a result, the usual routines used to solve systems of coupled ordinary differential equations (e.g. Runge-Kutta, Gelerkin, Predictor/Corrector, etc.) cannot be used. Instead a numerical integration routine has been especially developed for MAGIC based on knowledge of the dynamics of the non-state-space variables. Simply stated, the model equations are solved using a finite difference framework. At each time step during model simulation, inputs and outputs are added or subtracted from each compartment, new total amounts are calculated, and the equilibrium equations are solved subject to the constraint of ionic balance (Table 1) to derive the concentrations of the state variables (Table 2) for that time step. The new concentrations in each compartment are then used with the flow routing for that time step to calculate outputs for the current time step (and thus some of the inputs for the next time step). The output
resolution of MAGIC for long-term simulation is either annual or monthly. The time steps for the numerical integration are, thus, at least annual or monthly, but may be more frequent if needed to assure numerical stability of the integration routine.
Despite the focus on annual or monthly resolution during long-term simulation, the model has a facility to simulate the water quality of storm episodes using a two-component mixing model approach. Water from atmospheric deposition and/or any (two) compartments in the model can be mixed in any ratio. The resulting episode water chemistry is determined using the same mass balance and equilibrium equations that are applied for surface waters in the model (i.e. no cation or anion exchange following mixing). It is frequently the case in acidifying or recovering catchments that storm episode chemistry is considerably more acidic than baseflow or annual average chemistry. The ability to simulate long-term changes in the episodic response of a catchment can be important for understanding patterns of acidification and recovery.
NITROGEN IMMOBILISATION EQUATIONS
Concern was expressed a decade ago about the possible adverse effects of atmospheric deposition of N compounds on soils, forests and waters. There is now evidence that some forests in Europe and North America are becoming N saturated, leading to enhanced NO3 leaching in drainage waters (e.g. Emmett et al., 1993; Stoddard, 1994; Dise and Wright, 1995). Recent Experimental results from the NITREX Project (Wright and van Breemen, 1995; Gundersen et al., 1998; Emmett et al., 1998) have provided insights into the controls on N cycling and have enabled the development of empirical models that relate N retention to the C and N characteristics of soil organic matter. It is important to incorporate this new process level understanding into dynamic models of acidification responses.
There were no process-based mechanisms for N retention in soils in the original version of MAGIC. Ferrier et al. (1995) and Jenkins et al. (1997) modified MAGIC to produce a new coupled S and N model (MAGIC-WAND) to address concerns over the interaction of S and N deposition on soil and surface water acidification. The model used many of the same processes included in MAGIC7 but did not introduce an internal pool of stored N in the soil compartments. All of the N processes in MAGIC-WAND were rate-based and there was no internal state variable that could change the rates as N accumulated in the simulated systems (no feedback). Cosby et al. (1997) and Emmett et al. (1997) constructed a model (MERLIN) to deal explicitly
with N dynamics in soils. The MERLIN model was based on both rates and internal pools and proved more capable of simulating N dynamics. MERLIN, however, did not simulate the acid-base processes. The new N dynamics included in MAGIC7 are based conceptually on the empirical model described by Gundersen et al. (1998) (see also Tietema and Beier, 1995; Emmett et al., 1995). The mathematical formulation and process representations of the N dynamics derive from a simplification of the structure of the MERLIN model. The remainder of the acid-base dynamics are derived from MAGIC as refined above.
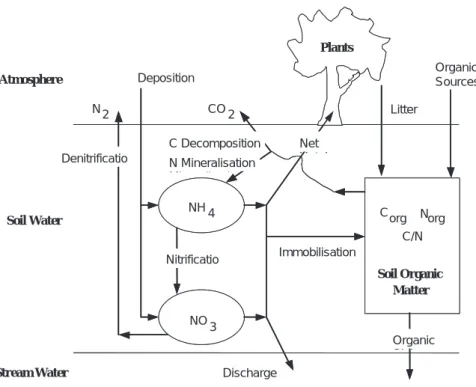
New Processes. MAGIC7 simulates two species of inorganic N in soil and surface waters: NO3 and NH4. Major processes affecting these ions in soils have been incorporated explicitly or implicitly into the model: atmospheric deposition, nitrification, denitrification, mineralisation, uptake by plants, litter production, decomposition, immobilisation into soil organic matter, and export in discharge water (Fig. 3). Provision is made in the model for additions of NO3 or NH4 by processes not explicitly represented in the model (i.e. separate source and sink terms for simulation of fertilisation, etc.). The inclusion of dynamic equations for N cycling within the model required the introduction of a soil organic matter pool for each soil compartment being simulated. As with the acid/base components of MAGIC, the organic matter pool is aggregated in space and time. The intention, however, is
that this compartment be observable and/or interpretable at the plot or catchment scale. The N and C contents of this organic matter pool are state variables (Table 2) simulated by the model in response to changing inputs or conditions in the soil solution.
Atmospheric deposition of NO3 and NH4, and denitrification rates must be specified as inputs to the model. Nitrification (conversion of NH4 to NO3) is modelled as a first-order process and a rate constant must be provided. Plant uptake and litter production must be specified as inputs. The important aspect of the plant N-cycle with respect to acidification and recovery, however, is the long-term net uptake of N species and the model can be implemented using a net uptake term and setting the litter term to zero. The net uptake term represents net storage of N by the plants (primarily the N stored in wood and large roots). Mineralisation in the model represents the net release of N bound in organic matter. The mineralisation product is NH4. Mineralisation rates depend on C decomposition rates (Table 4) and the C/N ratio of the organic matter pool.
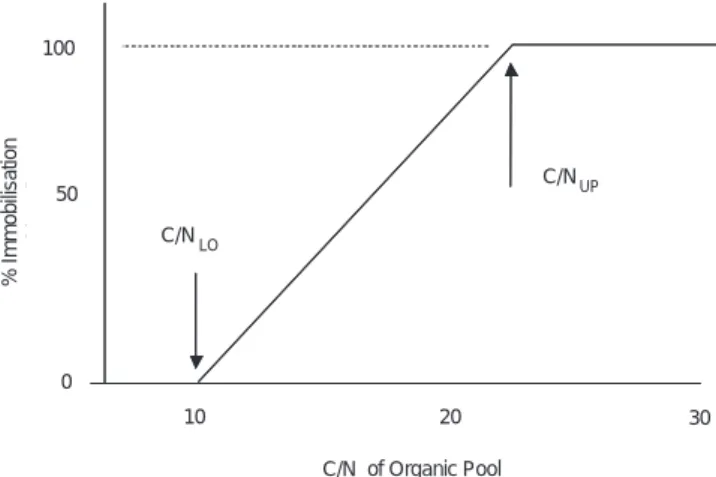
Immobilisation of inorganic N into the soil organic matter is controlled by the C/N ratio of the soil organic compartment (Table 1; Fig. 4). If the C/N ratio is above an upper threshold value (CNUP) immobilisation of inorganic N is complete. If the C/N ratio is below a lower threshold value (CNLO) there is no immobilisation of inorganic N. The percentage of inorganic N immobilised varies linearly from 100% to 0%
NH4 Nitrificatio Denitrificatio NO 3 Deposition N Mi li i C Decomposition N2 CO2 Immobilizatio Discharge Atmosphere Soil Water Stream Water Soil Organic Matter Plants Net U t k Corg Norg C/N Organic Si k Organic Sources Litter NH4 Nitrificatio Denitrificatio NO 3 Deposition N Mineralisation C Decomposition N2 CO2 Immobilisation Discharge Atmosphere Soil Water Stream Water Soil Organic Matter Plants Net U t k Corg Norg C/N Organic Si k Organic Sources Litter
Fig. 3. Schematic illustration of the pools and fluxes included in MAGIC7 for use in simulating
as the C/N ratio of the organic matter declines from CNUP to CNLO during the simulation. This empirically-based method for estimating immobilisation rates requires that the upper and lower threshold C/N values be calibrated for each site. Separate upper and lower thresholds for NO3 and NH4 are included (Table 3) to allow for preferential immobilisation of one ion over the other. The inorganic N immobilised from soil solution is added to the organic N in the organic pool, lowering the C/N ratio of that pool. In this manner there is a decline in the C/N ratio of the simulated soil organic pool as N from deposition is accumulated. As the declining C/N crosses the upper threshold, leaching of inorganic N begins and gradually increases as C/N declines further.
The equations affecting N are processed sequentially at each time step. Ammonium and NO3 from deposition and NH4 from mineralisation are added to the soil solution. The current nitrification rate is then calculated and NH4 is removed (and NO3 added) to the soil solution. Next, the net uptake requirement of the plants is satisfied by removing inorganic N from soil solution (NH4 is removed first, followed by NO3). If the available inorganic N concentration in soil solution is not sufficient to satisfy the plant requirement, the additional N needed may be removed from the soil organic matter pool. If inorganic N remains in soil solution following the plant uptake, immobilisation into the soil organic matter pool is calculated and the appropriate amounts of NO3 and NH4 are removed from soil solution. Finally, after all biotic demands for inorganic N are satisfied, any NO3 or NH4 remaining in the soil solution is leached from the soil with the soil water drainage.
Time series of inputs and outputs of organic C (and the C/N ratios of that organic matter) are required as inputs to the model (Fig. 3; Table 4). Initial values of both C and N in the organic matter pool are also needed. If the organic inputs and outputs are set to zero for all time in the simulation, the organic C content of the organic matter pool will not change. The N content will, however, vary during simulation as immobilisation and/or mineralisation occurs. In order for this aggregated representation of the N cycle to function properly in the model, the characteristics of the soil organic matter pool must be properly identified. Generally, the lumped organic matter pool can be taken to represent the forest floor and upper organic soil horizons of a catchment and the C content of these layers can be measured or estimated for use in the model. If only one soil compartment is included in a model application, however, the simulated C pool represents the entire organic matter content of the soil column that is actively involved in N storage.
This highly aggregated approach to modelling N retention/ release in soils is analogous to the approach used in MAGIC for modelling base cation exchange in soils. The overall catchment budgets of both types of ions (inorganic N and base cations) are important for simulating acidification responses. The base cation dynamics are controlled by a capacity factor (the total cation exchange capacity of the soils) and by an intensity factor (current base saturation or fraction of the total exchange capacity occupied by base cations). Both factors are crucial in determining the future (or past) responses of catchment soils to acidic deposition. The intensity factor determines the cation exchange and buffering that can occur at any time (low base saturation provides little base cation exchange, etc). The capacity factor determines the length of time it takes for the intensity factor to change (number of years of leaching to produce lower base saturation).
The aggregated organic matter pool functions similarly for N retention in that there are both capacity and intensity factors in the conceptual formulation. The intensity factor is the C/N ratio of the organic matter pool at any time (retention is complete for high C/N values, etc). Retention of N, however, results in a lower C/N of the organic matter and as C/N declines, N saturation can begin to occur. The quickness with which C/N changes is controlled by the capacity factor (the total pool of organic C available to immobilise N in the soils). The scales of aggregation and conceptual interpretation are essentially the same in MAGIC7 for the capacity and intensity factors of both the base cation exchange processes and N retention processes. If this simplified structure for N dynamics can reproduce adequately observed soil and surface water chemistry and
C/NUP C/N LO C/N of Organic Pool 30 20 10 % Im mo bili zat ion 0 50 100 C/NUP C/N LO C/N of Organic Pool 30 20 10 % Im m o b ilis a tio n 0 50 100
Fig. 4. Immobilisation of inorganic N (both NO3 and NH4) is a function of the C/N ratio of the soil organic pool. Immobilisation is 100% of input N whenever the C/N ratio is above the upper threshold (C/NUP), and is 0% when the C/N ratio is below the lower
changes in that chemistry in response to experimental manipulations, then MAGIC7 has clear advantages for both site specific and regional applications as a model of acidification responses to coupled S and N deposition. A first application to several experimentally manipulated catchments (Wright et al., 1998; Jenkins et al., 2001; Jenkins and Cullen, 2001) suggests that MAGIC7 will continue to function as a robust and reliable tool for both scientific and assessment activities.
Discussion
MAGIC is one of several widely-used models of soil and water acidification. Others such as SMART (Posch et al., 1993) and SAFE (Warfvinge et al., 1993) are in many respects similar; model comparisons show strengths and weaknesses of various models (Warfvinge et al., 1992; Tiktak and van Grinsven, 1995). Uncertainties from data aggregation, parameter inputs and model structure have also been addressed (Barkman and Alveteg, 2001; Larssen et al., 2000).
Simulation models of catchment hydrobiogeochemistry are useful tools for projecting the potential future response of terrestrial and aquatic resources to assumed or anticipated ecosystem perturbations (such as changes in land use, atmospheric deposition, climate, etc). Such projections are commonly used to integrate or synthesise scientific understanding of the dynamics of natural ecosystems. Such projections are also often used as the basis or justification for public policy and legislation concerning management of natural resources. A continuing concern in using models either to summarise our current knowledge or to assist in making policy decisions is the level of confidence that can be placed in the model projections. While “verification” or “validation” of a mathematical model of a natural system is problematic (in essence because natural systems are never closed, model results are non-unique, and “truth” cannot be proved absolutely; see the discussion by Oreskes et al., 1994), model “confirmation” is possible. That is, as a model is repeatedly tested against observation and/or experiment and found to produce satisfactory results, confidence in the model increases and the continued use of the model for either scientific or managerial activities is supported.
The model confirmation process is, however, seldom successful at every step. As new or more extensive data become available, one or more aspects of the original model structure may be found wanting even as the overall performance of the model continues to be adequate. It is then appropriate to refine the model to include or improve the simulation of the missing or misrepresented phenomena.
In the case of failure of the model when applied to a novel situation, the whole mathematical structure (and conceptual basis) of the model may be called into question. Most models of natural systems, however, are formulated only after extensive observation and experience with the system in question (i.e. few natural system models are built from “first principles”) and/or must be calibrated using empirical observations of the dynamics of the system (i.e. few natural system processes can be described by “universal constants”). As a result, most mathematical models are sufficiently well-constrained by the behaviour of the real system they represent that structural failures are rare and usually occur early in the model development.
Robust and reliable natural system models thus emerge from a confirmation process that is cyclic and progressive and that resembles the paradigm of the scientific method. A model structure is developed based on observed behaviour of a natural system. The model is tested against further (new) observations. If differences between simulated and observed behaviour are acceptable, the model is judged adequate and left unchanged. If the differences are unacceptable, the model structure is refined to improve its performance. In either case, confidence in the model is increased which leads to more applications which lead to further refinement and/ or confirmation. Models that successfully pass through several iterations of this procedure become the workhorses of scientific and managerial applications. The demise of such a model usually occurs not because of an inherent and suddenly discovered flaw. Rather such models pass out of favour because new technology or algorithms make possible more detailed and/or explicit models or the questions the model was designed to address no longer have scientific or policy relevance.
MAGIC is designed to operate at the catchment (or lake and catchment) scale. Thus many of the necessary input parameters required represent catchment-aggregated values. Derivation of these from measurements at one or more points within the catchment is an important step in the modelling process and is often relatively time consuming. The process does in part, however, provide a quantitative check by the model on the consistency of the data.
The refinements of assumptions in MAGIC7 regarding Al solubility and organic acids and the inclusion of an episodic response algorithm have resulted in improved performance of the model in simulating surface water pH and Al concentrations. While these changes were warranted based on observations and have been successfully tested in a number of applications, they do not represent fundamental changes in the structure of MAGIC (they do not affect ANC or soil base saturation, the fundamental acidification response variables in MAGIC) nor do they require
observations of new variables in order to be implemented. The inclusion of the new N dynamics, however, does represent a basic conceptual modification of the original MAGIC model. Two new state variables were introduced (soil organic C and soil organic N) and observations of these variables will be needed to constrain and calibrate model simulations. The new processes directly control both NH4 and NO3 ions in soil solution (directly affecting ANC and soil base saturation) and, thus, can have significant effects on both long-term and short-term simulation of acidification responses.
Given the magnitude of N deposition in many parts of the world and the potential effects of N leakage from catchment soils, the ability to simulate N dynamics of catchments correctly is becoming a prerequisite for models of surface water responses to atmospheric deposition. The conceptual structure of N dynamics in MAGIC7 is based on extensive observation and experimentation. The first applications of MAGIC7 to utilise the N dynamics (Wright et al., 1998; Jenkins et al., 2001) shows the approach to be consistent with the behaviour of natural systems. These are good first steps in the confirmation process, the same as were taken with the original MAGIC formulation over fifteen years ago. Over the next few years, as MAGIC7 is used to simulate responses to N deposition, as more observations of N dynamics are reported and as experimental or observational tests of the refined model are devised, the new conceptual construct included in MAGIC7 will be thoroughly tested.
Conclusions
The MAGIC model of acidification has been subjected extensively to testing and confirmation over a 15 year period and to many applications (see references cited here and in Appendix I). MAGIC has been used in scientific studies, as a tool in establishing management practices and as an aid in making policy decisions regarding controls on emissions. Overall the model has proven to be robust, reliable and useful in all of these activities. The longevity and utility of MAGIC results as much from the philosophical approach to its formulation (empirically-based, compatible with readily available data, technically easy to implement and capable of being tested), as from the soundness of the hydro-bio-geochemical concepts and understanding on which the model is based. The refinements described here, and the expansion of the conceptual basis to include N dynamics in soils, enhance the utility of the model. The success of this conceptual approach in the qualitative and quantitative description of acidification responses of ecosystems suggests that it is also an appropriate tool for also examining the recovery responses.
Acknowledgements
We thank our colleagues who have used MAGIC and have provided stimulating discussion, insightful comments and useful suggestions. We are gratified that the model has proven to be so durable and useful. We are even more pleased by the many friendships and rewarding professional relationships that have arisen because of the model.
References
Alveteg, M., Walse, C. and Warfvinge, P., 1998. Reconstructing historic atmospheric deposition and nutrient uptake from present day values using MAKEDEP. Water Air Soil Pollut., 104, 269– 283.
Barkman, A. and Alveteg, M., 2001. Identifying potentials for reducing uncertainty in critical load calculations using the PROFILE model. Water Air Soil Pollut., 125, 33–54. Booty, W.G. and Kramer, J.R., 1984. Sensitivity analysis of a
watershed acidification model. Phil. Trans. Roy. Soc. London,
B305, 441–449.
Christophersen, N. and Wright, R.F., 1981. A model for streamwater chemistry at Birkenes, Norway. Water Resour. Res.,
17, 377–389.
Christophersen, N., Seip, H.M. and Wright, R.F., 1982. A model for streamwater chemistry at Birkenes, Norway. Water Resour.
Res., 18, 977–997.
Cosby, B.J., 1998. Modelling the Biological Effects of Water Quality Changes in the streams of the FISH Catchments. In:
Final Report of the FISH (Fish In Sensitive Habitats) Project -An Integrated Assessment of Fish Community Responses to Stream Acidification in Shenandoah National Park, VA, A.J.
Bulger, (Ed.). University of Virginia.
Cosby, B.J., Wright, R.F., Hornberger, G.M. and Galloway, J.N., 1984. Model of acidification of groundwater in catchments. Project completion report, Proj. E2-14, EPA/NCSU Acid Precipitation Program, Environ. Prot. Agency, N.C. State Univ., October 1984.
Cosby, B.J., Wright, R.F., Hornberger, G.M. and Galloway, J.N., 1985a. Modelling the effects of acid deposition: assessment of a lumped parameter model of soil water and streamwater chemistry. Water Resour. Res., 21, 51–63.
Cosby, B.J., Wright, R.F., Hornberger, G.M. and Galloway, J.N., 1985b. Modelling the effects of acid deposition: estimation of long-term water quality responses in a small forested catchment.
Water Resour. Res., 21, 1591–1601.
Cosby, B.J., Hornberger, G.M., Galloway, J.N. and Wright, R.F., 1985c. Time scales of catchment acidification: a quantitative model for estimating freshwater acidification. Environ. Sci.
Technol., 19, 1144–1149.
Cosby, B.J., Hornberger, G.M., Wright, R.F. and Galloway, J.N., 1986. Modeling the effects of acid deposition: Control of long-term sulfate dynamics by soil sulphate adsorption. Water Resour.
Res., 22, 1283–1302.
Cosby, B.J., Wright, R.F. and Gjessing, E., 1995. An acidification model (MAGIC) with organic acids evaluated using whole-catchment manipulations in Norway. J. Hydrol., 170, 101–122. Cosby, B.J., Ferrier, R.C., Jenkins, A., Emmett, B.A., Wright, R.F. and Tietema, A., 1997. Modelling the ecosystem effects of nitrogen deposition at the catchment scale: model of ecosystem retention and loss of inorganic nitrogen (MERLIN). Hydrol.