HAL Id: hal-00316909
https://hal.archives-ouvertes.fr/hal-00316909
Submitted on 1 Jan 2001
HAL is a multi-disciplinary open access
archive for the deposit and dissemination of
sci-entific research documents, whether they are
pub-lished or not. The documents may come from
teaching and research institutions in France or
abroad, or from public or private research centers.
L’archive ouverte pluridisciplinaire HAL, est
destinée au dépôt et à la diffusion de documents
scientifiques de niveau recherche, publiés ou non,
émanant des établissements d’enseignement et de
recherche français ou étrangers, des laboratoires
publics ou privés.
IntroductionThe Cluster mission
C. P. Escoubet, M. Fehringer, M. Goldstein
To cite this version:
C. P. Escoubet, M. Fehringer, M. Goldstein. IntroductionThe Cluster mission. Annales Geophysicae,
European Geosciences Union, 2001, 19 (10/12), pp.1197-1200. �hal-00316909�
Geophysicae
Introduction
The Cluster mission
C. P. Escoubet1, M. Fehringer1, and M. Goldstein2
1ESA/ESTEC, SCI-SO, Keplerlaan 1, 2200 AG Noordwijk, The Netherlands 2NASA GSFC, Code 692, Greenbelt, MD 20771, USA
Abstract. The Cluster mission, ESA’s first cornerstone project, together with the SOHO mission, dating back to the first proposals in 1982, was finally launched in the summer of 2000. On 16 July and 9 August, respectively, two Russian Soyuz rockets blasted off from the Russian cosmodrome in Baikonour to deliver two Cluster spacecraft, each into their proper orbit. By the end of August 2000, the four Clus-ter satellites had reached their final tetrahedral constellation. The commissioning of 44 instruments, both individually and as an ensemble of complementary tools, was completed five months later to ensure the optimal use of their combined ob-servational potential. On 1 February 2001, the mission was declared operational.
The main goal of the Cluster mission is to study the small-scale plasma structures in three dimensions in key plasma regions, such as the solar wind, bow shock, magnetopause, polar cusps, magnetotail and the auroral zones. With its unique capabilities of three-dimensional spatial resolution, Cluster plays a major role in the International Solar Terres-trial Program (ISTP), where Cluster and the Solar and He-liospheric Observatory (SOHO) are the European contribu-tions. Cluster’s payload consists of state-of-the-art plasma instrumentation to measure electric and magnetic fields from the quasi-static up to high frequencies, and electron and ion distribution functions from energies of nearly 0 eV to a few MeV. The science operations are coordinated by the Joint Science Operations Centre (JSOC), at the Rutherford Ap-pleton Laboratory (UK), and implemented by the European Space Operations Centre (ESOC), in Darmstadt, Germany. A network of eight national data centres has been set up for raw data processing, for the production of physical param-eters, and their distribution to end users all over the world. The latest information on the Cluster mission can be found at http://sci.esa.int/cluster/.
1 Introduction
Both common sense and mathematical models tell us that plasma structures, by nature, are three-dimensional, and that nature does not have a preference of one dimension over another. Yet the complex matter of studying our Earth’s
outer environment has generally been restricted to obtaining only one-dimensional views by collecting data simultane-ously from one, or at best, two spacecraft in the same region. Common efforts of the major space agencies to coordinate the scientific operations of their satellites have greatly en-hanced our understanding of the global behaviour of the mag-netosphere. However, investigations on small- and medium-scale structures, from about 100 km to 2–3 earth radii, are required to make an additional large step towards a complete understanding of our planet’s magnetosphere. The only se-rious possibility that exists to achieve this step is a Cluster-type mission, capable of multi-point measurements with high time resolution and identical state-of-the-art instrumentation on all of the satellites. After the launch failure of Ariane 5 and the destruction of the Cluster I satellites, a rescue mis-sion, consisting of only one Cluster satellite with the spare instruments, was considered. It was these arguments, how-ever, that convinced ESA’s Science Program Committee to agree to a complete rebuild of the entire mission. This deci-sion was taken on 3 April 1997.
Regarding the scientific objectives, Cluster II, as it was called in its early stages, is identical to the original mission. A major change was the result of the cost saving measure to operate the mission with only one ground station. This was archived by doubling the onboard data storage capacity and completely reworking the mission planning system. Further minor changes were required due to the nonavailability of some electronic components that were no longer available. The following sections will present Cluster’s scientific ob-jectives, give a brief description of its instrumentation, and describe the way in which the science operations are planned and conducted. Finally, the Cluster Science Data System will be described.
2 Scientific objectives
The Cluster mission is designed to study the small-scale structures and macroscopic turbulence in three dimensions that arise in many places in the magnetosphere. These re-gions are predominantly:
1198 C. P. Escoubet et al.: The Cluster mission
-20
-10
0
10
20
X
GSE(R
E)
-20
-10
0
10
20
Y
GSE(R
E)
Bow Shock Magnetopause Feb. Aug. May Nov.Fig. 1. Orbits of the Cluster spacecraft projected onto the equatorial
plane. The orbits are shown at three-month intervals, starting with the 2nd launch in August 2000.
– the magnetopause, – the polar cusps, – the magnetotail, and – the auroral zones.
These scientific objectives are achieved by the placement of the four identical spacecraft in a polar orbit of 4 × 19.6 Earth radii. The plane of the orbit is fixed with respect to inertial space. The Earth, together with its magnetosphere therefore sweeps through this plane, allowing for a complete 360◦scan of the magnetosphere every year (Fig. 1). A per-fect tetrahedron is the constellation best suited to study the three-dimensional plasma structures and to derive vectorial quantities (Dunlop et al., 1990; Robert et al., 1994; Coeur-Joly et al., 1994; Mottez and Chanteur, 1994; Paschmann and Daly, 1998). However, orbital dynamics does not allow one to maintain a fixed constellation throughout a complete orbit. As particular regions are visited in the course of the mission, the constellation will be optimised accordingly. In February, for example, when Cluster crossed the polar cusps, the tetrahedron was optimised to be perfectly situated over the northern and southern cusps (Fig. 2a). It was still close to a tetrahedron along most parts of the orbit in the solar wind and the magnetosheath. Around perigee, however, the space-craft followed each other on the same trajectory, like a string of pearls, which allowed for the study of temporal variations in the auroral zone. In August, when the Cluster orbit in-tersected the magnetotail, the perfect tetrahedron moved to the neutral sheet near the apogee (Fig. 2b), and the string of pearls was then positioned in the mid-altitude cusp. Com-plex constellation maneuvers had to be carried out in order to change both the separation distances and the shape of the
Table 1. The Cluster spacecraft separation strategy
Phase Primary target Separation Comment
1 cusp 600 km Achieved in Feb 2001 2 tail 2000 km Achieved in August 2001
3 cusp 100 km Feb 2002
4 tail 1–3 RE August 2002, target value to be specified once fuel reserves are known
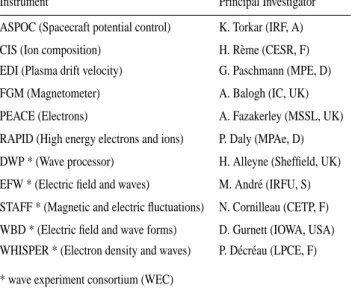
Table 2. The eleven Cluster instruments and their Principal
Investi-gators
Instrument Principal Investigator
ASPOC (Spacecraft potential control) K. Torkar (IRF, A) CIS (Ion composition) H. R`eme (CESR, F) EDI (Plasma drift velocity) G. Paschmann (MPE, D) FGM (Magnetometer) A. Balogh (IC, UK) PEACE (Electrons) A. Fazakerley (MSSL, UK) RAPID (High energy electrons and ions) P. Daly (MPAe, D) DWP * (Wave processor) H. Alleyne (Sheffield, UK) EFW * (Electric field and waves) M. Andr´e (IRFU, S) STAFF * (Magnetic and electric fluctuations) N. Cornilleau (CETP, F) WBD * (Electric field and wave forms) D. Gurnett (IOWA, USA) WHISPER * (Electron density and waves) P. D´ecr´eau (LPCE, F)
* wave experiment consortium (WEC)
constellation. During the maneuver periods, scientific opera-tions had to be reduced, but were not completely suspended. There is the intension to vary the inter-spacecraft distance between 100 km and 18 000 km throughout the mission phase and to revisit the same regions of interest with different spacecraft separations (Table 1). These distances will be cho-sen according to the experience gained during the first year of the mission. Furthermore, the final decisions will depend strongly on the available fuel and on other considerations re-lated to an extension of the mission. During the first cusp crossings in early March 2001, and the subsequent tail cross-ings six months later the separation distances of 600 km and 2000 km, respectively, have been chosen. During the next cusp crossings in 2002, the inter-spacecraft distance will be reduced to only 100 km, an unprecedented challenge for mis-sion operators.
3 Instrumentation
Each Cluster satellite carries the same set of eleven instru-ments that allow for the measurement of electric and mag-netic fields from DC to high frequencies, and the detection of electron and ion distribution functions at spin resolution.
-30
-20
-10
0
10
20
X
GSE(R
E)
-20
-10
0
10
20
Z
GSE(R
E)
Bow Shock Magnetopause-30
-20
-10
0
10
20
X
GSE(R
E)
-20
-10
0
10
20
Z
GSE(R
E)
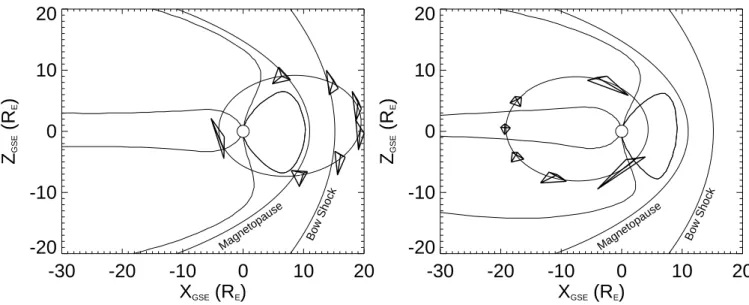
Bow Shock MagnetopauseFig. 2. Cluster orbits during polar cusp crossings (a) and tail crossings (b). The orbit and spacecraft constellation are shown in red, the
inter-spacecraft separation has been enlarged by a factor of 30 for the cusp and by a factor 5 for the tail. The size of the perfect tetrahedron in the cusp is 600 km and in the tail, 2000 km.
The individual instruments and their respective Principal In-vestigators (PI) are listed in Table 2. A detailed description of the Cluster payload can be found in this issue and in Es-coubet et al. (1997). The position of the eleven instruments on the spacecraft is shown on Fig. 3.
4 Mission operations
Two centres are responsible for the day-to-day operations of the Cluster mission. The Joint Science Operations Centre (JSOC), located at the Rutherford Appleton Laboratory in the UK, is in charge of the scientific planning and command-ing (for details, see Hapgood et al., 1997). In close coop-eration with the Science Working Team (SWT) and the Sci-ence Operation Working Group (SOWG), JSOC worked out a Master Science Plan. This is a top-level schedule used to determine the times when all of the instruments are simulta-neously acquiring science data. In addition, it shows whether the instruments are operating in a low or high data rate mode. Based on this Master Science Plan, JSOC then establishes an instrument command schedule which has to be approved by the PIs. Merging together all of the inputs from the eleven experimenter teams and checking for the scientific and tech-nical constraints finally yields the so-called OBRQ (OBser-vational ReQuest file) that is then passed on to ESOC. This OBRQ contains the commands for the 44 instruments cov-ering a one week period of operations. Apart from mission planning and commanding, JSOC also monitors the instru-ment’s health and performance. It further disseminates aux-iliary data on the mission, such as orbital data and scientific event catalogues.
ESOC is the second control centre involved and it is re-sponsible for the ground segment and mission operation commands (for details, see Ferri and Warhaut, 1997). ESOC
is repsonsible for deploying the spacecraft into their initial orbit, keeping them operational and performing all altitude and constellation maneuvers. On the scientific side, ESOC checks and uploads the OBRQs received from JSOC and takes care of downloading the scientific data after acquisi-tion and then distributes the data to all PI and CoI institutes. The raw data are distributed on CDs, between 1 and 2 per days, to the 64 PI/CoI institutes involved in the data analysis. ESOC also monitors the health and safety of the instruments.
5 Cluster II Science Data System
The Cluster II Science Data System (CSDS) has been set up to facilitate the processing of the raw data into physically meaningful parameters and the distribution to the scientific users. It is based on nine Data Centres (DC) located all over Europe, USA and China (Fig. 4). Early in the definition phase of the mission, the distributed system was adopted to guarantee fast access to all scientific users and to keep the processing centre close to the instrument expertise. There-fore, each DC is in charge of the processing of the data, on behalf of one or more PIs, from a particular instrument. After processing, the data are validated by the PI team and then distributed to the other DCs. All nine DCs have the full database with all of the instrument parameters, which are made available to the scientific community through the Web (http://sci2.estec.esa.nl/cluster/csds/csds.html). The follow-ing products are offered:
1. Quicklook plots (CSDSWeb): The latest data from one spacecraft, including particle and wave spectrograms, as gif files. These data are available to the general public. 2. Summary Parameter Data Base (SPDB): one-min
1200 C. P. Escoubet et al.: The Cluster mission
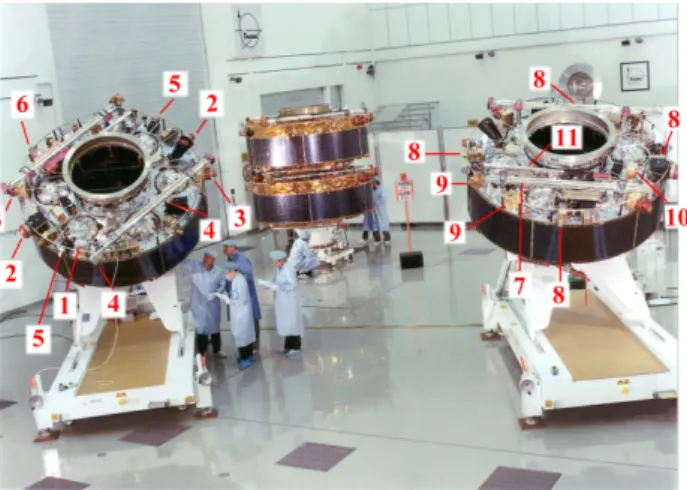
Fig. 3. Position of the 11 instruments on the spacecraft. ASPOC
(1), CIS (2), EDI (3), FGM (4), PEACE (5), RAPID (6), DWP (7), EFW (8), STAFF (9), WBD (10), WHISPER (11)
spacecraft position, separation distances, and spin axis orientations. These data are also available to the general public.
3. Summary Parameter Plots (SPPLOTS): plots of a subset of the Summary Parameters, one-min resolution, 6 h per page, 4 pages for all of the parameters; i.e. 16 pages per day. These data are also available to the general public. 4. Prime Parameter Data Base (PPDB): parameters from all four spacecraft averaged over one spin period (4 s). These data are restricted to the Cluster Pis and CoIs.
Acknowledgements. The authors thank R. M. Bonnet who made the rebirth of Cluster possible; J. Credland who was always support-ive of the Cluster mission, R. Schmidt without whom the Cluster mission would not have been a success, and K. P. Wenzel who sup-ported the Cluster mission and the rebuilds of Cluster instruments. Special acknowledgements go to J. Ellwood, A. Gianolio, and their team who made the Cluster II project and the Soyuz launch a re-ality; and G. Lehn and R. Nord and their team who built the Clus-ter spacecraft like jewels. K. Sizemore (NASA) for his support of Cluster I and, most particularly, D. Machi (NASA) for his support and ingenuity in assuring the delivery of the NASA contributions to Cluster II. Special thanks also go to the Principal Investigator teams who manufactured the Cluster instruments like jewels: H. Alleyne, A. Balogh, N. Cornilleau-Wehrlin, P. Daly, P. D´ecr´eau, A. Fazakerley, D. Gurnett, G. Gustafsson, H. R`eme, W. Riedler, B. Wilken, L. Ahlen, C. Aoustin, C. Carr, P. Carter, B. de la Porte, W. Guttler, R. Huff, P.-A. Linqvist, A. Meyer, J. Quinn, F. Mozer, M. Acu˜na, T. Fritz, D. Winningham, G. Parks, H.-C. Seran, K. Torkar, H. Vaith, K. Yearby. We thank M. Warhaut and S. Matussi and their
Fig. 4. Schematic diagram of the Cluster Science Data System. The
US and the Chinese data centres interface only with the UK and Austrian DCs, respectively.
team for their dedication in building the ground segment and now in operating the four spacecraft, and T. Dimbylow and M. Hapgood and their team who are co-ordinating the science operations while always looking at maximising the science return. Finally, special thanks go to the Cluster Science Data System working group mem-bers who were very inventive in building a simple and efficient tool to distribute the Cluster data to all scientists in the World.
References
Coeur-Joly, O., Robert, P., Chanteur, G., and Roux, A.: ‘Simulated daily summaries of Cluster four-point magnetic field measure-ments’, in Cluster workshop on Physical Measurements and Mis-sion Oriented Theory, ESA SP-371, 223, 1994.
Dunlop, M. W., Balogh, A., Southwood, D. J., Elphic, R. C., Glass-meier, K. H., and Neubauer, F. M.: ‘Configurational sensitivity of multipoint magnetic field measurements’, ESA SP-306, 23, 1990.
Escoubet, C. P., Russell, C. T., and Schmidt, R.: (Eds) ‘The Cluster and Phoenix missions’, Space Science Rev., 79, 1–2, 1997. Ferri, P. and Warhaut, M.: ‘Cluster Mission Operations, Space
Sci-ence Rev., 79, 1–2, 475, 1997.
Hapgood, M. A., et al.: ‘The Joint Science Operations Centre’, Space Science Rev., 79, 1–2, 487, 1997.
Mottez, F. and Chanteur, G.: ‘Surface crossing by a group of satel-lites: a theoretical study’, J. Geophys. Res., 99, 13 499, 1994. Paschmann, G. and Daly, P. W.: (Eds) Analysis Methods for
Multi-Spacecraft Data, ISSI Scientific Report SR-001, 1998.
Robert, P., Roux, A., and Coeur-Joly, O.: ‘Validity of the estimate of the current density along Cluster orbit with simulated mag-netic data’, in Cluster workshop on Physical Measurements and Mission Oriented Theory, ESA SP-371, 229, 1994.