DUCTILE FRACTURE OF 13% CR-4% NI MARTENSITIC STAINLESS STEELS USED IN HYDRAULIC TURBINE WELDED RUNNERS
FAYAZ FOROOZMEHR
DÉPARTEMENT DE GÉNIE MÉCANIQUE ÉCOLE POLYTECHNIQUE DE MONTRÉAL
MÉMOIRE PRÉSENTÉ EN VUE DE L’OBTENTION DU DIPLÔME DE MAÎTRISE ÈS SCIENCES APPLIQUÉES
(GÉNIE MÉTALLURGIQUE) FÉVRIER 2017
UNIVERSITÉ DE MONTRÉAL
ÉCOLE POLYTECHNIQUE DE MONTRÉAL
Ce mémoire intitulé :
DUCTILE FRACTURE OF 13% CR-4% NI MARTENSITIC STAINLESS STEELS USED IN HYDRAULIC TURBINE WELDED RUNNERS
présenté par : FOROOZMEHR Fayaz
en vue de l’obtention du diplôme de : Maîtrise ès sciences appliquées a été dûment accepté par le jury d’examen constitué de :
Mme BROCHU Myriam, Ph. D., présidente
M. VERREMAN Yves, Ph. D., membre et directeur de recherche M. THIBAULT Denis, Ph. D., membre et codirecteur de recherche M. BOCHER Philippe, Ph. D., membre et codirecteur de recherche M. CHEN Jianqiang, Ph. D., membre
DÉDICACE
REMERCIEMENTS
En premier lieu, je dois remercier mon directeur de recherche, Prof. Yves Verreman, qui m’a fait confiance et m’a accepté au sein de son groupe de recherche. Je le remercie encore pour sa bienveillance, sa générosité, ses encouragements, ses conseils très précieux, et en un mot sa direction globale de la thèse. Je salue ici Dr. Jianqiang Chen qui m’a beaucoup aidé à réaliser mes essais mécaniques, surtout à mettre au point de l’essai JIc, et à dépouiller les données brutes. Sans
lui, j’aurais perdu beaucoup de temps à réaliser mon premier essai JIc.
Je tiens à remercier mes codirecteurs, Prof. Philippe Bocher de l’École de la Technologie Supérieur (ÉTS) et Dr. Denis Thibault de l’Institut de Recherche d’Hydro-Québec (IREQ), pour les conseils métallurgiques très précieux et l’aide à interpréter les résultats fractographiques. Je remercie Prof. Myriam Brochu de l’École Polytechnique de Montréal, pour sa coopération, sa gentillesse, et ses conseils très importants.
Je tiens à remercier Michel Sabourin et Benoît Papillon d’Alstom-Hydro, pour leur soutien technique et nous faire parvenir les informations importantes du côté pratique.
Je remercie Josée Laviolette, technicienne à l’École Polytechnique de Montréal, Étienne Dallaire, Manon Provencher, Marie-Andrée Ayotte, Alexandre Lapointe, et Carlo Baillargeon techniciens à l’IREQ, pour leurs soutiens techniques. Je salue ici Mathieu Paquin pour la fabrication de mon bloc de métal d’apport d’une qualité exceptionnelle.
Je remercie aussi Dr. Jacques Lanteigne de l’IREQ, pour nous faire parvenir ses expériences techniques et métallurgiques, surtout à propos de l’essai JIc.
Le soutien financier apporté par CRSNG, Hydro-Québec et Alstom-Hydro est remercié chaleureusement.
J’exprime ma plus profonde reconnaissance envers mes parents, Mohammad et Farzaneh, et mes sœurs, Foza et Foozieh pour leur soutien moral et financier au cours de mes études doctorales.
RÉSUMÉ
Les aciers inoxydables martensitiques 13% Cr-4% Ni sont largement utilisé dans la fabrication des roues de turbine hydrauliques grâce à leurs bonne résistance contre corrosion et érosion par cavitation, ainsi que leurs excellentes propriétés mécaniques. Les versions coulée et corroyée de ces aciers sont utilisées, et les procédés de fabrication et réparations sont réalisés par soudage. D’un autre côté, l’existence des fissures de fatigue dans les pièces sous charges cycliques est inévitable. Quand la fissure a atteint une longueur critique, elle se propage et la rupture totale de la pièce en service pourrait avoir lieu. Les défaillances catastrophiques pourraient être inhibées et la durée de vie de la roue de turbine hydraulique pourrait être améliorée si cette longueur critique de la fissure est connue (tolérance aux dommages). Mécanique de la rupture nous permet de calculer cette longueur critique de la fissure en déterminant une propreté intrinsèque du matériau intitulée « ténacité ». Donc, la ténacité est une propriété très importante à considérer dans le choix des matériaux.
Toutefois, la ténacité des aciers inoxydables martensitiques 13% Cr-4% Ni restait encore inexplorée. Des relations entre microstructure et propriétés mécaniques de ces aciers ne sont pas assez connues, et aucune étude exhaustive n’a été rapportée jusqu’à présent sur des effets des caractéristiques microstructurales comprise la distribution, la taille, et la nature des inclusions sur les propriétés mécaniques des aciers inoxydables martensitiques 13% Cr-4% Ni notamment pour les versions coulée, corroyée, et le métal d’apport. D’ailleurs, la zone affectée thermiquement (ZAT) est supposée d’être une source de faiblesse dans un joint soudé, cependant, son comportement à rupture n’a pas encore été étudié pour cette catégorie d’aciers inoxydables. Dans cette étude, les microstructures et les propriétés mécaniques d’une version coulé, une version corroyée, et la soudure des aciers inoxydables martensitiques 13% Cr-4% Ni ont été étudiées. Les microstructures et les caractéristiques inclusionnaires étaient liées à des propriétés à la traction, à la ténacité JIc, et à la résiliences Charpy. Des essais de ténacités JIc ont également été
effectués dans la ZAT à une distance d’un millimètre de la ligne de fusion.
Un bloc de rechargement de 450 × 250 × 60 mm a été fabriqué par soudage semi-automatique à l’arc avec fil fourré (procédé FCAW). La soudure déposée a été examinée dans les deux états de brut de soudage, et thermiquement traité à 600 °C pour deux heures. La densité surfacique, la
fraction volumique et la taille des inclusions, ainsi que l’espacement inclusionnaire ont été mesurés sur les sections métallographiques par microscopie optique, tandis que la taille des inclusions a été également mesurée par MEB. Les pourcentages d’austénite ont été mesurés sur les sections métallographiques par la diffraction des rayons X. En cas de l’acier corroyé, les pourcentages d’austénite ont été également mesurés en dessous du faciès de rupture JIc aux
différentes épaisseurs. Les faciès de ruptures ont été examinés par la microscopie électronique à balayage (MEB), et la nature des inclusions a été déterminée par spectroscopie de rayons X à dispersion d’énergie.
L’acier corroyé a la meilleure combinaison de la résistance-ductilité/ténacité à la température ambiante. De plus, les plus hautes valeurs de ductilité à la rupture, la ténacité JIc, et la résilience
Charpy ont été obtenues pour cet acier. La ténacité JIc, et la résilience Charpy des métaux de base
ont été au moins cinq fois, et trois fois plus hautes que celles des métaux d’apport, respectivement.
La rupture est survenue de façon ductile pour les essais effectués à la température ambiante en cas des métaux de base et des métaux d’apport. L’amorçage prématuré des micro-vides sur les inclusions grossières ainsi que sur celles brisées a été la raison principale qui explique les plus faibles propriétés mécaniques (ductilité, ténacité JIc, et résilience Charpy) de l’acier coulé par
rapport à l’acier corroyé. De l’autre côté, la formation des micro-vides sur les petites inclusions retarde la rupture jusqu’à ce que des déformations plus importantes atteignent ; ce qui augmente l’élongation à la rupture, la ténacité JIc, et la résilience Charpy. Par contre, les sites d’amorçages
des micro-vides sont tellement nombreux en cas des métaux d’apport que la croissance des micro-vides est limitée par la coalescence, et bien moins d’énergies de ruptures sont absorbées. D’ailleurs, différents comportements de propagations de fissure ont été observés entre les métaux de base et les métaux d’apport : la courbe de résistance de J a été bien plus raide pour les métaux de base. Pour les métaux de base et les métaux d’apport, les valeurs de J continuent à accroître jusqu’au dernier point de données, cependant, par rapport à des métaux de base on peut dire qu’un quasi-palier a été atteint pour les métaux d’apport. De plus, malgré utiliser de plus grand l’ouverture à la pointe de la fissure (crack tip opening displacement) plus petites propagations de la fissure ont été lieu pendent l’essai JIc des matériaux de base.
Une corrélation entre la résilience Charpy et la ténacité KIc couvrant des larges gammes de
résilience Charpy et de ténacité KIc a été proposée pour des aciers martensitiques 13% Cr-4% Ni.
En cas des essais JIc réalisés dans la ZAT, les valeurs candidates de la ténacité (KQ) ont été
seulement obtenues. La ténacité a été plus haute que celle des métaux d’apport, mais plus basse que celle des métaux de base. Dans la majorité des cas, des propagations instables vers la soudure (sous la ligne de fusion) ont été survenues juste après avoir lieu des propagations stables d’environ un millimètre. Le comportement de résistance à la propagation stable de la fissure dans la ZAT a été similaire de celui des matériaux d’apport.
ABSTRACT
13% Cr-4% Ni martensitic stainless steels are widely used in the manufacture of hydraulic turbine runners due to their good resistance against corrosion and cavitation erosion, and high mechanical properties. Both cast and wrought versions of these steels are used, and the fabrication and repair processes are performed by welding. On the other hand, the existence of fatigue cracks in components under cyclic loading is inevitable. The propagation occurs if the crack length reaches a critical value, and a total breakdown of the in-operation component could take place. The catastrophic failures can be inhibited and the turbine runner lifetime can be improved if the critical crack length is known (damage tolerance). This critical crack length can be calculated by Fracture Mechanics defining an intrinsic property of the material entitled “fracture toughness”. Therefore, fracture toughness is a very important property to be concerned. However, fracture toughness of 13% Cr-4% Ni martensitic stainless steels still remains almost unexplored. The relations between the microstructure and mechanical properties of these steels are not well known as well, and no comprehensive investigation has been reported so far on the effects of the microstructural features including distribution, size, and types of inclusions on the mechanical properties of 13% Cr-4% Ni martensitic stainless steels, especially for the wrought version and the weld metal. Moreover, the heat affected zone (HAZ) is supposed to be a source of weakness in a welded joint, but its fracture behavior has not yet been studied for this category of stainless steels.
In this study, the microstructures and mechanical properties of a cast and a wrought 13% Cr-4% Ni martensitic stainless steels as well as those of their matching weld metal were studied. Microstructures and inclusion characteristics were related to tensile, fracture toughness JIc, and
Charpy V-notch fracture energy. Fracture toughness JIc tests were also performed in the HAZ,
one millimeter far from fusion line.
A semi-automatic flux cored arc welding process was used to fabricate a weld metal block of 450 × 250 × 60 mm. The deposited weld metal was tested in both as-welded and heat-treated conditions, and a heat treatment process at 600 °C for 2 hrs was used. The surface density, volume fraction, size and spacing of inclusions were measured on metallographic sections using optical microscopy, whereas the inclusion size was also measured using SEM. The austenite
contents were measured on metallographic sections using X-ray diffraction analysis. In the case of the wrought steel, the austenite contents were also measured on the ruptured JIc samples below
the fracture surfaces at different depths. Fracture surfaces were examined by scanning electron microscopy, and inclusion types were determined by energy dispersive X-ray spectroscopy examinations.
The wrought steel showed the best combination of strength-ductility/fracture toughness at room temperature. In addition it had the highest ductility at fracture, fracture toughness JIc and Charpy
V-notch (CVN) fracture energy. The fracture toughness JIc, and the CVN fracture energy of the
base metals were at least five times, and three times higher than those of the weld metals, respectively.
Dimpled rupture occurred for the tests carried out at room temperature for both the base metals and the weld metals. Premature micro-voids nucleation on large inclusions as well as on ruptured ones was the main reason for the lower mechanical properties (ductility, fracture toughness JIc,
and CVN fracture energy) of the cast steel as compared to the wrought one. On the other hand, the formation of micro-voids on small inclusions retards the fracture until higher strains are reached increasing the elongation at fracture, fracture toughness JIc, and CVN fracture energy.
Inversely, micro-voids nucleation sites are so numerous in the weld metals that the growth of the nucleated micro-voids was limited by their premature coalescence and much less fracture energies are absorbed.
Moreover, different crack growth behaviors were observed between the base metals and the weld metals: the J resistance curve was much steeper for the base metals. The J values continue increasing until the last data point for the both steels, however, as compared to the base metals, it can be said that a quasi-plateau was reached for the weld metals. Additionally, despite using a larger crack tip opening displacement, smaller crack growths occurred during JIc-testing of the
base metals.
A KIc-CVN correlation covering wide ranges of CVN fracture energy and fracture toughness KIc
was proposed for 13% Cr-4% Ni martensitic stainless steels.
For the JIc tests carried out in the HAZ, candidate values of fracture toughness (KQ) were only
the base metals. In most cases, unstable crack propagation toward the weld metal occurred (beneath the fusion line) just after a stable crack growth of about one millimeter. The stable crack growth resistance behavior of the HAZ was similar to that of the weld metals.
TABLE OF CONTENTS
DÉDICACE ... III REMERCIEMENTS ... IV RÉSUMÉ ... V ABSTRACT ... VIII TABLE OF CONTENTS ... XI LIST OF TABLES ... XV LIST OF FIGURES ... XVII LIST OF SYMBOLS ... XXII LIST OF ABBREVIATIONS ... XXIV LIST OF APPENDICES ... XXVIIINTRODUCTION ... 1
CHAPTER 1 LITERATURE REVIEW ... 6
1.1 Microstructure of martensitic stainless steels ... 6
1.1.1 Martensitic transformation ... 6
1.1.2 Effect of alloying elements ... 7
1.1.3 13% Cr-4% Ni martensitic stainless steels ... 11
1.2 Welding and post weld heat treatment of 13% Cr-4% Ni martensitic stainless steels ... 13
1.2.1 Welding ... 13
1.2.2 Heat treatment ... 15
1.2.2.1 Conventional heat treatment and formation of reformed austenite ... 15
1.2.2.2 Double heat treatment ... 17
1.3.1 CVN fracture energy ... 18
1.3.2 Fracture toughness KIc ... 20
1.3.3 Fracture toughness JIc measurement ... 20
1.4 Fractography of ductile and brittle fractures ... 25
1.4.1 Ductile fracture ... 25
1.4.2 Cleavage fracture ... 26
1.4.3 Intergranular fracture ... 29
1.5 Microstructure-mechanical properties relationships ... 30
1.5.1 Carbon content and grain size ... 30
1.5.2 Carbide formation ... 33
1.5.3 Delta ferrite ... 33
1.5.4 TRIP effect of austenite ... 34
1.5.5 Effect of (non-metallic) inclusions on ductile fracture ... 36
1.6 KIc-CVN correlations ... 38
1.7 Conclusions ... 43
CHAPTER 2 MATERIALS AND EXPERIMENTAL PROCEDURES ... 44
2.1 Materials ... 44
2.1.1 Chemical compositions ... 44
2.1.2 Fabrication of the E410NiMo weld metal block ... 44
2.2 Mechanical testing ... 45
2.2.1 Tensile and CVN tests ... 45
2.2.2 Preliminary JIc testing ... 46
2.2.4 Fracture toughness JIc tests in the HAZ ... 51
2.2.5 Summary of the performed mechanical tests ... 52
2.3 Metallurgical investigations ... 52
2.3.1 Metallography ... 52
2.3.2 Fractography and X-ray diffraction analysis ... 53
CHAPTER 3 RESULTS AND DISCUSSION: BASE METALS ... 56
3.1 Microstructure ... 56
3.2 Tensile properties ... 59
3.3 Fracture toughness ... 60
3.3.1 JIc and CVN properties ... 60
3.3.2 Spread of the TRIP effect ... 62
3.4 Fractographic examinations ... 63
3.4.1 Tensile tests ... 63
3.4.2 Fracture toughness JIc and CVN tests ... 65
3.4.3 Inclusion types ... 68
3.5 Discussion ... 69
3.6 Conclusions ... 72
CHAPTER 4 RESULTS AND DISCUSSION: WELD METALS ... 74
4.1 Microstructure ... 74
4.2 Tensile properties ... 75
4.3 Fracture toughness KIc and CVN properties ... 76
4.4 Fractographic examinations ... 79
4.6 Conclusions ... 84
CHAPTER 5 CONFRONTATION OF THE RESULTS AND FRACTURE TOUGHNESS IN THE HAZ…….. ... 86
5.1 Microstructure ... 86
5.2 Mechanical properties ... 88
5.2.1 Tensile tests ... 88
5.2.2 Fracture toughness JIc tests ... 89
5.2.3 CVN tests ... 91
5.3 Fractography ... 92
5.3.1 Tensile, JIc, and CVN tests of the base metals and the weld metals ... 92
5.3.2 Inclusion types ... 95
5.3.3 Quantitative estimation of the void growth ... 96
5.4 KIc-CVN correlation ... 97
5.5 Additional results in the HAZ ... 103
5.5.1 Fracture toughness JIc tests performed in the HAZ ... 103
5.5.2 Fractography of the Fracture toughness JIc performed in the HAZ ... 107
5.5.2.1 JIc stable crack extension ... 107
5.5.2.2 Unstable crack propagation ... 108
CHAPTER 6 CONCLUSIONS AND RECOMMENDATIONS... 111
6.1 Conclusions ... 111
6.2 Recommendations ... 114
LIST OF TABLES
Table 1-1: Effect of alloying elements on Ac1 [17]. ... 11
Table 1-2: A review of KIc – CVN upper shelf correlations (SI units). ... 42
Table 2-1: Chemical compositions of the studied materials (wt%). ... 44
Table 2-2: FCAW parameters used in this study. ... 45
Table 2-3: A summary of the performed mechanical tests. ... 52
Table 3-1: Prior austenite grain size of the studied materials. ... 56
Table 3-2: Initial austenite contents in the studied materials. ... 57
Table 3-3: Inclusion characteristics of the base metals. ... 58
Table 3-4: Tensile properties and ASTM requirements for CA6NM and 415 steels. ... 59
Table 3-5: Fracture toughness JIc and the equivalent KIc values of the base materials. ... 61
Table 3-6: Plane strain fracture toughness properties, CVN fracture energies, and tensile properties of the studied materials. ... 62
Table 3-7: Inclusion size measured on fracture surfaces of tensile test samples. ... 64
Table 3-8: Inclusion size measured on the fracture surfaces of JIc and CVN tests (performed at room temperature). ... 67
Table 3-9: Types of inclusions detected on the fracture surfaces of the base metals... 68
Table 4-1: Initial austenite contents of the weld metals. ... 74
Table 4-2: Inclusion characteristics of the weld metal. ... 75
Table 4-3: Tensile properties of the weld metals. ... 75
Table 4-4: Plane strain fracture toughness values of the weld metal in AW and HT conditions. . 76
Table 4-5: Plane strain fracture toughness, room temperature CVN fracture energies, and tensile properties of the weld metals. ... 79
Table 5-1: Austenite contents of the tested materials. ... 87
Table 5-2: Inclusion characteristics of the tested materials. ... 88
Table 5-3: Tensile properties of the tested materials. ... 89
Table 5-4: Plane strain fracture toughness properties of the tested materials. ... 90
Table 5-5: DBTT and CVN fracture energies of the tested materials. ... 92
Table 5-6: Inclusion sizes measured on JIc fracture surfaces of the tested materials. ... 94
Table 5-7: Types of inclusions detected in the studied materials. ... 96
Table 5-8: Equivalent strain calculated for tensile samples. ... 97
Table 5-9: True strains obtained in tensile testing of the tested materials. ... 97
Table 5-10: Room temperature tensile strength, uniform elongation, fracture toughness KIc, and CVN fracture energy of the tested materials. ... 98
Table 5-11: Chemical compositions of CA6NM-A and CA6NM-B. ... 98
Table 5-12: Austenite content and prior austenite mean grain size of CA6NM-A and CA6NM-B. ... 98
Table 5-13: Comparison between predicted KIc values of a cast 13% Cr-4% Ni martensitic stainless steel and that of 242 MPa√m measured in [81]. ... 101
Table 5-14: Fracture toughness JQ and the equivalent KQ values of the tests performed in the HAZ, 1 mm far from the fusion line, in the as-welded and the heat-treated conditions. ... 105
Table 5-15: Fracture toughness properties of the tests performed in the HAZ. ... 107
LIST OF FIGURES
Figure 1-1: Effect of carbon content on lattice parameters of austenite and martensite [12]. ... 6 Figure 1-2: Schematic representations of martensite formation: (a) the nucleus traverse along the
prior austenite grain, (b) growth [12]. ... 7 Figure 1-3: Iron-chromium equilibrium phase diagram [13]. ... 8 Figure 1-4: Effect of carbon on gamma loop expansion [13]. ... 9 Figure 1-5: Fe-Cr-C ternary systems for (a) 13% Cr, and (b) 17% Cr [13]. C1 and C2 are M23C6
and M7C3 carbides, respectively. ... 10
Figure 1-6: Shaeffler diagram showing different phase stability zones in terms of chromium equivalent and nickel equivalent for the weld metal of stainless steels (taken from [15]). Rectangular regions show various weld metals according to the percentages of Cr/Ni/Mo of the electrode types. ... 12 Figure 1-7: Phase diagram to study the Fe-Cr-Ni ternary system for a Cr/Ni ratio of 3 ([15]). .... 13 Figure 1-8: Schematic representation of FCAW process [25]. ... 14 Figure 1-9: HAZ regions regarding 13% Cr-4% Ni martensitic stainless steels constitutional
diagram [31]. ... 15 Figure 1-10: Reformed austenite in 13% Cr-4% Ni martensitic stainless steels: (a) SEM
micrograph of 415 steel [19], and (b) TEM micrograph of 410NiMo steel [3]. ... 16 Figure 1-11: Percentage of austenite versus tempering temperature [34]. ... 17 Figure 1-12: Schematic representation of (a) Charpy impact testing machine [38], and (b) CVN
specimen [37]. ... 18 Figure 1-13 : Typical Charpy ductile-brittle transition curve of a BCC metal. ... 19 Figure 1-14: Effect of carbon content on CVN ductile-brittle transition curve of carbon steels;
Figure 1-15: Relative dimensions of CT specimen for JIc testing according to ASTM E1820 [41].
... 21
Figure 1-16: Force – displacement curve with partial unloadings during a JIc test [36]. ... 22
Figure 1-17: Apl in resistance curve method [41]. ... 23
Figure 1-18 : Typical representation of J-R curve from a JIc test [36]. ... 24
Figure 1-19: Schematic representations of fracture modes in metals: (a) ductile fracture (dimpled rupture), (b) cleavage, and (c) intergranular fractures (decohesive rupture) [6]. ... 26
Figure 1-20: Dimpled rupture in austenitic stainless steel [37]. Some inclusions are shown by the arrows. ... 27
Figure 1-21: (a) formation of void sheets, (b) crack propagation through the void sheets [43]. ... 27
Figure 1-22: Schematic representations of (a) cup-cone, and (b) double-cup fractures [43]. ... 28
Figure 1-23: SEM micrograph of a multifaceted cleavage fracture surface [6]. ... 29
Figure 1-24: Formation of river patterns in a grain (a) schematic representation [6], and (b) in a low carbon steel [45]. ... 31
Figure 1-25: Intergranular fracture in a low alloy steel [47]. ... 32
Figure 1-26: Ms and ferrous martensite morphology vs. carbon content [48]. ... 32
Figure 1-27: Lath martensite sub-structure [49]. ... 33
Figure 1-28: Lath martensite microstructure in carbon steels containing: (a) 0.0026% C, (b) 0.18% C, (c) 0.38% C, (d) 0.61% C [50]. ... 34
Figure 1-29: TRIP effect of austenite during fracture toughness testing [59]. Martensite formation is only observed around the crack. ... 35
Figure 1-30: Effect of tempering temperature on austenite content, CVN fracture energy, yield, and tensile strengths [15]. ... 37
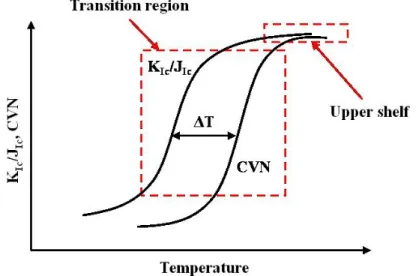
Figure 1-31: Schematic representation of temperature offset (ΔT) caused by difference in rate of straining between KIc and CVN tests. ... 40
Figure 2-1: Welding assembly of the semi-automatic FCAW process. ... 46
Figure 2-2: Fracture surface of a 25.4 mm thick side-grooved specimen [81]. ... 47
Figure 2-3: Fracture surfaces of 12.7 mm thick specimens: (a) smooth specimen, and (b) side-grooved specimen [81]. ... 48
Figure 2-4: J-∆a plot obtained from 12.7 mm and 25.4 mm side-grooved specimens [81]. ... 48
Figure 2-5: Fracture surfaces of specimens pre-cracked (a) before, and (b) after machining the side-grooves [81]. ... 49
Figure 2-6: Technical drawing of the JIc specimen used in this study. ... 50
Figure 2-7: Schematic representation of the JIc specimen, crack starter notch along the fusion line. ... 52
Figure 2-8: (a) position of the cut sample (dotted rectangular prism) in a JIc fractured specimen and (b) austenite (γ) measurement regions on the cut sample, as shown by the arrows. ... 54
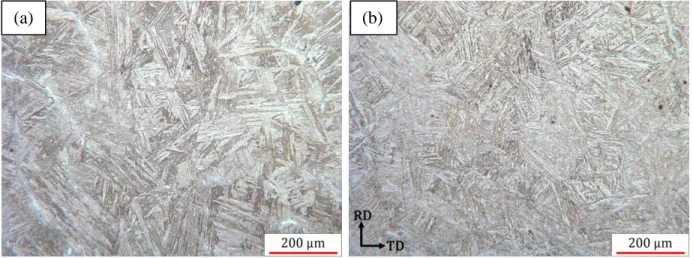
Figure 3-1: Optical micrographs of (a) CA6NM steel and (b) 415 steel. ... 56
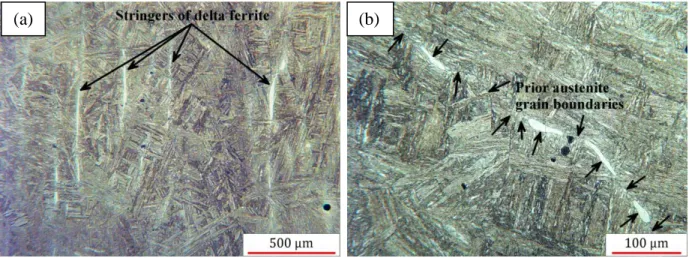
Figure 3-2: Optical micrographs of delta ferrite traces in CA6NM steel; (a) Parallel elongated traces, and (b) stringers along the prior austenite grains. ... 57
Figure 3-3: Size distributions of inclusions measured on metallographic sections. ... 58
Figure 3-4: Tensile curves of the base metals. ... 59
Figure 3-5: J-∆a plots of the base metals tested in this study. ... 60
Figure 3-6: CVN ductile-brittle transition curves of CA6NM and 415 steels. ... 61
Figure 3-7: Evolution of γ content from JIc fracture surface of 415 steel. ... 63
Figure 3-8: Tensile test fracture surfaces of (a) CA6NM steel and (b) 415 steel; some intact/broken inclusions and micro-voids are shown by the arrows. ... 64
Figure 3-9: Size distributions of inclusion measured on tensile tests fracture surfaces. ... 64
Figure 3-10: JIc fracture surfaces of (a) CA6NM steel and (b) 415 steel; some intact/broken inclusions are shown by the arrows... 65
Figure 3-11: CVN fracture surfaces of CA6NM (a, c, e) and 415 (b, d, f) steels tested at 23 °C,. 66 Figure 3-12: Size distributions of inclusions measured on (a) JIc and (b) CVN fracture surfaces. 67
Figure 3-13: Typical complex inclusions observed on the fracture surfaces of CA6NM steel with
EDX spectrums at the right: (a) Si-rich inclusion and (b) Mn-rich inclusion. ... 69
Figure 4-1: Microstructure of the weld metal in (a) the as-welded, and (b) heat-treated conditions. ... 74
Figure 4-2: Tensile curves of the weld metals. ... 75
Figure 4-3: J-∆a plots of the weld metals. ... 76
Figure 4-4: Load-displacement curve recorded during fracture toughness JIc test of the weld metal in as-welded condition. ... 77
Figure 4-5: CVN ductile-brittle transition curves of the weld metal in as-welded and heat-treated conditions. ... 78
Figure 4-6: Weld metals fracture surfaces: (a, b) tensile tests, (c, d) JIc tests, and (e, f) CVN tests performed at room temperature; (a, c , e) micrographs are from the as-welded metal, and (b, d, f) micrographs are from the heat-treated one. ... 80
Figure 4-7: Traces of cleavage on a CVN fracture surface of the as-welded material tested at room temperature; the same location for both magnifications, (a) at 37X, and (b) at 140X. 81 Figure 4-8: CVN fracture surfaces of the weld metal at (a, b) -50 °C, (c, d) -75 °C, and (e, f) ... 82
Figure 4-9: A complex inclusion observed on a JIc fracture surface of the weld metal in heat-treated condition with its EDX spectrum at the right. ... 83
Figure 5-1: Microstructures of the tested materials: (a) CA6NM steel, (b) 415 steel, (c) 410NiMo-AW, and (d) 410NiMo-HT. The traces of delta ferrite shown by the arrows in (a). ... 87
Figure 5-2: Tensile curves of the tested materials. ... 89
Figure 5-3: J-R curves of the base metals and weld metals. ... 90
Figure 5-5: JIc fracture surfaces of the tested materials: (a) CA6NM steel, (b) 415 steel, (c)
410NiMo-AW and, (d) 410NiMo-HT. ... 93 Figure 5-6: Traces of non-melted chromium on CVN fracture surface of the heat-treated weld
metal. ... 96 Figure 5-7: Relationship between normalized fracture toughness KIc and CVN absorbed energies.
... 99 Figure 5-8: KIc-CVN correlation obtained from non-linear regression curve of the data points. 100
Figure 5-9: Measured KIc values versus predicted ones using (a) correlation of Rolfe-Novak, (b)
Wallin’s correlation, (c) correlation 5), (d) Schindler’s correlation, and (e) correlation (5-6). ... 102 Figure 5-10: Fractured JIc sample, crack starter notch located along fusion plane, (a) side view,
(b) overview, and (c) top view. ... 104 Figure 5-11: J-∆a plots of fracture toughness JIc tests performed in the HAZ in as-welded and
heat-treated conditions. HAZ-AW-1 was performed at 2 mm from fusion line. ... 105 Figure 5-12: Fracture toughness JIc test fracture surface of the third test performed in the HAZ in
as-welded condition (HAZ-AW-3 sample). ... 106 Figure 5-13: J-R curves of the tests performed in the HAZ. ... 107 Figure 5-14: SEM micrographs of JIc stable crack extensions occurred at (a) 2 mm and (b) 1 mm
from fusion line in as-welded condition. ... 108 Figure 5-15: SEM micrograph of fracture surface of JIc test performed at 1 mm from fusion line
in heat-treated condition. ... 108 Figure 5-16: SEM micrographs of JIc unstable crack propagation path on fusion plane in
heat-treated condition at (a) 100X and (b) 420X magnifications. ... 109 Figure 5-17: Unstable crack propagation fracture surface. ... 109
LIST OF SYMBOLS
a Crack length
0
a Initial crack length
0
b Initial ligament (W-a ) 0
B Total thickness of JIc specimen
BN Net thickness of JIc specimen (distance between roots of the side-grooves)
c0 Inclusion size
E Young’s modulus
ef Elongation at fracture eu Uniform elongation
f Volume fraction of inclusions
H(d) Harmonic mean value of inclusion diameters J Strain energy release rate
Jel Elastic component of J
JIc J-integral value at the initiation of stable crack growth Jpl Plastic component of J
JQ Candidate value of JIc
KIc Plane-strain fracture toughness KQ Candidate value of K
P Load
Pmax Maximum load
PQ Candidate value of load
R Final radius of a spherical void R0 Initial radius of a spherical void R2 Coefficient of determination ST Stress triaxiality
T Tearing modulus
W Width of JIc specimen
α Stress concentration factor around an inclusion
β Constant
γ Austenite
s
Surface energy
∆ap Physical crack extension
∆K Amplitude of stress intensity factor (Kmax – Kmin) δ Delta ferrite
ε True strain in uniaxial tensile testing
εR Plastic strain needed for growth of a spherical void λ Inclusion spacing
Poisson ratio
0.2% σy 0.2% offset yield strength
σUTS Tensile strength
σvoid Required stress for void nucleation
σy Yield strength
χ2
Chi square
LIST OF ABBREVIATIONS
ACI Alloy Casting Institute
ASTM American Society for Testing and Materials
AW As-Welded
AWS American Welding Society
BCC Body-Centered Cubic
BCT Body-Centered Tetragonal
CReFaRRE Consortium de Recherche en Fabrication et Réparation des Roues d’Eau (research consortium in manufacture and repair of the hydraulic turbine runners)
COD Crack Opening Displacement
CT Compact Tension
CVN Charpy V-Notch
DBTT Ductile-Brittle Transition Temperature EDX Energy Dispersive X-ray
ÉTS École de Technologie Supérieure FCAW Flux-Cored Arc Welding
FCC Face-Centered Cubic FEM Finite Element Modeling
HAZ Heat Affected Zone
HCP Hexagonal Close-Packed
HRC Rockwell C Hardness
HT Heat-Treated
IREQ Institut de Recherche d’Hydro-Québec J-R curve J-Resistance curve
LEFM Linear Elastic Fracture Mechanics LPD Load Point Displacement
Ms The temperature at which martensite starts to form
NSERC Natural Science and Engineering Research Council of Canada
RD Rolling Direction
SEM Scanning Electron Microscope TD Transverse Direction
TRIP Transformation-Induced Plasticity UNS Unified Numbering System
WM Weld Metal
LIST OF APPENDICES
Appendix A – Cutting plan of samples to be cut from the weld metal block ... 123 Appendix B – Automatic areal analysis of inclusions ... 124 Appendix C – Prior austenite grain boundaries ... 127
INTRODUCTION
Context
This project is one of the eights projects on the “Analysis of crack propagation in welded joints” in the CReFaRRE research consortium. These projects are supported by NSERC, Hydro-Québec, and Alstom Power Hydro. École Polytechnique de Montréal and ÉTS are the university partners, whereas IREQ, and Alstom Power Hydro are the industrial partners of this consortium. Cast (CA6NM), wrought (S41500), and filler metal (410NiMo) of 13% Cr-4% Ni martensitic stainless steels, as well as a low carbon content austenitic stainless steel (304L), and a carbon steel (A516) used in the fabrication of hydraulic turbine runners are used. Apart from the project defined for this thesis, the following topics are studied in these projects:
- Susceptibility to cold cracking during welding;
- Fatigue crack propagation in the base metal, in the HAZ, and in the weld metal;
- Influence of stress ratio, and tensile residual stress on the base metal resistance to fatigue crack propagation;
- Effect of different heat treatments, carbon content on the base metal resistance to fatigue crack propagation;
- Effect of constant and variable amplitude loading on fatigue crack propagation of the base metals determining the interaction between small and large loading cycles;
- Fatigue behavior of welded joints of partial penetration determining their fatigue life and comparing the crack growth with those predicted by Fracture Mechanics.
Mechanical properties of a material emanate from its microstructure. In other words, to study the mechanical properties of a material, its microstructural features have to be characterized first. Transformation-induced plasticity (TRIP) of the austenite is considered as an important mechanism improving the ductility, plane strain fracture toughness, and Charpy V-notch (CVN) fracture energy [1-3]. Inclusions play a very important role in ductile rupture. This is related to their content, size, distribution and nature in the microstructure [4-9].
Microscopic and macroscopic defects such as inclusions, and cracks resulting from fabrication process, especially in the case of a welding process, most often exist in an in-operation
component. If propagation occurs, these cracks reach a critical size and sudden break of the component takes place causing a lot of damage. Therefore, by knowing this critical crack size, catastrophic failures could be inhibited. This critical crack size can be obtained by Fracture Mechanics defining an intrinsic material property called “fracture toughness”. This important property is defined as the resistance of a material against unstable propagation of the sharpest possible notch, produced by fatigue cycling, in the presence of triaxial stresses. Accordingly, fracture toughness is a very important property to consider in the choice of materials, particularly for welded constructions.
Since measuring the plane strain fracture toughness involves a complex, time consuming and expensive procedure, especially in the case of fracture toughness JIc, there is a great interest to
predict the plane strain fracture toughness using a much simpler test results commonly used in industry: the “Charpy impact test”. This test compares the fracture behavior of materials against a sudden break in the presence of triaxial stresses, however, the data cannot be used in Fracture Mechanics calculations.
Problematic
There is no complete database for mechanical properties of 13% Cr-4% Ni martensitic stainless steels and their welds in the literature, especially in the cases of fracture toughness JIc and CVN
fracture energy of the wrought version and the weld metal deposited by flux-cored arc welding (FCAW) process. In addition, there is even less information about mechanical behavior of their heat affected zone (HAZ). Because of the complexity of its microstructure and its susceptibility to cold cracking in the presence of residual stresses, HAZ is suspected to be a source of weakness in welded joints [10]. Accordingly, performing fracture toughness tests in the HAZ along with that of the base metal and weld metal is of the great importance.
On the other hand, developing a KIc-CVN correlation for these martensitic stainless steels
provides the opportunity to predict fracture toughness of the components after each heat treatment process by testing a small specimen which could be a help for quality control process. General objectives
This thesis entitled “Ductile Fracture of 13% Cr-4% Ni Martensitic Stainless Steels Used in Hydraulic Turbine Welded Runners” is intended to provide an important data base of mechanical properties, especially in the case of fracture toughness, as well as microstructure-mechanical
properties relationships. In addition, proposing KIc-CVN correlations can be very useful for the
industrial partners.
The Mechanical characterization of a cast and a wrought 13% Cr-4% Ni martensitic stainless steels, as well as a weld metal of the same chemical composition was the first objective of this project. To this purpose, tensile, fracture toughness JIc and CVN tests were performed to create an
important data base for the basic mechanical properties of this grade of martensitic stainless steels. This is of great importance for both scientific and industrial sides. The second general objective was to find the relationships between microstructures/defect characteristics and the mechanical properties. This is a scientific objective, but it could be interesting for the industrial partners since it provides the opportunity for selecting materials of higher mechanical properties performing simple metallographic examinations.
Establishing a KIc-CVN correlation for both the base metals and the weld metals was the final
objective of the industrial partners. Its main outgrowth is to have a precise idea about the fracture toughness just by performing a conventional CVN test saving a lot of time and hence, fast material selection.
Specific objectives
− Tensile, fracture toughness JIc, and CVN testing of a cast, and a wrought base metals in
as-received condition (tempered), as well as a weld metal in both as-welded and heat-treated conditions to make systematic comparisons among these materials/ mechanical properties;
− Characterization of the microstructures and inclusion characteristics of the tested materials, and interpretation of their effects on tensile, fracture toughness JIc, and CVN
fractures;
− Fractography of fracture surfaces in each case with attention paid to ductile fracture mechanism;
− Shedding light on different fracture mechanisms;
− XRD analysis of the phases present in the section perpendicular to JIc stable crack
extension fracture surfaces (only base metals) to determine the TRIP effect region; − Fracture toughness JIc testing with an initial fatigue crack close to the fusion surface.
Organization of the study
This thesis is organized into six chapters. A critical literature review is presented in the first chapter. A brief review on the formation, morphology, and strength of ferrous martensite is provided. Microstructure and mechanical properties of 13% Cr-4% Ni martensitic stainless steels are presented. Upper shelf KIc-CVN correlations are also discussed.
Materials tested in this study and experimental procedures are defined in the second chapter. A brief review on the base metals is given. Then, the weld metal block fabrication procedure using FCAW process is presented. The welding parameters and the semi-automatic welding procedure are described, and chemical compositions of the materials are provided. Afterwards, the experimental procedures are presented. First of all, metallographic examinations including inclusion characterization analyses are briefly described. Mechanical characterization procedures including tensile, fracture toughness JIc, of the base metals and the weld metal, as well as those
performed in the HAZ, and CVN tests are presented. Fractography and XRD analyses are described at the end of this chapter.
The results obtained on the base metals are collected in the third chapter. The microstructural and inclusion characteristics examinations are presented at first. Then, mechanical characterization and fractographic examinations are presented. This provides the opportunity to shed light on the effects of microstructural features on the mechanical properties. So, a detailed discussion on the microstructure/inclusion characteristics-mechanical properties relationships is provided afterward. These microstructural and mechanical findings are finally summarised in the “conclusions” section.
The fourth chapter addresses the weld metal characterization in terms of both microstructural and mechanical aspects. Results, discussion, and conclusions are presented in the same order than those of the third chapter.
A detailed discussion on all the results obtained in this study was provided in the fifth chapter. Briefly, the microstructural features, mechanical properties, and fracture surfaces of the base metals and those of the weld metal in both as-welded and heat-treated conditions are compared. Three relevant KIc-CVN correlations taken from the literature are compared and a new one is
proposed for 13% Cr-4% Ni martensitic stainless steels. At the end of this chapter, results obtained from JIc tests performed in the HAZ close to the fusion boundary are also added.
Overall brief conclusions of all findings in this project are summarised in the final chapter. These conclusions could shed light on further researches that could be performed on 13% Cr-4% Ni martensitic stainless steels or similar materials.
CHAPTER 1
LITERATURE REVIEW
1.1 Microstructure of martensitic stainless steels
1.1.1 Martensitic transformation
Martensite forms undergoing a diffusionless transformation. In this kind of transformation, there is not enough time for diffusion of atoms and the transformation occurs by a so called “military” movement of all atoms in a distance of less than interatomic one (shear mechanism). The term “military” is used in contrast with the term “civilian” used for diffusional transformations. Shear mechanism could occur in all metals and alloys during cooling or heating if it takes place rapidly enough. During ferrous martensitic transformation, carbon atoms remain in solid solution occupying interstitial octahedral positions in iron BCC lattice structure. Therefore, a supersaturated solid solution of carbon atoms is formed. Solid solution carbon atoms expand uniformly the lattice parameter of austenite. However, this extension is not uniform in the case of a BCC structure. This leads to an increase in the lattice parameter in one direction (c) forming a BCT lattice structure. This torsion of the lattice parameter leads to a volume expansion of the transformed region [11, 12]. Effect of carbon content on lattice parameters of austenite and martensite phases are shown in Figure 1-1. As can be seen in this figure, the lattice “c” parameter is drastically increased by increasing the carbon content.
The formation of martensite is complex, and it is not yet clearly understood. However, metallographic observations showed that the first martensite nuclei traverse along prior austenite grain (Figure 1-2). The martensite nuclei have a lens shape, and their density in an austenite grain seems to be independent of the grain size [12].
(a) (b)
Figure 1-2: Schematic representations of martensite formation: (a) the nucleus traverse along the prior austenite grain, (b) growth [12]
1.1.2 Effect of alloying elements
Cr: Chromium is the basic element in stainless steels. At least 10.5 wt% chromium is necessary to obtain a stainless steel. This minimum amount of chromium leads to the formation of a compact, adherent and protective layer of chromium oxide (Cr2O3) which separates steel from its
environment preventing rust. Most martensitic stainless steels contain 12-14 wt% chromium which results in a lower corrosion resistance comparing with other grades, especially austenitic stainless steels which contain 16-25 wt% chromium. On the other hand, most martensitic stainless steels have lower price than other stainless steel grades due to their relatively lower alloying elements content. Since the mechanical properties and corrosion resistance of these steels decrease at temperatures higher than 650 °C, martensitic stainless steels are typically used at lower temperatures [13]. Chromium forms carbides and nitrides such as M23C6, M7C3, M23(C,
N)6 et Cr2N, where M is a mix of chromium and some portions of iron and molybdenum. M23C6
is formed in all stainless steels, but M7C3 is not common. Chromium is a ferrite-promoting
Iron-chromium equilibrium phase diagram is considered the basic phase diagram for martensitic stainless steels (Figure 1-3). Ferrite is the dominant phase and austenite exists in a confined region called “gamma loop” where its chromium content doesn’t exceed about 13%. Austenite transforms into ferrite during cooling under equilibrium conditions. However, under most cooling conditions (except furnace cooling), austenite transforms to martensite even in heavy sections. This is the basis of producing martensitic stainless steels. These steels are considered as air hardening, that is to say, air cooling from austenite is sufficient to produce martensite [13, 14].
Figure 1-3: Iron-chromium equilibrium phase diagram [13]
C: The most important alloying element in steels is carbon [15]. In martensitic stainless steels, carbon forms M23C6 and M7C3 carbides. Hardness, and hence, susceptibility to cold cracking
increase with carbon content. The maximum hardness of martensitic stainless steels containing less than 0.06% C, can reach up to 35 HRC. The hardness of steels for carbon contents between 0.06% and 0.3%, is in the range of 35-55 HRC. For carbon contents of exceeding 0.3%, the hardness will be between 55 and 65 HRC. Therefore, steels of the first category are less susceptible to cold cracking as compared to the two other groups.
Since carbon is a gamma-promoting element, its addition expands the austenite region of the Fe-Cr phase diagram. As shown in Figure 1-4, the nose of the gamma loop is expanded from 11% Fe-Cr to 21% Cr just by adding 0.036% C.
Figure 1-4: Effect of carbon on gamma loop expansion [13]
To examine the effect of carbon on Fe-Cr equilibrium phase diagram, Fe-Cr-C ternary systems for 13% Cr and 17% Cr are shown in Figures 1-5 (a) and (b), respectively. Note that in martensitic stainless steels, δ-ferrite has the same crystallographic structure as the α-ferrite (Body-Centered Cubic (BCC)), but it refers to iron crystals forming at high temperatures. As can be seen in Figure 1-5 (a), the extent of austenite is increased and ferrite stability domain is decreased. However, by increasing the chromium content in Figure 1-5 (b), the austenite domain is limited, but the ferrite domain is expanded. This is because chromium is a ferrite-promoting element stabilizing ferrite [13].
S: Sulfur forms low-melting point components segregating at grain boundaries. These components form liquid layers at grain boundaries causing an intergranular rupture during shrinkage in casting (hot shortness). Since martensitic stainless steels first solidify as delta ferrite and due to the good solubility of sulfur in delta ferrite, martensitic stainless steels are less susceptible to hot shortness than austenitic stainless steels [16]. However, low contents of sulfur improve machining, hot forming, and weldability of stainless steels. The extents of delta ferrite and austenite, as well as formation of intermetallic precipitations are not affected noticeably by low sulfur contents in Fe-Cr-Ni ternary system [15, 16].
(a) (b)
Figure 1-5: Fe-Cr-C ternary systems for (a) 13% Cr, and (b) 17% Cr [13]. C1 and C2 are M23C6
and M7C3 carbides, respectively
Mn: Generally, Mn is added to steels to prevent hot shortness by forming MnS (instead of iron sulfide). Mn is an austenite-promoting element. Its content in martensitic stainless steels is less than one percent [13, 16].
P: Phosphorus can form low melting point components with sulphides, silicides, and borides increasing the risk of hot shortness. However, this risk is negligible if phosphorus content is less than 0.025%. Phosphorus narrows the gamma loop [15].
Si: Silicon increases hot corrosion resistance of stainless steels. It is a ferrite-promoting element restricting the gamma loop. Silicon develops delta ferrite formation range and increase the sigma phase range. The formation of M23C6 carbides is facilitated by the presence of silicon. Fluidity of
molten steel is improved by silicon and that is why silicon content of weld metal is sometimes higher than normal. Silicon forms intermetallic components such as FeSi, Fe2Si Fe3Si, Fe5Si3 and
Cr3Si segregating at grain boundaries causing structural embrittlement. In addition, silicon can
increase the risk of hot shortness by forming low melting point components [13, 15, 16].
Ni: Nickel is a strong austenite-promoting element decreasing Ac1 temperature (Table 1-1).
Nickel improves toughness, but decreases the resistance against stress corrosion cracking (SCC). [13, 17].
Table 1-1: Effect of alloying elements on Ac1 [17]
Alloying element Ni Mn Co Si Mo Al V
Ac1 change (°C) per wt% -30 -25 -5 +25 +25 +30 +50
Mo: Molybdenum is a ferrite-promoting element and carbide former. It increases yield and tensile strengths at high temperature by secondary hardening [13].
N: Nitrogen is an austenite-promoting element extending the gamma loop; its effect on stabilizing the austenite is as important as the effect of carbon (Figure 1-4) [15]. In solid solution, it increases the strength of steel [13].
O: Oxygen forms non-metallic components, especially during welding, decreasing mechanical properties of stainless steels [15].
Cu: Copper is an austenite-promoting element. It improves corrosion resistance of stainless steels. Copper increases the strength of stainless steels by the formation of precipitates [13, 15].
1.1.3 13% Cr-4% Ni martensitic stainless steels
Basically, carbon and chromium are the main alloying elements of martensitic stainless steels. However, having high contents of carbon was the main reason for the majority of disadvantages of the chromium martensitic stainless steels such as poor weldability, susceptibility to cold cracking, and low toughness. As a result, in the late fifties a new generation of martensitic stainless steels with low contents of carbon entitled “soft martensitic stainless steels” was developed. Nickel was added to these alloys to remove the delta ferrite and improve toughness [13, 15]. However, most times, some supercooled delta ferrite remains along prior austenite grains; especially in the case of cast martensitic stainless steels. This is due to the segregation of ferrite-promoting elements during solidification stabilizing the delta ferrite at room temperature. Additionally, adding nickel stabilizes the gamma phase at lower temperatures.
Since the 1960s, different grades of soft martensitic stainless steels such as 13% Cr-1.5% Ni, 13% Cr-4% Ni, 16% Cr-6% Ni and 17% Cr-4% Ni have been produced [15]. Among these grades, 13% Cr-4% Ni is used to fabricate hydraulic turbine runners because of its good corrosion resistance, good resistance to cavitation erosion, excellent weldability, and good castability [2, 18, 19]. This steel is also used in compressor cones, pump bowls, and petrochemical industries [3]. Different phase stability zones of the stainless steel weld metals are
shown in Figure 1-6. As can be seen in this figure, the weld metal of 13% Cr-4% Ni martensitic stainless steels is located between fully martensite, and martensite and ferrite zones.
Figure 1-6: Shaeffler diagram showing different phase stability zones in terms of chromium equivalent and nickel equivalent for the weld metal of stainless steels (taken from [15]). Rectangular regions show various weld metals according to the percentages of Cr/Ni/Mo of the
electrode types
Fe-Cr-Ni system for a Cr/Ni ratio of 3 is shown in Figure 1-7. The gamma loop is much more expanded comparing with the Fe-Cr system (Figure 1-3). The addition of 4% Ni resulted also to the decrease of Ac1 temperature to about 631 °C for 13% Cr-4% Ni martensitic stainless steels.
In the as-quenched state, the microstructure of 13% Cr-4% Ni martensitic stainless steels is a combination of lath martensite and small amounts of delta ferrite. During subsequent tempering at around 600 °C, the martensite is partially transformed into stable austenite, forming a so-called “reformed austenite” phase. The reformed austenite is thermally stable even if the steel is quenched in liquid nitrogen (-196 °C) [3]. Tempering at higher temperatures would lead to the formation of thermally unstable austenite which would turn into fresh martensite during cooling [14, 15].
Figure 1-7: Phase diagram to study the Fe-Cr-Ni ternary system for a Cr/Ni ratio of 3 ([15])
1.2 Welding and post weld heat treatment of 13% Cr-4% Ni
martensitic stainless steels
1.2.1 Welding
Hydraulic turbine runners components are usually assembled using flux-cored arc welding [20]. Schematic representation of FCAW process is shown in Figure 1-8. This is a self-shielding process; however, additional shielding gas can also be used. A flux cored tubular wire is used as a continuous consumable electrode whose the flux consists of materials providing self-shielding gases and slag, arc stabilizers, deposition rate enhancers, as well as alloying elements to improve the mechanical properties of the weld metal. This welding process is also referred as “open arc welding” since it is suitable for on-site welding due to the very good protection of the weld pool from the air by shielding gases generated from the flux-cored materials [21]. High weld metal quality under radiographic testing, high deposition rate, good appearance and smooth surface of the weld metal are other advantages of this welding process [22, 23]. Additionally, removal of the slag is fast and easy, and the welding process can be performed automatically [23, 24].
Figure 1-8: Schematic representation of FCAW process [25]
Nitrogen has deleterious effects on the mechanical properties of weld metal. Nitrogen forms sharp iron nitrides (Fe4N) reducing severely the ductility. Therefore, Al, Ti, Zr, and Si are usually
added to the flux-cored material to reduce nitrogen by forming nitrides. In addition, these elements also reduce oxygen content of the weld metal by forming oxides [25].
In the course of the welding process, the liquid solidifies as delta ferrite. Then, delta ferrite transforms into austenite, and finally austenite transforms into martensite during cooling to room temperature. At the end of the solidification, segregation of ferrite-promoting elements and/or austenite-promoting ones result in the formation of delta ferrite and/or retained austenite, respectively. Due to the concentration of the alloying elements, these phases are stable at room temperature.
Heat affected zone (HAZ) is of complex microstructures in 13% Cr-4% Ni stainless steels coming from various heat cycles applied to this region during welding procedure. HAZ regions regarding 13% Cr-4% Ni martensitic stainless steels constitutional diagram in terms of distance from fusion line is shown in Figure 1-9. Partial melting of primary delta ferrite occurs in a confined region just beside fusion line (zone (i)). A fully ferritic microstructure undergoing significant grain growth forms in zone (ii) due to the high-temperature applied to this region. Partial transformation of austenite to delta ferrite occurs in zone (iii). Zone (iv) is of a fully austenitic microstructure. Finally, tempered martensite partially transforms into austenite in zone (v) during heating [26-28].
1.2.2 Heat treatment
There are two general types of heat treatment processes for 13% Cr-4% Ni martensitic stainless steels: (i) conventional and (ii) double heat treatment. Note that these processes are used for both base and weld metals.
1.2.2.1 Conventional heat treatment and formation of reformed austenite
Conventional heat treatment process [29] of these steels consists of an austenitization at a minimum temperature of 1010 °C, quenching below 95 °C following by tempering between 565 °C and 620 °C (below Ac1). The tempering temperature has to be carefully chosen to obtain the
best strength-ductility balance. During heat treatment, solid solution carbon atoms precipitate as carbides turning fresh martensite into tempered martensite. M23C6 and M7C6 are the most
common carbides form in these alloys. The former has BCC lattice structure, and the latter has HCP one [30]. Therefore, the hardness and strength of the alloy decrease, and the ductility increases. In addition, austenite forms between martensite laths during this process [14, 30].
Figure 1-9: HAZ regions regarding 13% Cr-4% Ni martensitic stainless steels constitutional diagram [31]
One of the most important aspects of heat treatment of these alloys is the formation of austenite called “reformed austenite” which leads to the improvement of mechanical properties (see section 1.5.4). During tempering at around 570 °C up to about 630 °C [15], fine islets of reformed austenite form in prior austenite grain boundaries as well as between martensite laths [3, 19, 32]. The concentration of austenitepromoting elements, especially Ni, stabilizes the austenite until -196 °C [3]. Figures 1-10 (a) and (b) show reformed austenite in the wrought version (clear platelets), and in the weld metal (dark platelets) of 13% Cr-4% Ni stainless steels, respectively. As shown in (b), it can be clearly observed that the reformed austenite formed between martensite laths. The amount of reformed austenite depends on chemical composition of the alloy, and heat treatment process [15]. Note that the final amount of austenite measured using XRD is the total of retained austenite (from solidification), and reformed austenite (formed during tempering). Therefore, the term “austenite” is used to address the total amount of austenite (retained + reformed austenite) measured all over this thesis.
Figure 1-10: Reformed austenite in 13% Cr-4% Ni martensitic stainless steels: (a) SEM micrograph of 415 steel [19], and (b) TEM micrograph of 410NiMo steel [3]
There is an optimal tempering temperature to obtain the maximum possible reformed austenite. If the tempering process is performed at higher temperatures, higher reformed austenite contents will be re-transformed into martensite during cooling. A plot of percentage of austenite versus tempering temperature for a cast 13% Cr-4% Ni martensitic stainless steel is shown in Figure 1-11. The maximum amounts of austenite are obtained at 580 °C for both furnace cooled (23%) and water quenched (19%) specimens. Due to the lower cooling rate in the furnace, higher amounts of austenite were formed in this case (as compared to the water quenched specimen).
1.2.2.2 Double heat treatment
Obtaining the maximum possible amount of reformed austenite is provided by this process. A total austenite amount of 25% was obtained for the wrought version of 13% Cr-4% Ni martensitic stainless steels [33] using this heat treatment process. This kind of heat treatment consists of an initial tempering between Ac1 and Ac3, and a final one below Ac1. By the first
process, a considerable part of martensite transforms into reformed austenite, and the fresh martensite is tempered. However, part of this reformed austenite retransforms into fresh martensite during subsequent cooling. This fresh martensite is tempered by the final tempering process.
Figure 1-11: Percentage of austenite versus tempering temperature [34]
The following temperature ranges were proposed in ASTM A487/A487M [35] for double heat-treatment of 13% Cr-4% Ni stainless steels:
1- An intermediate tempering in a temperature range of 665 °C to 690 °C followed by quenching below 95 °C;
2- A final tempering in a temperature range of 565 °C to 620 °C followed by quenching below 95 °C.
1.3 Mechanical testing
1.3.1 CVN fracture energy
During Charpy V-notch (CVN) impact test, the energy absorbed by breaking a specimen with a V-shaped notch at its center is measured. This is a severe test having high rate of straining and high stress concentration at the tip of the V-notch. Schematic representations of a Charpy impact testing machine and a CVN specimen are shown in Figures 1-12 (a) and (b), respectively. The
(a) (b)
Figure 1-12: Schematic representation of (a) Charpy impact testing machine [38], and (b) CVN specimen [37]
speed of the pendulum at the moment of impact is 5 to 5.5 m/s ( with maximum
impact energy of 300 J. The V-notch specimen shown in (b) has an opening angle of 45 °, depth of 2 mm and a radius of curvature of 0.25 mm at its tip. The length, width and thickness of the specimen are 55 mm, 10 mm and 10 mm, respectively [36, 37].
A transition from ductile to brittle fractures occurs in the case of body-centered cubic (BCC) metals (Figure 1-13). This is related to the sensitivity of the Peierls-Nabarro force with the temperature in the BCC structure. However, the fracture mode doesn’t change by decreasing the testing temperature in face centered cubic metals (FCC) metals. This is because in a FCC structure, there are various active slip systems even at low temperatures. Note that the ductile –
brittle transition temperature curve also does exist for hexagonal close packed (HCP) structures [39, 40].
The effect of carbon content on CVN fracture energy of carbon steels is shown in Figure 1-14. Ductile to brittle transition temperature decreases by decreasing the carbon content. Additionally, upper shelf CVN fracture energy increases by decreasing the carbon content. As can be seen in
Figure 1-13 : Typical Charpy ductile-brittle transition curve of a BCC metal
this figure, martensitic stainless steels have low ductile to brittle transition temperature and high upper shelf CVN fracture energy.
Figure 1-14: Effect of carbon content on CVN ductile-brittle transition curve of carbon steels; results of two martensitic stainless steels are also added (dashed lines) [26]
E
nergy
Temperature
Lower shelf Upper shelf Transition region
The Charpy impact test is a quick test commonly used in industry. However, the Charpy fracture energy is not an intrinsic property of the material, and it is just used to compare the fracture behavior of different materials and/or that of a material with respect to the temperature. Therefore, the Charpy fracture energy cannot be used for Fracture Mechanics calculations of in-operation components with sharp fatigue cracks. Accordingly, Fracture Mechanics provides a characteristic fracture property of materials entitled “fracture toughness KIc” described in the
following section.
1.3.2 Fracture toughness K
IcLinear Elastic Fracture Mechanics (LEFM) describes the stress singularity at the tip of a sharp crack defining the stress intensity factor, K. Sudden crack propagation occurs when K reaches a critical value, Kc. This critical value of the stress intensity factor is considered as a material
constant, “fracture toughness KIc”, if the state of the stress at the crack tip is triaxial (plane strain
state) and if the size of the crack tip plastic zone is small enough as compared to the dimensions of the specimen. However, in the case of ductile materials, using small laboratory specimens leads to significant plastic deformations and hence, LEFM approach is no longer applicable. In this case, the fracture parameter is defined as the release rate of the strain energy, J. Since sudden crack propagation does not occur in elastic-plastic condition, the critical value of the energy release rate, JIc, is defined at the initiation of stable crack propagation under plane strain
condition. This initiation fracture toughness can be transformed to KIc using the following
equation: 2 2 (1 ) Ic Ic K J E (1-1)
where ν is Poisson ratio and E is Young’s modulus.
1.3.3 Fracture toughness J
Icmeasurement
Fracture toughness JIc testing procedures described in this section is in accordance with ASTM
E1820 [41]. Much more details are given in the standard. Relative dimensions of a CT specimen for JIc test according to ASTM E1820 are shown in Figure 1-15. The standard proposes fatigue
pre-cracking to a total length between 0.45 W and 0.7 W at the bottom of the machined notch to create the sharpest possible notch creating minimum deformation.
Figure 1-15: Relative dimensions of CT specimen for JIc testing according to ASTM E1820 [41]
Since direct measurement of crack extension is nearly impossible during the JIc-test, ASTM
E1820 [41] proposes the use of compliance method. According to this method, crack extension is measured by means of partial unloading during registration of load, P, in terms of displacement, v. An example of force – displacement curve of a JIc test using the compliance method is shown
in Figure 1-16. The lines no. 1 to no. 8 were produced during partial unloading and reloading. Their inverse slopes are defined as “compliance” (the slope is the stiffness of the specimen). The slope of these lines decreases as the crack propagates (the stiffness of the material decreases) and hence, the compliance increases. To plot the J-R curve and determine a candidate value of JIc, JQ,
the corresponding crack length and J value must be calculated for each partial unloading. Finally, after a crack advancement of about 2 – 3 mm, the JIc-test is finished, and the crack should be
marked by heat tinting or fatigue cycling to measure the total crack size, and determine the state of stress (stress triaxiality) on its tip. Both initial and final crack lengths have to be measured at 9 equally spaced points on fracture surface.
To obtain the crack resistance curve, J vs. ∆a, also called the J-R curve, J values are calculated for each crack extension, Δa. The following equations are used to calculate J for each crack extension: ) ( ) (i pli el J J J (1-2)
where Jel and Jpl are the elastic, and plastic components of J, respectively, 1.25 W ± 0.01 W
![Figure 1-1: Effect of carbon content on lattice parameters of austenite and martensite [12]](https://thumb-eu.123doks.com/thumbv2/123doknet/2330390.31557/33.918.301.617.717.1005/figure-effect-carbon-content-lattice-parameters-austenite-martensite.webp)
![Figure 1-9: HAZ regions regarding 13% Cr-4% Ni martensitic stainless steels constitutional diagram [31]](https://thumb-eu.123doks.com/thumbv2/123doknet/2330390.31557/42.918.206.715.568.962/figure-regions-regarding-martensitic-stainless-steels-constitutional-diagram.webp)
![Figure 1-15: Relative dimensions of CT specimen for J Ic testing according to ASTM E1820 [41]](https://thumb-eu.123doks.com/thumbv2/123doknet/2330390.31557/48.918.242.671.172.394/figure-relative-dimensions-ct-specimen-testing-according-astm.webp)
![Figure 1-16: Force – displacement curve with partial unloadings during a J Ic test [36] and: EKJel 22)1( (1-3) where, wafWBBFK N 5.0)( (1-4) where, Wa](https://thumb-eu.123doks.com/thumbv2/123doknet/2330390.31557/49.918.254.665.105.504/figure-force-displacement-curve-partial-unloadings-ekjel-wafwbbfk.webp)
![Figure 1-20: Dimpled rupture in austenitic stainless steel [37]. Some inclusions are shown by the arrows](https://thumb-eu.123doks.com/thumbv2/123doknet/2330390.31557/54.918.106.822.104.568/figure-dimpled-rupture-austenitic-stainless-steel-inclusions-arrows.webp)
![Figure 1-29: TRIP effect of austenite during fracture toughness testing [59]. Martensite formation is only observed around the crack](https://thumb-eu.123doks.com/thumbv2/123doknet/2330390.31557/62.918.253.675.538.905/figure-austenite-fracture-toughness-testing-martensite-formation-observed.webp)
![Figure 1-30: Effect of tempering temperature on austenite content, CVN fracture energy, yield, and tensile strengths [15]](https://thumb-eu.123doks.com/thumbv2/123doknet/2330390.31557/64.918.250.668.107.742/figure-effect-tempering-temperature-austenite-content-fracture-strengths.webp)