HAL Id: hal-00727388
https://hal.archives-ouvertes.fr/hal-00727388
Submitted on 26 Jan 2021HAL is a multi-disciplinary open access archive for the deposit and dissemination of sci-entific research documents, whether they are pub-lished or not. The documents may come from teaching and research institutions in France or abroad, or from public or private research centers.
L’archive ouverte pluridisciplinaire HAL, est destinée au dépôt et à la diffusion de documents scientifiques de niveau recherche, publiés ou non, émanant des établissements d’enseignement et de recherche français ou étrangers, des laboratoires publics ou privés.
Understanding the role of C3H6, CO and H-2 on
efficiency and selectivity of NOx storage reduction
(NSR) process
Liliana Masdrag, Xavier Courtois, Fabien Can, Emmanuel Royer, Emmanuel
Rohart, Gilbert Blanchard, Patrice Marecot, Daniel Duprez
To cite this version:
Liliana Masdrag, Xavier Courtois, Fabien Can, Emmanuel Royer, Emmanuel Rohart, et al.. Un-derstanding the role of C3H6, CO and H-2 on efficiency and selectivity of NOx storage reduction (NSR) process. Catalysis Today, Elsevier, 2012, 189 (1), pp.70-76. �10.1016/j.cattod.2012.03.053�. �hal-00727388�
Catalysis Today 189 (2012) 70-76. DOI: 10.1016/j.cattod.2012.03.053
Understanding the role of C
3H
6, CO and H
2on efficiency and selectivity of
NOx Storage Reduction (NSR) process.
Liliana Masdrag1, Xavier Courtois1*, Fabien Can1, Sébastien Royer1, Emmanuel Rohart2, Gilbert Blanchard3, Patrice Marecot1, Daniel Duprez1
1 Institut de Chimie des Milieux et des Matériaux de Poitiers (IC2MP), Université de
Poitiers-CNRS, 4 rue Michel Brunet, F-86022 Poitiers Cedex, France
2 RHODIA Research & Technologies, 52 rue de la Haie Coq, F-93308 Aubervilliers, France 3 PSA, Peugeot Citroën, Route de Gisy, F-78943 Vélizy-Villacoublay Cedex, France
*Corresponding author, E-mail: [email protected]
Abstract
The NOx storage reduction (NSR) process is commonly envisaged for the NOx treatment of exhaust gas from lean-burn engine vehicles. NOx are firstly stored on the catalyst, which is periodically submitted to a reducing mixture for few seconds in order to reduce the stored NOx into N2. The on-board reducer is coming from the gasoline/Diesel fuel and, in fact, the NSR
catalyst is submitted to a mixture of hydrocarbons, CO and H2 with various compositions
depending on the lean/rich step. In this study, the influence of each reducer (C3H6, CO and H2)
is evaluated separately, with a special consideration to the N2O selectivity. It is demonstrated
that the N2O can be emitted during both lean and rich periods, with varying ratio depending on
the considered reducer and the temperature of gas. For instance, at 300°C, a high N2O selectivity
is observed when C3H6 is used, and near half of the N2O emission occurs during the storage
phase in lean condition.
1. Introduction
One possible way to reduce NOx emissions from diesel and lean-burn engines is the use of a NOx storage reduction (NSR) catalyst [1]. It works mainly in lean condition. NOx are then oxidized on precious metals and stored on basic compounds, mainly as nitrates. Periodically, the catalyst is submitted to rich conditions for a few seconds and the stored NOx are reduced into N2 on the precious metals. Among the disadvantages of this system, the selectivity of the
reduction may be problematic. Indeed, an incomplete reduction leads to the formation of N2O,
a powerful greenhouse gas. The N2O emission is usually observed at low temperatures
(200-300°C), whereas it tends to become zero at a higher temperature (400°C). Another by product can also be observed when a high reduction level is achieved, namely NH3. Both N2O and NH3
production during the NSR process must obviously be proscribed.
Both NH3 and N2O can be observed during the NOx reduction [ 2,3,4,5,6,7]. Ammonia
formation is favored when H2 is used as reducer [8,9] whereas N2O is obtained with CO as
reducer [4,10]. In fact, the on-board reducer is coming from the gasoline/Diesel fuel and, the NSR catalyst is finally submitted to a mixture of hydrocarbons, CO and H2 with various
compositions.
The objective of this work is to study the influence of the reducer on the selectivity of the NOx reduction during the NSR process, with a special consideration to the N2O selectivity. The
examined reducers are C3H6, CO and H2. They were added separately in the rich pulses, as well
as during the lean periods, in order to obtain a representative automotive exhaust gas. In this study, the catalyst was made of platinum (2.12%) supported over a ceria-zirconia based oxide, with the aim to evaluate a rhodium free catalyst.
2. Experimental part 2.1 Catalyst preparation
The support used in this work is a ceria-zirconia based oxide provided by Rhodia. It would be denoted CZ in this study. Platinum (2.12wt%) was impregnated at pH=10 using a Pt(NH3)2(NO2)2 aqueous solution. After drying, the catalyst was pre-treated at 500°C for 4h
under synthetic air in order to stabilize Pt before the final hydrothermal treatment at 700°C for 25h (synthetic air and 10% H2O). The obtained catalyst is noted Pt/CZ and exhibits BET
specific surface area of 82 m2g-1. 2.2. Specific surface measurement
Micromeritics apparatus. Prior to the measurement, the samples were treated at 250°C under vacuum for 8 h in order to eliminate the adsorbed species.
2.3. XRD analysis
X-ray powder diffraction was performed at room temperature with a Bruker D5005 using a Kα Cu radiation (λ=1.54056 Å). The powder was deposited on a silicon monocrystal sample holder. The crystalline phases were identified by comparison with the ICDD database files.
2.4. Hydrogen chemisorption
Metal accessibility was determined on Pt/CZ catalyst with a Micromeritics AutoChem II instrument. Typically, 200 mg of sample were reduced in hydrogen flowing (30 mL min-1) at 400°C for 1h, then purged in ultrapure Ar (30 mL min-1) for 2h and cooled down to room temperature. Pulses of H2 (0.5347 mL) were injected at -80°C, every minute up to saturation
(HC1). A new series of pulses was injected over the sample, after 10 min of purging under pure Ar, in order to determine the reversible part of the chemisorbed hydrogen (HC2). The irreversible part was taken as HC = HC1 – HC2.
2.5. NOx storage capacity (NSC) measurement
Before measurements, the catalyst (70mg) was firstly pretreated in situ for 15 min at 500°C, under a 10% O2, 10% H2O, 10% CO2 and N2 mixture, and then cooled down to 400°C with the
same mixture. The catalyst was then submitted to 4% CO, 1.33% H2, 10% H2O, 10% CO2 and
N2 for 15min and cool down to 200°C under the same mixture. After a purge under N2, the
sample was then submitted to 500ppm NO, 10% O2, 10% H2O, 10% CO2 and N2 mixture. For
measurements at 300°C and 400°C, the catalyst is treated in reducing mixture during the increase of the temperature. The total flow for the whole procedure is constant at 20 L.h-1. The gas flow was introduced using mass-flow controllers, except for H2O which was introduced
using a saturator. Gas analysis (NO, NO2) was performed by a Multigas MKS 2030 analyzer
(FTIR). Long time storage is not representative of the NSR catalyst working conditions, since the lean periods are commonly around 1 min. The NOx storage capacity was then estimated by the integration of the recorded profile for the first 60 seconds, equal to the lean periods of the NSR test in cycling conditions (see below). The contribution of the reactor volume was subtracted. With the conditions used in this test, 99.2 µmol NOx per gram of catalyst were injected in 60s. The NOx storage fraction is then defined as follows:
NOx storage fraction (%) = 100xNOx stored (µmol/g) / 99.2
saturation (usually after about 900s). 2.6. NOx conversion in cycling conditions
Before measurement, the catalyst (70mg) was treated in situ 15 min at 500°C under the full gas lean mixture, displayed on Table 1. The sample was then cooled down to 200°C under the same mixture. The NOx conversion was studied in cycling condition by alternatively switching between lean (60s) and rich (4s) conditions using electro-valves. The lean and rich gas compositions are described in Table 1. Most gases (NO, NO2, N2O, NH3, CO, CO2, C3H6 …)
were analyzed using a Multigas FTIR detector (MKS 2030), except H2 which was analyzed by
mass spectrometry. NOx reduction into N2 is calculated assuming no other N-compounds than
NO, NO2, N2O and NH3, neither HNCO which was never detected. For each tested temperature
(200, 300 and 400°C), the activity of the catalyst was followed until stabilization and calculations were done taking into account ten cycles after stabilization.
Supplementary tests were carried out with a simplified gas mixture, i.e. with only one reducing compound (C3H6 or CO or H2), but with the same reducer/oxidant ratio as used with the
complete gas mixture (Table 1). The reductant/oxidant ratio is calculated using equation (1), and corresponds to 0.017 and 3.35 for the lean and the rich gas mixture, respectively.
red/ox = (9*[C3H6]+[CO]+[H2]) / ([NO]+2[O2]) (1)
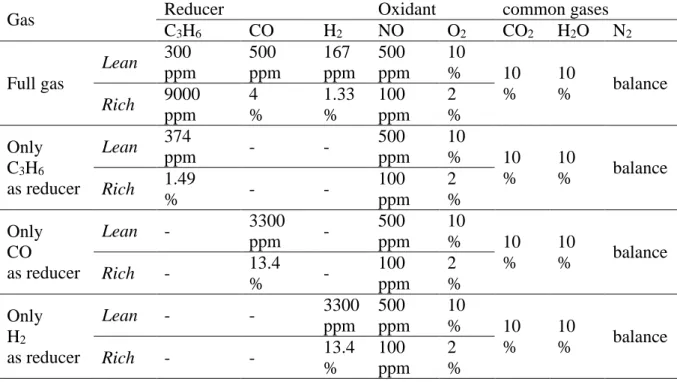
Table 1: rich and lean gas compositions used for the NOx conversion test (60s lean/4s rich).
Total flow rate: 20L h−1 (SV= 200.000 h-1). The redox ratio is constant at 0.017 at 3.35 in lean and rich gas mixture, respectively.
Gas Reducer Oxidant common gases
C3H6 CO H2 NO O2 CO2 H2O N2 Full gas Lean 300 ppm 500 ppm 167 ppm 500 ppm 10 % 10 % 10 % balance Rich 9000 ppm 4 % 1.33 % 100 ppm 2 % Only C3H6 as reducer Lean 374 ppm - - 500 ppm 10 % 10 % 10 % balance Rich 1.49 % - - 100 ppm 2 % Only CO as reducer Lean - 3300 ppm - 500 ppm 10 % 10 % 10 % balance Rich - 13.4 % - 100 ppm 2 % Only H2 as reducer Lean - - 3300 ppm 500 ppm 10 % 10 % 10 % balance Rich - - 13.4 % 100 ppm 2 %
2.7. Selective catalytic reduction (SCR) tests
The SCR experiments were performed with various lean conditions as reported in Table 1. Before measurement, catalyst (70mg) was treated in situ 15 min at 500°C under the chosen lean mixture. The N-compounds concentration (NOx, N2O, NH3) were recorded from 500°C down
to 200°C under the same mixture.
3. Results and discussion
3.1. Chemical surface properties
The chemical surface properties of catalysts were characterized using XRD analysis, BET surface area, H2-chemisorption and H2-TPR.
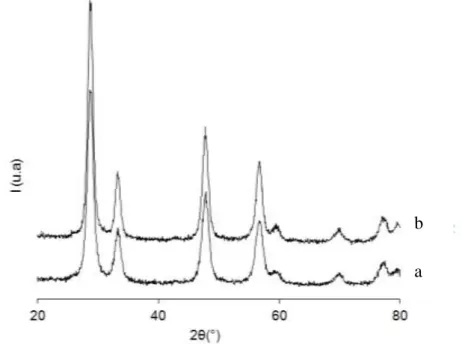
XRD patterns of the CZ support and the Pt-impregnated catalyst are reported in Figure 1. XRD phase analysis of CZ mixed oxide shows the presence of only single phase solid solutions with a ceria cubic fluorite-like structure. In accordance with Damyanova and coll. [11], the main XRD peaks of mixed ceria-zirconia oxide are detected at 2= 28.8, 47.7 and 56.5°. The average particle size deduced from the Scherrer equation is between 7.5 and 7.9 nm, in agreement with ceria-zirconia oxides with similar specific surface areas [12].
The Pt impregnation step usually leads to barium leaching when BaO/Al2O3 supports are used. XRD
experiments show that BaCO3 and especially BaAl2O4 are significantly affected in aqueous
media [9,13]. On the contrary, no change is observed by XRD analysis with the Pt/CZ catalyst, and no other diffraction peaks assigned to platinum or other compound is detected.
Figure 1: X ray diffractograms of CZ (a) and Pt/CZ (b) catalysts.
a b
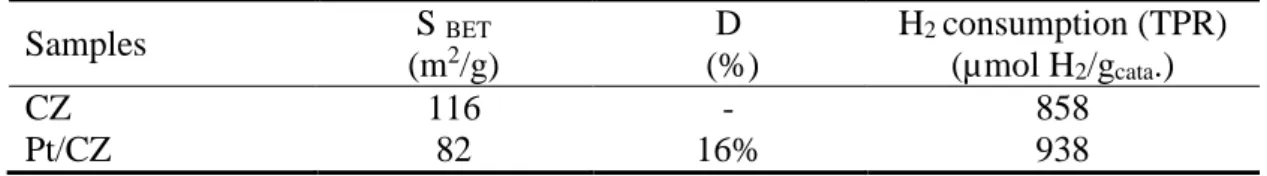
Table 2: Specific surface area, Pt dispersion and hydrogen consumption measured from TPR
experiments (25-800°C temperature range) for CZ and Pt/CZ catalysts after hydrothermal treatment at 700°C. Samples S BET (m2/g) D (%) H2 consumption (TPR) (µmol H2/gcata.) CZ 116 - 858 Pt/CZ 82 16% 938
Figure 2: H2-TPR profiles of CZ (full line) and Pt/CZ (dotted line) samples.
Table 2 shows the BET surface area of the samples before and after the platinum impregnation step, and the platinum dispersion which was obtained by hydrogen chemisorption. Before platinum impregnation, the ceria-zirconia-based support exhibited a specific surface area of 116 m²/g. A drop of SBET close to 30% is observed after Pt impregnation. From the hydrogen
chemisorption measurement, the platinum dispersion is appraised to 16%, which corresponds to particle size of 6.2 nm.
Figure 2 displays the H2 temperature programmed reduction (TPR) profiles for CZ and Pt/CZ
samples. Concerning the support without metal, maximum hydrogen consumption is observed close to 600°C, with a shoulder at much lower temperature (380°C). The reducibility behaviors of ceria and ceria-zirconia mixed oxides have been extensively studied in the literature. As described by Yao et al. [14], the reduction of pure ceria typically occurs in two steps: bulk reduction occurs above 800-900°C, while surface shell reduction step takes place at lower temperature (400–550°C). With the incorporation of zirconia, a part of the bulk reduction occurs with the surface reduction step [15]. Depending on the Zr loading and the specific surface area, the reduction process of CeO2-ZrO2 mixed oxides split into two features, namely
a low temperature step reduction (400–600°C), and a higher temperature peak, around 900°C [16].
After platinum addition, a main reduction peak is observed at around 150°C. It corresponds to the platinum reduction, but mainly to the easily reducible CeIV reduction in CeIII. In fact,
addition of 2.12% of platinum facilitates the “surface” reduction step. However, the H2
consumption in the 25-800°C temperature range is not really affected by the platinum addition (table 2).
3.2. NOx storage capacities (NSC)
The NOx storage capacities were measured at 200, 300 and 400°C in lean mixture containing H2O and CO2. The fractions of storage for 60s are reported in Table 3, as well as the NO2/NOx
ratio calculated at saturation.
The NOx storage capacity is rather limited, less than half of the introduced NOx for the first 60s are trapped (41-48%), with a maximum storage rate 300°C. In the same time, the NO oxidation rate, estimated by the NO2/NOx ratio after saturation, also exhibits a maximum at
300°C, at 64%. It decreases to 54% at 400°C but it corresponds to the thermodynamic limitation at this temperature. These relatively high NO2/NOx ratios indicate that the storage may be
limited by a lack of basic sites able to store NOx. Note that this catalyst is strongly dependant of a reducing pretreatment applied in this study before the NOx storage measurements. If the sample is not firstly submitted to a reducing atmosphere, the NO oxidation rate is strongly lower, especially at 200°C, as already reported for ceria-zirconia oxides [15]. However, it was also showed that this low NO oxidation rate is partially compensated by the participation of the oxygen from the support in order to store NOx.
Table 3: Pt/CZ catalyst: percentage of stored NOx for 60s (NOx storage fraction; inlet:
500ppm NO, 10% O2, 10% H2O, 10% CO2 and N2, 200mL/min) and NO2/NOx ratio after
saturation.
Temperature test 200°C 300°C 400°C
NOx storage fraction (%) 41 48 45
NO2/NOx (%) 41 64 54
3.3. NSR efficiency
In the literature, the NOx storage-reduction efficiency is often discussed toward model Pt/BaAl catalysts, or with simplified gas mixture. The particularity of this work is that reducers are also present in the lean mixture, as well as oxidant in the rich mixture (Table 1), awarding to this study applied conditions very close to the automotive exhaust gas.
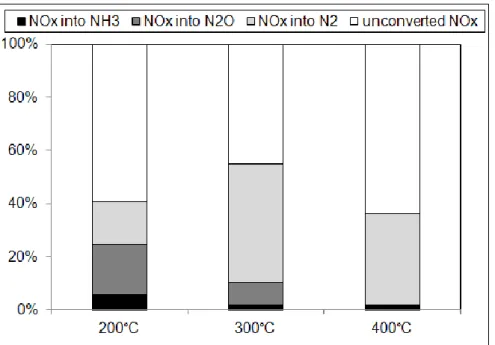
Figure 3: Pt/CZ catalyst (70mg): NOx storage/reduction efficiency test at 200, 300 and 400°C
with C3H6+CO+H2 reducers.
Results at 200°C, 300°C and 400°C (Figure 3) show that the NOx conversion depends on the temperature, with a maximum efficiency obtained at 300°C. These results are consistent with the NOx storage fraction for 60s (Table 3), which reveals a higher amount of stored NOx at this temperature. NOx storage fraction and corresponding NOx reduction rate are rather close, contrary to previous results obtained with less complex mixtures, for which the NOx storage fraction was higher than the NOx reduction rate [9]. However, reactions involved in the NSR process with more complete mixtures are more complex than only storage during lean period and then reduction in rich condition. This point is discussed in section 3.5. Anyway, the observed NOx conversion is not selective into nitrogen, with significant emissions of NH3 and
especially N2O. These by-products yields decrease with temperature. In fact, the lower N2
selectivity is always obtained at 200°C. Ammonia is supposed to be easily oxidized into N2, or
it can be used for the NOx reduction in a second catalytic bed [17]. Finally, except for the higher temperature (i.e 400°C), the main problematic by-product detected from this experiments remains N2O, which is a powerful greenhouse gas (300 times more potent than CO2).
In the next part of this work, the NOx storage-reduction efficiency was firstly focused at 300°C, with a special attention in the nature of reducers which should favor the N2O emission.
3.4. Influence of reducer toward N2O emission
In this section, the efficiency and the selectivity of the NSR catalyst was investigated using only one reducer (the same) in both lean and rich gas mixtures. For all the experiments, the
reducer/oxidant ratio was kept constant and corresponds to 0.017 and 3.35 for lean and rich mixture, respectively. The concentration of each reducer (C3H6, CO or H2) was adjusted
consequently, as reported in Table 1. Results are presented in Figure 4.
A B
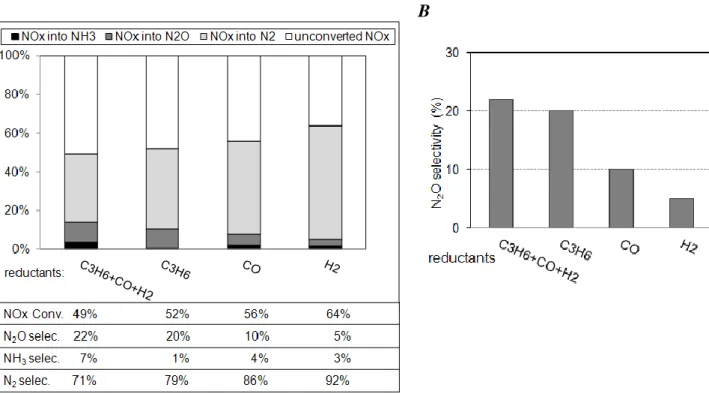
Figure 4: Pt/CZ catalyst (70mg): NOx removal efficiency (A) and N2O selectivity (B) obtained
at 300°C depending on the introduced reducer(s) (same in both lean and rich gas mixture).
As presented previously in Figure 3, with the whole of reducers (C3H6+CO+H2), the NOx
conversion at 300°C is close to 50%, with a high N2O selectivity (22%). Ammonia is also
detected (7% of selectivity). When only propylene is used as reducer (1.49 % and 374 ppm in rich and lean periods, respectively), the NOx conversion remains nearly constant (Figure 4A), as well as the N2O selectivity. On the contrary, NH3 selectivity dramatically drops to 1%. The
ammonia selectivity reaches 4% and 3% with carbon monoxide or hydrogen as single reducer, respectively. In fact, the formation of ammonia is related to the presence of H2, which is also
detected when CO is the only reducer. It was attributed to the water gas shift (WGS) reaction CO + H2O CO2 + H2. Then, pulses of H2 are detected during the CO rich pulses,
corresponding to an average H2 concentration of 2.37% during the rich pulses. Note that the
reverse WGS also occurs when only H2 is introduced as reducer, leading to significant CO
formation (average CO concentration: 202ppm, with maximum of 503ppm during the rich pulses). Finally, even if only H2 or CO is introduced, both H2 and CO are detected at 300°C. In
addition, thermodynamic calculations were performed at 300°C for WGS reaction equilibrium. Considering 10% H2O, 10% CO2, 2% O2 and 13.4% CO as initial mixture, the thermodynamic
equilibrium leads to concentrations of 1.7% CO and 7.7% H2. With H2 as reducer (13.4%), CO
and H2 concentrations at equilibrium (300°C) are 0.15% and 9.25%, respectively. However, the
NOx conversion grows when CO and especially H2 are used as reducer (Figure 4A).
In addition to the WGS equilibrium, which influences the real reducing mixture, the steam reforming of C3H6 also occurs, but only from 300°C. Indeed, using only C3H6 as reducer,
emissions of CH4, CO and H2 are detected during the rich pulses. At 300°C, taking into account the whole lean/rich cycles, the average concentrations for CH4, CO and H2 are 97ppm, 136ppm and 1.5%, respectively. Using the C3H6+CO+H2 mixture, the mean CH4 concentration reaches 66 ppm. Over emissions of CO and H2 are also detected, but they are not evaluable since both reducers are introduced in the inlet mixture, and they are supposed to be reactive. Finally, whatever the introduced reducer, CO and H2 are always detected at 300°C. This can explain the possible formation of
ammonia when only C3H6 is introduced as reducer.
The Figure 4B reports the N2O selectivity function of the nature of the reducer used for the
NOx reduction in cycling condition. It appears that N2O is detected whatever the nature of
reducer. However, the main compound responsible for the N2O emission is clearly propylene.
The N2O selectivity reaches 20%, compared with 10% and 5% with CO and H2, respectively.
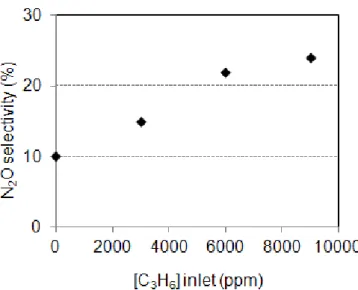
Indeed, the N2O selectivity was evaluated in regard of the propylene concentration in the rich
pulses (Figure 5). For these experiments, the amount of reducer in the rich gas mixture is balanced with hydrogen in order to keep the reducer/oxidant ratio constant. The lean period is composed of only propylene (374ppm), in order to have similar reducer in both mixtures. Figure 5 shows that N2O emission is clearly related with the propylene concentration in the rich pulses.
However, when the rich gas composition does not contain propylene but hydrogen alone, the N2O selectivity is still quite high, with about 10%. It is higher than the 5% previously observed
when hydrogen is the only introduced reducer both in lean and rich mixtures (Figure 4). Similar experiments were thus performed without any reducers in the lean pulses. In this case, results presented in Table 4 show that the N2O emission in the global NSR cycles dramatically
decreases from 10% to 4%. It strongly suggests that NOx reduction also occurs during the lean period, leading to N2O formation.
Figure 5: Pt/CZ catalyst : N2O selectivity in function of propylene concentration in the rich
pulses at 300°C. The reducer/oxidant ratio was kept constant using H2.
Table 4: NOx storage-reduction efficiency and selectivity over Pt/CZ using only H2 in the rich
pulses: test with or without C3H6 in lean mixture.
3.5. Discussion
Results presented previously indicate that N2O is also produced during the lean period. In the
NSR process, the NOx storage phase has been studied extensively in the literature. But, as far as we known, the NOx reduction activity of NSR sample during the lean storage phase is not described. Some nitrous oxide formation recorded during NSR cycles experiments are detailed in Figure 6. Based on these results, the distribution of N2O formation during each gas mixture,
namely lean and rich, has been evaluated at 300°C and reported in Table 5. Different behaviors are observed in function of reducer. When propylene is used as reducer, the N2O selectivity in
NSR cycles reaches 20% at 300°C (Figure 4B) and it appears that around half of N2O is
produced during the lean mixture (Table 5). Similar ratio is observed with H2 but the nitrous
oxide selectivity during NSR cycles is only about 5% (Figure 4B). On the contrary, 90% of the N2O emission occurs during the rich pulses when carbon monoxide is the used as reducer
(global N2O selectivity at around 10%).
Finally, it appears that an important amount of N2O can be produced during the lean phase,
depending on the nature of the reducer. To our knowledge, these observations are never discussed in the literature. In fact, usually, no reducers are present during the NOx storage phase.
Introduced reducer Rich (4s) 13% H2 (%) Lean (60s) 300ppm C3H6 /
NSR efficiency Selec. N2O (%) 10 4 NOx conv. (%) 75
Table 5: Pt/CZ catalyst: distribution of N2O emission between lean and rich mixtures during
the NSR cycles.
200°C 300°C
Lean Rich Lean Rich
C3H6 78% 22% 45% 55%
CO 13% 87% 10% 90%
H2 78% 22% 60% 40%
Figure 6: Pt/CZ catalyst: N2O profiles recorded during NSR cycles at 300°C with C3H6 ( ) or
CO ( ) or H2 ( ) as reducer.
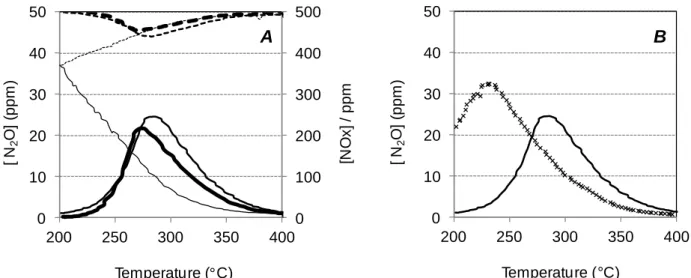
Figure 7: NOx reduction in lean mixture depending on the used reducer
(A) NOx conversion (dotted line) and N2O emission (full line) for:
( , ): (500ppm NO + 10% O2) + (300 ppm C3H6 + 500ppm CO + 167ppm H2)
( , ): (500ppm NO + 10% O2) + (3300 ppm H2)
( , ): (500ppm NO + 10% O2) + (374 ppm C3H6)
(B) N2O emission using (500ppm NO + 10% O2) + (374 ppm C3H6) mixture
( ): fresh catalyst
(): catalyst previously tested in NSR cycled conditions at 400°C
0 20 40 60 0 10 20 30 40 50 60 70 80 O u le t N 2 O ( p p m ) Time (s) 0 100 200 300 400 500 0 10 20 30 40 50 200 250 300 350 400 [N O x] / p p m [ N 2 O ] (p p m ) Temperature ( C)° 0 10 20 30 40 50 200 250 300 350 400 [ N 2 O ] (p p m ) Temperature ( C)° B A 0 100 200 300 400 500 0 10 20 30 40 50 200 250 300 350 400 [N O x] / p p m [ N 2 O ] (p p m ) Temperature ( C)° 0 10 20 30 40 50 200 250 300 350 400 [ N 2 O ] (p p m ) Temperature ( C)° B 0 100 200 300 400 500 0 10 20 30 40 50 200 250 300 350 400 [N O x] / p p m [ N 2 O ] (p p m ) Temperature ( C)° 0 100 200 300 400 500 0 10 20 30 40 50 200 250 300 350 400 [N O x] / p p m [ N 2 O ] (p p m ) Temperature ( C)° 0 10 20 30 40 50 200 250 300 350 400 [ N 2 O ] (p p m ) Temperature ( C)° B 0 10 20 30 40 50 200 250 300 350 400 [ N 2 O ] (p p m ) Temperature ( C)° B A
In order to obtain more information concerning the NOx conversion and the N2O formation
during the lean phase, Pt/CZ catalyst was tested using a selective catalytic reduction (SCR) type test. Experiments were performed using the same gas mixture than the lean gas compositions of the NSR test as reported in Table 1 (mixture of reducers, or each reducer separately). Firstly, near no NOx reduction is observed with CO as reducer, with a maximum of 2~3 ppm of N2O
emitted (results not shown), in accordance with Figure 6 and Table 5 which indicate nearly no N2O emission during the lean periods with this reducer. Results obtained with other reducers
are reported in Figure 7A and show that the NOx conversion in excess of oxygen can be effective but depends on the temperature as well as the nature of reducer. With the whole reducers (C3H6+CO+H2), the NOx conversion reaches about 10% at 270°C, corresponding to a
maximum N2O emission of 22ppm (bold line, Figure 7A). Interestingly, when propylene is used
as single reducer, results are very similar. The maximum NOx conversion (about 12%) is then obtained at 283°C, and 24 ppm of N2O are emitted. These results are in accordance with the
literature. For instance, Kotsifa et al. [18], have investigated the selective catalytic reduction of NO by propylene over platinum catalysts supported on various metal oxide supports (Al2O3,
CeO2, ZrO2...). Authors concluded that the catalytic performance of catalyst may be improved
by proper selection of the support. With alumina, N2 and N2O yields pass through maxima at
270°C. Activities of Pt/CeO2 catalysts are qualitatively similar to that supported on alumina,
especially for the Tmax conversion (i.e 270°C).
NOx conversion is likewise effective with H2 as reducer, but mainly at lower temperature. In
fact, maximum NOx conversion is obtained at 200°C (27%), with the formation of about 37ppm of N2O. Then, both NOx conversion and N2O concentration significantly decrease with
temperature. Finally, note that ammonia emission is never observed in lean condition.
To conclude, the N2O formation in lean condition strongly depends on the nature of the reducer
but also of the temperature. The SCR test shows that Pt/CZ catalyst is not efficient to reduce NOx by CO in excess of O2. In fact, the observed N2O selectivity is essentially due to the rich
pulses, in accordance with results reported in Table 5. However, H2 and C3H6 exhibit very
different behaviors depending on the temperature. Concerning C3H6, no N2O emission is
observed at 200°C and 400°C, and a maximum is observed at about 283°C. On the contrary, hydrogen favors the nitrous oxide emission for the lower temperatures. These behaviors suggest different impact of each reducer on the N2O selectivity at 200°C. Then, the influence of the
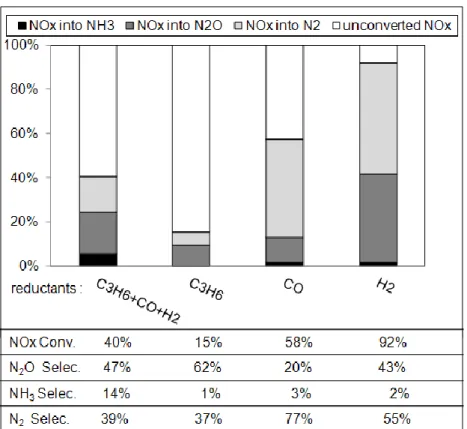
Figure 8: Pt/CZ catalyst (70mg): NOx removal efficiency obtained at 200°C depending on the
introduced reducer(s) (same in both lean and rich gas mixtures).
Figure 8 reports the NOx efficiency, as well as the selectivity in nitrogen containing products at 200°C, depending of the introduced reducer(s) for NSR experiments. It clearly appears that the higher NOx conversion, associated to the higher N2O emission, is observed with hydrogen.
The global NOx conversion is thus about 92%, and the corresponding selectivity into N2O
reaches 43%. As reported previously, the nitrous oxide formation is not only due to the NOx reduction which occurs during rich pulses. The distribution of N2O formation in each periods
(i.e. lean and rich) is reported and Table 5. It confirms that the nitrous oxide formation is enhanced in the lean period with hydrogen at 200°C, according with light-off curves reported in Figure 7.
As expected, using only CO as reducer, the lean periods do not significantly participate to the N2O emission. When only C3H6 is used, the NOx reduction rate is low at 200°C, but the N2O
selectivity is rather high. Quantification of the N2O emission during the rich and lean periods
(Table 5) shows that a large amount of the N2O occurs during the lean phases, in opposition
with the SCR profile reported in Figure 7. Actually, the catalyst behavior at 200°C is strongly dependant of the previous redox treatment, as previously mentioned in section 3.2 about the NOx storage measurement. In fact, Pt/CZ is not active at 200°C in the NSR test if this
measurement is carried out after the in situ pretreatment at 500°C for 15 min under the lean mixture (Table 1). On the contrary, NOx reduction activity is observed at 200°C if the catalyst is previously evaluated under redox cycles at 300 or 400°C. In parallel, SCR test in lean mixture over Pt/CZ catalyst previously submit to NSR tests at 400°C leads to a significant NOx reduction activity at 200°C (Figure 7B). The measured N2O concentration at 200°C is then
consistent with that observed during the lean periods of the NSR test.
However, in opposition with results obtained at 300°C for which similar activities are obtained using C3H6 or mixture of C3H6+CO+H2 (Figure 4A), results of NSR cycles reported in Figure
8 at 200°C with the whole reducers indicates that the influence of C3H6 is rather nil. It indicates
that the adsorption competition between the three reducers strongly varies with the temperature. Propylene is the main active NOx reducer at 300°C, whereas behavior at 200°C suggests the participation of the three reducers.
Finally, whatever the temperature (200 or 300°C), it is confirmed that the formation of N2O is
enhanced by the presence of reducer during the lean periods, due to the NOx reduction activity in excess of oxygen. It depends of both on the temperature test and the nature of the reducer.
4. Conclusion
This study puts in evidence the possible problem of N2O emission during the NSR process. In
fact, the production of N2O during the NSR cycles is function of both the used reducer(s) and
the temperature test. Particularly, it appears in this study that presence of reducer in the lean gas mixture can lead to a competition between the NOx storage and the NOx reduction in excess of oxygen. Depending on temperature and reducer, near half of N2O can be produce during the
lean periods, in accordance with results obtained during specific catalytic tests to study the NOx reduction in excess of O2 (SCR type tests). At 300°C, the responsible for the N2O emission are
CO ≥ C3H6 > H2 for the rich periods, and C3H6 > H2 > CO (0) for the lean periods. The
influence of the nature of the reducer is different at 200°C: CO > H2 ≥ C3H6 for the rich periods,
and H2 > CO ≥ C3H6 (0) for the lean periods. However, the catalytic behavior at 200°C of the
Pt/CZ material strongly depends on the atmosphere pretreatment.
Finally, the nitrous oxide production at 200°C is mainly favored by hydrogen, whereas the most part the N2O emission at 300°C is attributed to propylene. These results point out the influence
Acknowledgement
The Authors thank the French Ministry of Economy, Finance and Industry for its financial support (FUI contract n° 08 2 90 6669 NOSICA)
References
[1] T. Kobayashi, T. Yamada, K. Kayano, SAE Technical Papers 970745 (1997) 63.
[2] I. Nova, L. Lietti, L. Castoldi, E. Tronconi and P. Forzatti, J. Catal. 239 (2006), 244–254. [3] Z. Liu and J.A. Anderson, J. Catal. 224 (2004) 18-27.
[4] H. Abdulhamid, E. Fridell, M. Skoglundh, Top. Catal. 30/31 (2004) 161-168. [5] L. Castoldi, I. Nova, L. Lietti, P. Forzatti, Catal. Today 96 (2004) 43-52.
[6] I. Nova, L. Castoldi, L. Lietti, E. Tronconi, P. Forzatti, Catal. Today 75 (2002) 431–437. [7] I. Nova, L. Lietti, P. Forzatti, Catal. Today 136 (2008) 128-135.
[8] N. Le Phuc, X. Courtois, F. Can, S. Berland, S. Royer, P. Marecot, D. Duprez, Catal. Today 176 (2011) 424-428.
[9] N. Le Phuc, X. Courtois, F. Can, S. Royer, P. Marecot, D. Duprez, Appl. Catal. B 102 (2011) 353–361.
[10] E.C. Corbos, M. Haneda, X. Courtois, P. Marecot, D. Duprez, H. Hamada, Appl. Catal. A 365 (2009) 187-193.
[11] S. Damyanova, C.A. Perez, M. Schmal, J.M.C. Bueno, Appl. Catal. A: Gen. 234 (2002) 271-282.
[12] N. Le Phuc, E.C. Corbos, X. Courtois, F. Can, P. Marecot, D. Duprez, Appl. Catal. B 93 (2009) 12-21
[13]G .W. Graham, H.W. Jen, H.W. Theis, R.W. McCabe, Catal. Lett. 93 (2004) 3–6. [14] H.C. Yao, Y.F.Y. Yao, J. Catal. 86 (1984) 254-265.
[15] S. Overbury, D. Huntley, D. Mullins, G. Glavee, Catal. Lett. 51 (1998) 133-138
[16] F. Fally, V. Perrichon, H. Vidal, J. Kaspar, G. Blanco, J.M. Pintado, S. Bernal, G. Colon, M. Daturi, J.C. Lavalley, Catal. Today 59 (2000) 373–386
[17] T. Nakatsuji, M. Matsubara, J. Rouistenmaki, N. Sato, H. Ohno, Appl. Catal. B 77 (2007) 190-201
[18] A. Kotsifa, D.I. Kondarides, X. E. Verykios, Appl. Catal. B 80 (2008) 260–270