HAL Id: hal-00298324
https://hal.archives-ouvertes.fr/hal-00298324
Submitted on 12 Jun 2007HAL is a multi-disciplinary open access
archive for the deposit and dissemination of sci-entific research documents, whether they are pub-lished or not. The documents may come from teaching and research institutions in France or abroad, or from public or private research centers.
L’archive ouverte pluridisciplinaire HAL, est destinée au dépôt et à la diffusion de documents scientifiques de niveau recherche, publiés ou non, émanant des établissements d’enseignement et de recherche français ou étrangers, des laboratoires publics ou privés.
Effects of drought ? altered seasonality and low rainfall ?
in net ecosystem carbon exchange of three contrasting
Mediterranean ecosystems
J. S. Pereira, J. A. Mateus, L. M. Aires, G. Pita, C. Pio, V. Andrade, J.
Banza, T. S. David, A. Rodrigues, J. S. David
To cite this version:
J. S. Pereira, J. A. Mateus, L. M. Aires, G. Pita, C. Pio, et al.. Effects of drought ? altered seasonality and low rainfall ? in net ecosystem carbon exchange of three contrasting Mediterranean ecosystems. Biogeosciences Discussions, European Geosciences Union, 2007, 4 (3), pp.1703-1736. �hal-00298324�
BGD
4, 1703–1736, 2007 Effects of drought on carbon balance J. S. Pereira et al. Title Page Abstract Introduction Conclusions References Tables Figures ◭ ◮ ◭ ◮ Back CloseFull Screen / Esc
Printer-friendly Version Interactive Discussion
EGU
Biogeosciences Discuss., 4, 1703–1736, 2007 www.biogeosciences-discuss.net/4/1703/2007/ © Author(s) 2007. This work is licensed
under a Creative Commons License.
Biogeosciences Discussions
Biogeosciences Discussions is the access reviewed discussion forum of Biogeosciences
Effects of drought – altered seasonality
and low rainfall – in net ecosystem carbon
exchange of three contrasting
Mediterranean ecosystems
J. S. Pereira1, J. A. Mateus2, L. M. Aires3, G. Pita2, C. Pio3, V. Andrade1, J. Banza1, T. S. David4, A. Rodrigues4, and J. S. David1
1
Instituto Superior de Agronomia, Universidade T ´ecnica de Lisboa, Tapada da Ajuda, 1349-017 Lisboa, Portugal
2
Instituto Superior T ´ecnico, Universidade T ´ecnica de Lisboa, Av. Rovisco Pais, 1049-001 Lisboa, Portugal
3
CESAM & Department of Environment, University of Aveiro, 3810-193 Aveiro, Portugal
4
Estac¸ ˜ao Florestal Nacional, Quinta do Marqu ˆes, 2780-159 Oeiras, Portugal Received: 13 April 2007 – Accepted: 23 May 2007 – Published: 12 June 2007 Correspondence to: J. S. Pereira ([email protected])
BGD
4, 1703–1736, 2007 Effects of drought on carbon balance J. S. Pereira et al. Title Page Abstract Introduction Conclusions References Tables Figures ◭ ◮ ◭ ◮ Back CloseFull Screen / Esc
Printer-friendly Version Interactive Discussion
EGU Abstract
Droughts cause reductions in gross primary production (GPP) and also in net ecosys-tem exchange (NEE), contributing to most of the inter-annual variability in terrestrial carbon sequestration. In seasonally dry climates (Mediterranean) droughts result from reductions in annual rainfall and from changes in rain seasonality. In western Iberia, the
5
hydrological-year (i.e., from October to September) of 2004–2005 was extremely dry, with precipitation 50% below the long-term mean (691 mm in 1961–1990), but 2005– 2006 was normal. We compared the carbon fluxes measured by the eddy covariance technique from three contrasting ecosystems in southern Portugal: an evergreen oak woodland (savannah-like) with ca. 21 % tree cover; a Mediterranean C3/C4 grassland;
10
and a coppiced eucalyptus plantation. During the dry hydrological-year of 2004–2005, NEE was lowest, the highest sink strength was in the eucalypt plantation (NEE = – 399 g C m−2year−1) as compared to the oak woodland (NEE = –88 g C m−2 year−1), and the grassland (NEE = +49 g C m−2 year −1). The latter was a source of carbon
dioxide. The NEE values of the dry year were, however, much lower than those for
wet-15
ter years, e.g. NEE = –861 g C m−2 year −1 in 2002–2003 in the eucalypt plantation. The NEE of the grassland and the oak savannah in the 2005–2006 hydrological-year, with annual precipitation above the long term mean, were –190 and –120 g C m −2 year−1, respectively. All ecosystems studied increased their rain-use efficiency (GPP per unit of rain volume) increased in dry years. In the case of annual vegetation –
20
grassland and low tree density woodland, however - rain-use efficiency decreased with severe drought. However, this was more pronounced in the eucalypt plantation due to greater GPP and the use of deep soil water resources. Although both calendar years of 2004 and 2005 had equally low rainfall, the effect of drought on the eucalypt plantation was delayed until the second dry year. This suggests that the effects of water deficits
25
on Mediterranean forests are exacerbated by prolonged droughts when long-term soil water reserves are depleted. The grassland, however, was more vulnerable and re-sponded faster to water deficits. This effect of drought was less pronounced in the oak
BGD
4, 1703–1736, 2007 Effects of drought on carbon balance J. S. Pereira et al. Title Page Abstract Introduction Conclusions References Tables Figures ◭ ◮ ◭ ◮ Back CloseFull Screen / Esc
Printer-friendly Version Interactive Discussion
EGU
woodland due to the sparse tree cover.
1 Introduction
The accounting of carbon sequestration requires the adequate knowledge of inter and intra-annual variation in ecosystem carbon exchange with the atmosphere. Droughts are major contributors to the inter-annual variability in terrestrial carbon sequestration
5
as they cause large reductions in gross primary productivity (GPP) as well as in net ecosystem exchange (NEE) of terrestrial ecosystems (Ciais et al., 2005; Granier et al., 2007; Pereira et al., 2006). Although this is true for most terrestrial biomes, it is especially relevant in seasonally dry climates where there is often a great variability in precipitation.
10
In Mediterranean climates, low precipitation in summer is coupled to high atmo-spheric evaporative demand, which reduce moisture availability to plants and produc-tivity during the dry season (Reichstein et al., 2002; Pereira et al., 2006). In such climates, plant life cycles are tuned to a given rain periodicity. If the dry season lasts too long, there might be a severe water stress in living plants or a change in life cycle
15
of annual plants. In recent years, both the shape of the seasonal cycle of precipitation and the frequency of droughts changed dramatically in western Iberia, namely Portugal (Paredes et al., 2006).
It is well known that the Mediterranean is a hotspot for climate change (Giorgi, 2006). The most likely future climate scenarios for the western and central regions
20
of the Iberian Peninsula point towards a longer dry season, with a strong negative rain anomaly in spring-summer and a positive anomaly in autumn (Miranda et al., 2006). A decrease in March precipitation is already going on since the early 60’s (Paredes et al., 2006), implying a longer dry season. This may affect negatively the capacity for plant carbon assimilation as a result of lower photosynthetic rates induced by water
25
stress in perennials and shorter life span of annual plants. Therefore, understanding the sensitivity of ecosystems to drought has been one of the main challenges over the
BGD
4, 1703–1736, 2007 Effects of drought on carbon balance J. S. Pereira et al. Title Page Abstract Introduction Conclusions References Tables Figures ◭ ◮ ◭ ◮ Back CloseFull Screen / Esc
Printer-friendly Version Interactive Discussion
EGU
past few years.
The objectives of this work was to compare gas exchange and carbon sequestration in three contrasting ecosystems in southern Portugal: an evergreen oak woodland (savannah-like) with low tree density, a Mediterranean grassland and a eucalyptus plantation. These are representative components of the landscape, which consists
5
of a highly humanized mosaic of different ecosystems typical of southern Europe. The evergreen oak woodlands are widely distributed in the Iberian Peninsula, as well as in other areas with Mediterranean climate, e.g., in parts of California (Baldocchi et al., 2004). In the Iberian Peninsula, large areas (approximately 1.1 Mha in Portugal) of these woodlands form a multiple use agroforestry system, called montado in Portugal
10
and dehesa in Spain. The other two types are also representative, with grasslands covering ca. 100 000 ha and the coppiced eucalypt plantations 743 000 ha in Portugal (country area 92 391 km2).
The comparison, based upon continuous eddy covariance measurements, focused on the analysis of these contrasting vegetation types under the same climate.
Addition-15
ally we could analyse the impact of an outstanding dry spell (2004 and 2005) vis- `a-vis years of “normal” rainfall (2003 and 2006). The 2004–2005 hydrological-year (i.e., from October to September of the next calendar year) was characterized by extreme dry weather over most of western Europe. The southern half of Iberia received roughly 40% of the usual precipitation between October 2004 and June 2005. This was the
20
driest episode in the last 140 years, with negative impacts on agriculture and natural ecosystems, in both, Portugal and Spain (Garcia-Herrera et al., 2007). The contrasting characteristics of the three ecosystems studied and the occurrence of the outstanding drought of 2004–2005, provided a good framework to better understand the effects of drought on ecosystem carbon balance.
BGD
4, 1703–1736, 2007 Effects of drought on carbon balance J. S. Pereira et al. Title Page Abstract Introduction Conclusions References Tables Figures ◭ ◮ ◭ ◮ Back CloseFull Screen / Esc
Printer-friendly Version Interactive Discussion
EGU
2 Materials and methods
2.1 Site description, climate and vegetation
This study is part of the CarboEurope-IP project. The experimental sites (Table 1) are in the same region of Portugal, approximately at 38◦ latitude N and 8◦ longitude W. The sites of Tojal and Mitra are located at short distance (8 km) from each other,
5
near ´Evora, and the Espirra station is near the town of Peg ˜oes, 63 km west from Mitra. The climate is typically Mediterranean, with a hot and dry summer. Most precipitation occurs between October and April. Long-term (1961–1990) mean annual temperature was 15–16◦C and average annual precipitation ca. 691 mm for ´Evora (montado and
grassland) and 709 mm for Peg ˜oes (Espirra; eucalypt plantation).
10
Each of the flux measuring sites belongs to a major landscape component of the region. The Mitra station is in the middle of a landscape dominated by evergreen oak woodlands, Quercus ilex ssp. rotundifolia and Quercus suber, on the “Alentejana” plain, with low altitude (220–250 m) and gentle slopes with soils derived from granite rock. The understorey consists of grazed pasture dominated by herbaceous annuals, which
15
die-out by the end of spring (May) and shrubs. The open grassland of Tojal is located at the same altitude and has the same climate as Mitra. It has a plant cover consisting of C3 annuals (grasses, legumes and forbs) with one invasive C4 grass Cynodon dactylon (L.) Pers. The measuring station of Espirra is in a 300 ha Eucalyptus globulus plantation tended as a coppice. Originally planted in 1986 with 3 m×3 m spacing, ca. 1100 trees
20
ha−1, was, during this experiment, in the second coppice rotation.
Some of the plant canopy characteristics are shown in Table 1. They ranged from a tall evergreen canopy with negligible undergrowth – the eucalyptus plantation of Espirra – to the low, seasonal, canopy of herbaceous plants of the Tojal, or the more complex structure of the savannah-like evergreen oak woodland – Mitra. The latter has a
two-25
layer plant cover with scattered trees with ca. 21% of tree canopy cover (Carreiras et al., 2006). The estimated tree cover contribution for total leaf area index (LAI) was ca. 0.55 (Jarvis et al., 2007). The LAI varied intra-annually, reaching their maxima in
BGD
4, 1703–1736, 2007 Effects of drought on carbon balance J. S. Pereira et al. Title Page Abstract Introduction Conclusions References Tables Figures ◭ ◮ ◭ ◮ Back CloseFull Screen / Esc
Printer-friendly Version Interactive Discussion
EGU
the spring of normal rainfall years and the yearly minima in autumn. There was also an inter-annual variation. The length of the growing season varied among the sites. The grassland was seasonal as the oak woodland undergrowth. At the other extreme was the evergreen eucalyptus coppice. To facilitate comparisons between ecosystems we calculated leaf area duration (LAD) as the integral of leaf area index (LAI) along the
5
year on a yearly basis (m2year m−2).
The three systems differed in the intensity and type of land management. In 2006 the coppiced eucalypt plantation reached the end of the 12-year rotation, and tim-ber was harvested by the end of the year. The estimated biomass (above ground) 6.15 kg C m−2, of which 4.85 kg C m−2are in long lasting wood (Sofia Cerasoli, private
10
communic.). The oak woodland is in a 300 ha estate adjacent to the Herdade da Mitra, owned by the University of ´Evora. It has a grazed undergrowth with 0.2 cows ha−1 on average. The Tojal grassland was grazed every year during autumn and early winter (only during autumn in 2005), one or two times per week with a stocking density of 60 sheep ha−1. The grass is normally harvested once per year. Nevertheless, the drought
15
in 2005 led to a very low biomass production and, thereby, there was no harvest. In 2006, the harvest occurred in the 24 May and amounted to ca. 3.7 t dry matter ha−1.
2.2 Field measurements
Standard Meteorological data on rainfall, solar radiation, net radiation, wind speed and direction, wet and dry bulb temperatures were collected continuously since the
begin-20
ning of the project and were available in 30 min time steps for two localities: ´Evora (Mitra and Tojal) and Espirra. The annual summaries for the Mitra site are in Table 2. Values for Espirra were similar to those of Mitra.
Surface fluxes of CO2, water vapour and energy were measured by eddy covariance. The basic equipment for these measurements was installed in each site at the top of
25
metallic towers (Table 3). In all cases automatic weather stations were included. The flux of CO2was measured continuously at 20 Hz sampling rate by the eddy covariance systems (Table 3). To test the representativeness of the data in the case of the
het-BGD
4, 1703–1736, 2007 Effects of drought on carbon balance J. S. Pereira et al. Title Page Abstract Introduction Conclusions References Tables Figures ◭ ◮ ◭ ◮ Back CloseFull Screen / Esc
Printer-friendly Version Interactive Discussion
EGU
erogeneous oak savannah canopy, a footprint analysis based on a forward Lagrangian model was performed in Mitra under different stability conditions. It showed the suitabil-ity of the eddy-covariance method, with the footprint isolines well within the intended surface cover type (L. Siebicke, T. Markkanen and T. Foken, private communication). Net ecosystem exchange rate (NEE) was directly calculated from flux data, meaning
5
the net flux of CO2from the atmosphere to the ecosystem in the eddy-covariance tower
footprint. A negative value of NEE means a gain in carbon by the ecosystem, i.e., a positive net ecosystem productivity (NEP), as it may be assumed NEP to equal –NEE. In Mitra, continuous measurements of tree transpiration were also done using sap flow sensors (Granier method) with 2 cm long probes, since the beginning of the
10
project, in 4 trees of Quercus ilex ssp. rotundifolia and 3 Q. suber trees – see David et al. (2004) and David et al. (2007) for details. This technique allowed us to sep-arate tree transpiration from the whole ecosystem evapotranspiration (ET). The data are presented on a land area basis, which was calculated expanding from tree crown projection to ground area, taking into account the crown cover fraction within the tower
15
footprint.
2.3 Flux data processing and computation
The raw data from the eddy-covariance measurements were processed off-line us-ing the software Eddyflux (Meteotools, Jena, Germany). The fluxes of carbon dioxide (NEE) were determined, on a half-hourly basis (block averaging), by the eddy
covari-20
ance method as the mean covariance between fluctuations in vertical wind speed and the carbon dioxide concentration (Baldocchi, 2003). A planar fit coordinate rotation (Wilczak et al., 2001) for wind components was performed for the Espirra and Mitra data, calculating the angle for the rotation of the vertical wind component in an annual basis. In Tojal, a natural wind 2-D coordinate rotation (McMillen, 1988) was performed
25
for every averaging period. A time lag for each averaging period was determined in order to maximise the covariance between vertical wind velocity and carbon dioxide signal from the gas analyser. The calculations also included spike detection and
re-BGD
4, 1703–1736, 2007 Effects of drought on carbon balance J. S. Pereira et al. Title Page Abstract Introduction Conclusions References Tables Figures ◭ ◮ ◭ ◮ Back CloseFull Screen / Esc
Printer-friendly Version Interactive Discussion
EGU
moval, similar to Vickers and Mahrt (1997), checking for instantaneous records exceed-ing realistic absolute limits and Shotanus/Liu correction (Shotanus et al., 1983; Liu and Peters, 2001) for sonic temperature and sensible heat flux. In addition, the air density fluctuations were taken into account to correct the fluxes of carbon dioxide (Webb et al., 1980) of the Tojal and Espirra sites, where an open-path analyser was used. The
5
fluxes of the Mitra site were corrected for the damping loss of the closed-path analyser at high frequencies (Eugster and Senn, 1995). A CO2 storage term, calculated for
one point measurement according to Greco and Baldocchi (1996) was added to the estimated NEE for both, Espirra and Mitra data.
2.4 Data quality control, gap-filling and flux partitioning
10
The quality of all primary data was guaranteed by a routine equipment calibration and comparison with data from close stations. To exclude non-representative 30-min mea-surements of carbon dioxide flux, the following screening criteria were applied: first, fluxes were excluded if the friction velocity (u∗) was below the threshold of 0.2 m s−1, for the Espirra and Mitra sites, and 0.08 m s−1, for the Tojal site. The u
∗threshold was
15
determined graphically by plotting the nighttime NEE as a function of u∗(e.g. Anthoni et al., 2004); second, fluxes were removed if the mean vertical velocity deviation to zero was higher than what would be considered as normal for each site, following the same principle as in Rebmann et al. (2005); third, fluxes were excluded if the high frequency spikes replaced or the absolute limits violations exceeded 1% of the total records of
20
any of the three components of wind velocity and/or CO2concentration.
Here we followed the 3 flags scheme (Mauder and Foken, 2004): 0, 1 and 2, in which 0 represents data of highest quality, to use in fundamental research, 1 data for use in long term observation programs and 2 data that should not be considered and, hence, substituted by gap filling. Data rejected after the filtering process was flagged 2.
25
The remaining data were subsequently submitted to integral turbulence characteristics (of the vertical wind) and stationarity tests, and flagged as 0, 1 or 2 according to the results.
BGD
4, 1703–1736, 2007 Effects of drought on carbon balance J. S. Pereira et al. Title Page Abstract Introduction Conclusions References Tables Figures ◭ ◮ ◭ ◮ Back CloseFull Screen / Esc
Printer-friendly Version Interactive Discussion
EGU
Total data gaps during the whole study period, due to missing and rejected data, were about 56%, 57% and 42% for the Espirra, Mitra and Tojal sites, respectively. Gap filling and flux-partitioning methods proposed by Reichstein et al. (2005) were used to fill data gaps and to separate the net ecosystem exchange (NEE) into gross primary production (GPP) and ecosystem respiration (Reco), respectively.
5
2.5 Data analysis
We estimated the NEE, GPP and Reco from 2003 through 2006, except for Tojal, which was installed later and had data only after the autumn of 2004. We analyzed the data at different time scales: seasonally, as well as in terms of hydrological-years, i.e., the period between the 1 October and the 30 September of next year, because it was a
10
good frame for plant life cycle and productivity in the Mediterranean region: germination of annuals in autumn, fast growth of herbage and tree flushing in spring, slowdown of biological activity in summer. In this work, calendar years will be called year whereas hydrological-years will be specifically identified as such. Seasonal data are presented as monthly averages or 3-months sums (rainfall), with e.g., winter corresponding to
15
January + February + March. To compare use of resources by the ecosystems we calculated gross ecological light use efficiency, LUEecol, expressed in mmol CO2 per
mol incident photosynthetically active radiation (mmol mol−1) (Gilmanov et al., 2007)
and rain-use-efficiency as RUE = GPP/precipitation (gC L−1) (Lauenroth et al., 2000; Huxman et al., 2004). Both are expressed as monthly averages.
20
3 Results and discussion
3.1 Meteorological conditions during the experiment
The meteorological conditions were monitored from 2002 to 2006 in ´Evora – Mitra and Espirra. They followed the same patterns in both locations. Since ´Evora-Mitra had a
BGD
4, 1703–1736, 2007 Effects of drought on carbon balance J. S. Pereira et al. Title Page Abstract Introduction Conclusions References Tables Figures ◭ ◮ ◭ ◮ Back CloseFull Screen / Esc
Printer-friendly Version Interactive Discussion
EGU
longer data set we reported the data for this location (Table 2), unless stated otherwise. Figure 1 shows the anomaly of mean seasonal rainfall in relation to the long-term average (1961–1990) throughout the experiment. Roughly, 2003 was about “normal”, 2004 and 2005 were two consecutive very dry years, with annual rainfall amounting to 73 and 65% of long-term local average, respectively. Moreover, the seasonal rain
5
pattern in 2005 was unusual because winter rainfall was extremely low (only 12% of the long-term mean), but autumn rainfall was 51% higher than average. The hydrological-year of 2005–2006 was wetter than average.
3.2 Homogeneity of flux data between sites
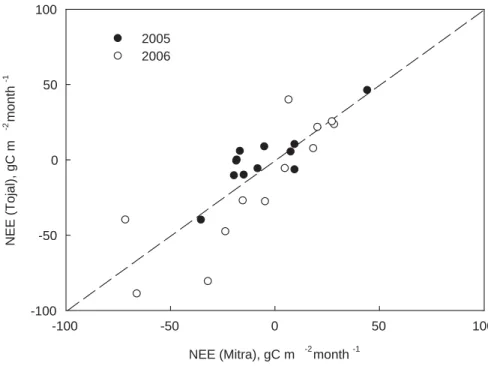
First we compared the NEE data of the two grassland dominated sites (the oak
savan-10
nah of Mitra and the Tojal grassland) for homogeneity. Figure 2 illustrates the similarity of monthly totals between these two neighbor sites in ´Evora in 2005 and 2006. The regression line was not significantly different from the 1:1 line, suggesting that the dy-namics of the oak savannah was indeed similar to that of the grassland. The degree of similitude was remarkable considering that, although Mitra and Tojal are not far apart,
15
the measurement methods used in each site were quite different (Table 3) and the tower footprint much larger in Mitra than in Tojal. A reasonable correlation coefficient for a linear regression was also obtained when the data from Espirra were compared to Mitra (r2=0.56).
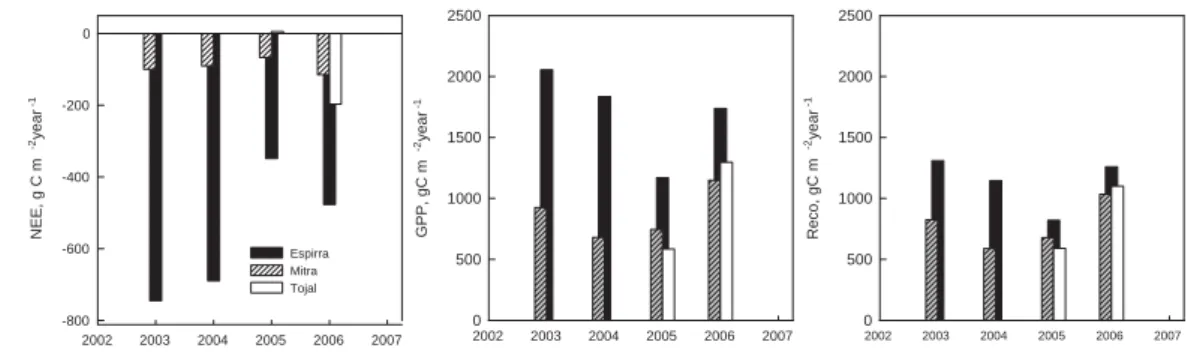
3.3 Inter-annual variation
20
Figure 3 shows the inter-annual variation in NEE, GPP and Reco for the 3 sites. The yearly carbon balance of the eucalypt plantation was systematically a net flux of CO2 from the atmosphere to the vegetation and soil. The highest NEP (negative NEE) oc-curred in the wetter hydrological-year of 2002–2003 with NEE = –861 g C m−2year−1. In the dry hydrological-year of 2004–2005 the NEE of the eucalypt plantation was,
nev-25
BGD
4, 1703–1736, 2007 Effects of drought on carbon balance J. S. Pereira et al. Title Page Abstract Introduction Conclusions References Tables Figures ◭ ◮ ◭ ◮ Back CloseFull Screen / Esc
Printer-friendly Version Interactive Discussion
EGU
hydrological-year of 2005–2006 was humid (high rainfall, 635 mm, starting in the au-tumn of 2005 with heavy rain – see Fig. 1), the tree plantation did not fully recover from the 2005 drought, as GPP remained below the values of 2002–2003. The oak wood-land was a much weaker sink for carbon with a NEE of –86 g C m−2 year−1 in 2003– 2004, but it fully recovered from drought after 2005, reaching –120 g C m−2 year−1 in
5
2005–2006. Likewise, the Tojal grassland had a NEE of –190 g C m−2year−1in 2005– 2006 counteracting the 2004–2005 tendency, when it was a source for carbon (NEE = +49 g C m−2 year−1). In 2004–2005 Mitra was a weak sink for carbon (NEE = –
88 g C m−2 year−1).
These results compare well with other values and variability of flux measures of
10
carbon sequestration. For example, the NEE of the coppiced eucalypt plantation com-pares with that of a Pinus pinaster stand in Bordeaux, –570 g C m−2 year−1(Berbigier et al., 2001) and a short rotation coppice of poplar in Belgium, –620 g C m−2 year−1 (Deckmyn et al., 2004). Plantations sequestered carbon faster than average as it was estimated that European forests sequestered annually 124 g C m−2year−1, with a
vari-15
ation coefficient of 62% (Janssens et al., 2003). The oak woodlands had a population of mature trees, but due to its low tree cover Mitra had NEE values lower than a series of central and northern European mature forest stands: NEE between ca. –500 and –138 g C m−2 year−1 (Kowalski et al., 2004). On the other hand, a group of European grasslands in the CarboEurope network, had an average NEE of –150 g C m−2year−1,
20
with a maximum of –654 g C m−2 year−1. Nevertheless, some grasslands were net sources, up to +163.6 g C m−2 year−1, in the arid part of the climatic gradient studied, such as Tojal during the 2005 drought (Gilmanov et al., 2007). Likewise in a Mediter-ranean grassland in California NEE was –132 g C m−2year−1, in one year but changed to a carbon source in the following year +29 g C m−2year−1(Xu and Baldocchi, 2004).
25
3.4 Difference between vegetation types
Annual GPP changes linearly with absorbed photosynthetically active radiation (APAR) (Russell et al., 1989). The differences between ecosystems can be ascribed to either
BGD
4, 1703–1736, 2007 Effects of drought on carbon balance J. S. Pereira et al. Title Page Abstract Introduction Conclusions References Tables Figures ◭ ◮ ◭ ◮ Back CloseFull Screen / Esc
Printer-friendly Version Interactive Discussion
EGU
differences in ecophysiological LUEecol (the slope of the relation between GPP and
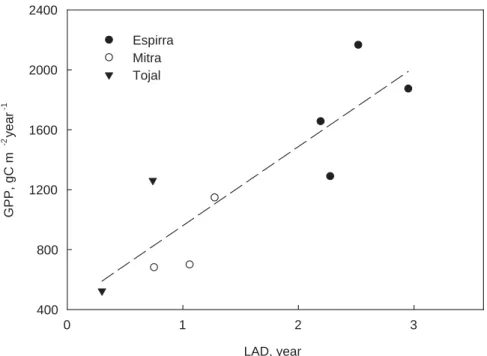
APAR), or in APAR itself. As incident solar radiation was nearly the same in the three sites the differences in APAR were related to leaf area index (LAI) and the length of the growing season or, better, to leaf area duration (LAD) (Palmroth et al., 2006). In all cases the minimum estimated LAD occurred in 2005. In Tojal it was 0.3 m2*year m−2
5
in 2005 and increased to 0.74 m2 *year m−2 in 2006, whereas in Mitra was 0.74 m2 *year m−2in 2005 and nearly 1 to 1.3 m2 *year m−2 otherwise. The LAD of the tree plantation was highest, ranging from 2.7 m2*year m−2in wet years to 1.9 m2*year m−2 in the dry year of 2005. In spite of differences in photosynthetic capacity there was a linear relationship between GPP and LAD (Fig. 4), thus suggesting that APAR was
10
indeed the leading factor in differentiating between vegetation types. For example, the evergreen nature of the eucalyptus canopy and high tree density allowed a high LAI to be maintained over the whole year and, therefore elevated GPP.
The grassland and the montado lose their herbaceous canopies in summer. As-suming that the oak canopy LAD was 0.55 m2*year m−2, the value of the LAD for the
15
grassland and for the Mitra woodland undergrowth in 2005, were similar. In Mitra, the grass cover may account for up to 70% of the maximum LAI in spring, but is reduced to near zero in summer. Trees, however, continued to photosynthesize through the summer as discussed below. A similar situation happened in Tojal in summer but as a result of the activity of a sole C4 grass, C. dactylon, which maintained some
photosyn-20
thesis in summer. Its contribution for the seasonal carbon balance was, nevertheless, not enough to compensate for the larger Reco (L. Aires, private communication).
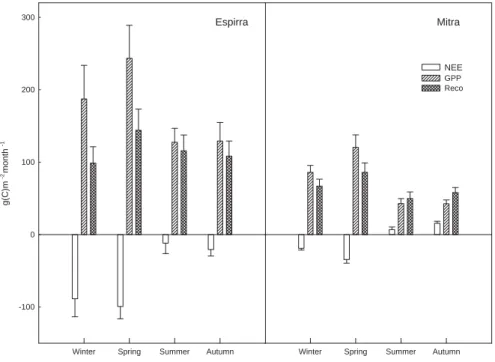
3.5 Seasonality of ecosystem gas exchange
There was a marked seasonality in ecosystem gas exchange (Fig. 5). In general, the maximum productivity (GPP) and NEE occurred in spring. In summer, water deficits
25
caused stomatal closure and leaf senescence and therefore a generalized drop in GPP. Upon soil rewetting in autumn there is a vegetation recovery towards winter. However, in summer and autumn, both the grassland and the oak woodland became carbon
BGD
4, 1703–1736, 2007 Effects of drought on carbon balance J. S. Pereira et al. Title Page Abstract Introduction Conclusions References Tables Figures ◭ ◮ ◭ ◮ Back CloseFull Screen / Esc
Printer-friendly Version Interactive Discussion
EGU
sources, as Reco exceeded GPP (Fig. 5). The reasons for that were a low leaf area displayed, low photosynthetic activity in the leaves due to ageing and stress (heat as well as water) and, by the end of the summer or the beginning of autumn, a large carbon efflux due to the rewetting of the dry soil (Jarvis et al., 2007).
The oak woodland was intermediate between the grassland and the tree plantation,
5
in terms of the response to drought, with trees playing a conservative role. The differ-ences between the two ecosystems (Mitra and Tojal) might be ascribed to the continued carbon assimilation throughout the summer by the oak trees (Chaves et al., 2002) due to their deep rooting systems (David et al., 2004; Kurz-Besson et al., 2006; David et al., 2007). The possibility to separate tree transpiration from water vapor exchange of
10
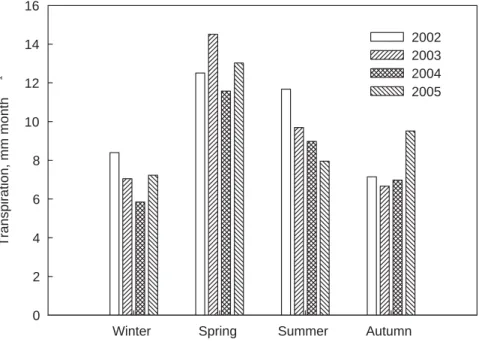
the whole ecosystem, ET, allowed us to test the hypothesis that due to their deep root systems oak trees remain with their stomata open for a fraction of each day, even in summer, when most other vegetation is absent or with closed stomata. Figure 6 illus-trates that trees maintain a restricted (in relation to the prevailing evaporative demand of the air) but fairly high transpiration rate in summer, reaching 0.3 mm day−1 on a
15
ground area basis (we considered that tree crowns only cover 21% of the total ground area). The yearly tree transpiration (sap flow) was ca. 18% of the rainfall in normal years but it rose to 29% in 2005. David et al. (2007) showed that in Mitra in 2001– 2003, although predawn leaf water potential decreased substantially, trees maintained a considerable transpiration during the summer. By that time, more than 70% of the
20
transpired water was taken from groundwater sources. 3.6 The effect of drought
Drought, viewed as a shortage in precipitation, often coupled to high evaporative de-mand, which reduces moisture availability in a way that will affect negatively the normal functioning of ecosystems (Pereira et al., 2006), was the main factor inducing
inter-25
annual variation in carbon fluxes. In general, the eucalypt stand sustained a high NEP (negative NEE) functioning as a carbon sink. The stand could even withstand the rain-fall shortage of the calendar year of 2004 without a great change in NEE. However, the
BGD
4, 1703–1736, 2007 Effects of drought on carbon balance J. S. Pereira et al. Title Page Abstract Introduction Conclusions References Tables Figures ◭ ◮ ◭ ◮ Back CloseFull Screen / Esc
Printer-friendly Version Interactive Discussion
EGU
second year of the drought sequence, led to a strong decline in GPP and the tree plan-tation became temporarily (summer) a source of carbon for the first time, during this study. A similar situation of insensitivity (or drought avoidance) was clearly observed in the oak trees, which kept the stomata partly open during the dry part of the 2004– 2005 hydrological-year. This suggests that the effects of drought on Mediterranean
5
sclerophyllous trees occur mainly after the depletion of the deep soil and ground water reserves, as most species have deep rooting habits (Canadell et al., 1996; David et al., 2007; Schenk and Jackson, 2005).
The differences between ecosystems in terms of vulnerability are related to root depth and canopy extension: the eucalypt plantation could delay stress through the
10
use of a large volume of soil, but they depend on the regularity of winters to recharge deeper soil water. Its vulnerability is shown by the delayed recovery after the severe drought of 2005 (Fig. 3). The grassland plants are most vulnerable to drought as they are strict drought avoiders, which have their life cycle tuned to the duration of soil water abundance. On the other hand, the low tree density of the savannah-type ecosystems
15
puts low pressure on groundwater, so that trees may withstand longer sequences of dry years than closed canopy forests.
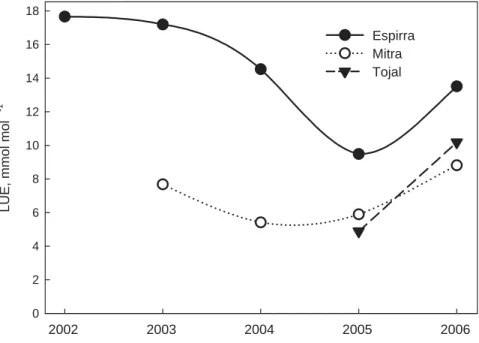
Ecological light-use efficiency (LUEecol) provides a good way of evaluating the
ef-fects of environmental stress on ecosystem carbon balance as it integrates physiolog-ical as well as structural ecosystem characteristics (Gilmanov et al., 2007). First, the
20
LUEecol values in Fig. 7 are in agreement with those reported for a variety of
ecosys-tems (Gilmanov et al., 2005). As it would be expected, the eucalypt plantation canopy was almost twice as efficient (on average) as the oak savannah in normally wet years. But the LUEecol also varied seasonally, being lowest in summer and highest in
win-ter. The high winter LUEecol values resulted from photosynthetic photon flux densities
25
(PPFD) that are below the canopy saturation. Moreover, in winter a greater proportion of PAR is diffuse due to the large number of overcast days. Diffuse light is photosyn-thetically more efficient than direct light. The latter can account for increases of up to 42% in daily ratio of production per unit of absorbed PAR (Rosati and DeJong, 2003).
BGD
4, 1703–1736, 2007 Effects of drought on carbon balance J. S. Pereira et al. Title Page Abstract Introduction Conclusions References Tables Figures ◭ ◮ ◭ ◮ Back CloseFull Screen / Esc
Printer-friendly Version Interactive Discussion
EGU
The subsequent declines in LUEecol result from excess light and, as we approach the
summer, more severe plant water deficits that limit carbon assimilation rates and lower LAI. Due to less dramatic seasonal changes in LAI, the proportion of summer vs. winter LUEecol was less in the eucalypt stand than in the other two ecosystems.
The Fig. 7 also shows the dramatic effect of the 2005 drought on LUEecol and
illus-5
trates the delayed response to drought of the tree plantation in 2005, by comparison with the immediate response of the grassland. Nevertheless, as often found, water was the most limiting resource to both the tree stands and the other systems (e.g., Stape et al., 2004; Granier et al., 2007; Chaves et al., 2004).
3.7 Rain use efficiency
10
One simple way of assessing the efficiency of use of local water resources is the quan-tification of rain-use-efficiency (RUE) (Huxman et al., 2004; Lauenroth et al., 2000; Pereira et al., 2006). As it may be expected, RUE declines as water supply increases (see the lower RUE in winter in Fig. 8) (Loustau et al., 2001; Huxman et al., 2004). In humid regions and during the Mediterranean wet seasons, this decline results from
15
precipitation being normally above potential evapotranspiration (PET) and therefore not all the water available being used.
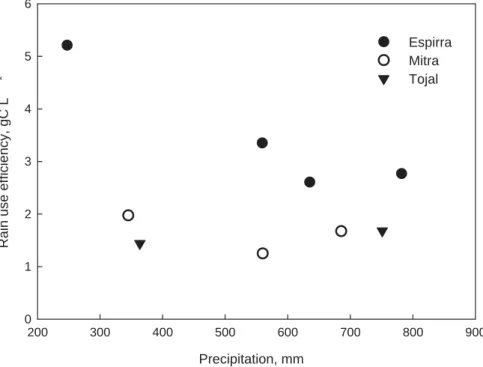
Natural vegetation appears to converge (at the biome level) towards the same max-imum RUE in the driest years in the region, when water is the major limiting resource (Huxman et al., 2004). In our experimental sites, however, the opposite occurred
20
(Fig. 9). Whereas in eucalypt plantation, the trees were able to extract water from deeper soil horizons, the Mediterranean grasslands do not tolerate water deficits and die. This means that RUE of grasslands in seasonally dry environments may be lower because they will waste rain at the beginning of the growth period as leaf area and carbon assimilation will not develop at once (Lauenroth et al., 2000). For similar
rea-25
sons, they do not use water from isolated rain pulses, especially if they occur at long intervals. This will affect negatively the capability to use water and will reduce the RUE. If the climate change scenarios hold true, or for that matter the present tendencies
BGD
4, 1703–1736, 2007 Effects of drought on carbon balance J. S. Pereira et al. Title Page Abstract Introduction Conclusions References Tables Figures ◭ ◮ ◭ ◮ Back CloseFull Screen / Esc
Printer-friendly Version Interactive Discussion
EGU
prevail (Miranda et al., 2006; Paredes et al., 2006), this might be a strong limitation to carbon sequestration and nutrient cycling (Jarvis et al., 2007).
3.8 Single rainfall events
The timing of rainfall and the extent of the dry season as well as the regime of rain pulses largely determine ecosystem productivity (Schwinning et al., 2004). This is
5
illustrated by the consequences of single rainfall events in the summer or early autumn which may lead to large carbon losses (see Fig. 10). As shown for many locations today, the rewetting of dry soils by the first rains leads to a quick mineralization of soil organic matter and carbon loss (Jarvis et al., 2007). This net carbon loss may be a waste for ecosystem functioning because at the time of its occurrence active
10
plant roots are scarce to trap and store the nutrients made available by organic matter mineralization (Pereira et al., 2004) and annual plants are not there to compensate for carbon losses through photosynthesis.
4 Conclusions
The severe drought of 2004 and 2005, led to a generalised decline in gross primary
15
production and carbon sequestration in all the systems studied. In that hydrological-year, the grassland had a net loss of carbon from the ecosystem to the atmosphere. The evergreen tree plantation, displaying a large LAD and the capability of exploring a larger soil volume for water uptake during the summer, was less vulnerable to moderate drought than herbaceous canopies. Even in the Mediterranean oak savannahs trees
20
may function as stabilising elements keeping some gas exchange throughout the sum-mer. The tree plantation was, however, vulnerable to prolonged drought as it reached the lowest net ecosystem productivity in the second dry year.
BGD
4, 1703–1736, 2007 Effects of drought on carbon balance J. S. Pereira et al. Title Page Abstract Introduction Conclusions References Tables Figures ◭ ◮ ◭ ◮ Back CloseFull Screen / Esc
Printer-friendly Version Interactive Discussion
EGU References
Anthoni, P. M., Freibauer, A., Kolle, O., and Schulze, E. D.: Winter wheat carbon exchange in Thuringia, Germany, Agric. Forest Meteorol., 121, 55–67, 2004
Baldocchi, D. D.: Assessing the eddy covariance technique for evaluating carbon dioxide ex-change rates of ecosystems: Past, present and future, Global Change Biol., 9, 479–492,
5
2003
Baldocchi, D. D., Xu, L. K., and Kiang, N.: How plant functional-type, weather, seasonal drought, and soil physical properties alter water and energy fluxes of an oak-grass savanna and an annual grassland, Agric. Forest Meteorol., 123, 13–39, 2004
Berbigier, P., Bonnefond, J. M., and Mellmann, P.: CO2 and water vapour fluxes for 2 years
10
above euroflux forest site, Agric. Forest Meteorol., 108, 183–197, 2001
Canadell, J., Jackson, R. B., Ehleringer, J. R., Mooney, H. A., Sala, O. E., and Schulze, E. D.: Maximum rooting depth of vegetation types at the global scale, Oecologia, 108, 583–595, 1996
Carreiras, J. M. B., Pereira, J. M. C., and Pereira, J. S.: Estimation of tree canopy cover in
15
evergreen oak woodlands using remote sensing, Forest Ecol. Manage., 223, 45–53, 2006 Chaves, M. M., Pereira, J. S., Maroco, J., Rodrigues, M. L., Ricardo, C. P. P., Os ´orio, M. L.,
Carvalho, I., Faria, T., and Pinheiro, C.: How plants cope with water stress in the field? Photosynthesis and growth, Ann. Botany, 89, 907–916, 2002
Chaves, M. M., Pereira, J. S., and Os ´orio, J.: Water use efficiency and photosynthesis. In: M.
20
Bacon (Editor), Water use efficiency in plant biology. Blackwell Publishing, London, 42–74, 2004.
Ciais, P., Reichstein, M., Viovy, N., Granier, A., Ogee, J., Allard, V., Aubinet, M., Buchmann, N., Bernhofer, C., Carrara, A., Chevallier, F., De Noblet, N., Friend, A. D., Friedlingstein, P., Grunwald, T., Heinesch, B., Keronen, P., Knohl, A., Krinner, G., Loustau, D., Manca, G.,
25
Matteucci, G., Miglietta, F., Ourcival, J. M., Papale, D., Pilegaard, K., Rambal, S., Seufert, G., Soussana, J. F., Sanz, M. J., Schulze, E. D., Vesala, T., and Valentini, R.: Europe-wide reduction in primary productivity caused by the heat and drought in 2003, Nature, 437, 529– 533, 2005
David, T. S., Ferreira, M. I., Cohen, S., Pereira, J. S., and David, J. S.: Constraints on
transpira-30
tion from an evergreen oak tree in southern Portugal, Agric. Forest Meteorol., 122, 193–205, 2004
BGD
4, 1703–1736, 2007 Effects of drought on carbon balance J. S. Pereira et al. Title Page Abstract Introduction Conclusions References Tables Figures ◭ ◮ ◭ ◮ Back CloseFull Screen / Esc
Printer-friendly Version Interactive Discussion
EGU David, T. S., Henriques, M. O., Kurz-Besson, C., Nunes, J., Valente, F., Vaz, M., Pereira, J. S.,
Siegwolf, R., Chaves, M. M., Gazarini, L. C., and David, J. S.: Water use strategies in two co-occurring Mediterranean evergreen oaks: Surviving the summer drought, Tree Physiology, 27, 793–803, 2007
Deckmyn, G., Muys, B., Garcia Quijano, J., and Ceulemans, R.: Carbon sequestration
follow-5
ing afforestation of agricultural soils: Comparing oak/beech forest to short-rotation poplar coppice combining a process and a carbon accounting model, Global Change Biol., 10, 1482–1491, 2004
Eugster, W. and Senn, W.: A cospectral correction model for measurement of turbulent no2 flux, Boundary-Layer Meteorol., 74, 321–340, 1995
10
Garcia-Herrera, R., Paredes, D., Trigo, R. M., Franco- Trigo, I., Hernandez, E., Barriopedro, D., and Mendes, M. A.: The outstanding 2004/05 drought in the iberian peninsula: Associated atmospheric circulation, J. Hydrometeorol., 9, 483–498, 2007
Gilmanov, T. G., Tieszen, L. L., Wylie, B. K., Flanagan, L. B., Frank, A. B., Haferkamp, M. R., Meyers, T. P., and Morgan, J. A.: Integration of co2 flux and remotely-sensed data for primary
15
production and ecosystem respiration analyses in the northern great plains: Potential for quantitative spatial extrapolation, Global Ecol. Biogeogr., 14, 271–292, 2005
Gilmanov, T. G., Soussana, J. F., Aires, L., Allard, V., Ammann, C., Balzarolo, M., Barcza, Z., Bernhofer, C., Campbell, C. L., Cernusca, A., Cescatti, A., Clifton-Brown, J., Dirks, B. O. M., Dore, S., Eugster, W., Fuhrer, J., Gimeno, C., Gruenwald, T., Haszpra, L., Hensen, A.,
20
Ibrom, A., Jacobs, A.F.G., Jones, M. B., Lanigan, G., Laurila, T., Lohila, A., Manca, G., Mar-colla, B., Nagy, Z., Pilegaard, K., Pinter, K., Pio, C., Raschi, A., Rogiers, N., Sanz, M. J., Stefani, P., Sutton, M., Tuba, Z., Valentini, R., Williams, M. L., and Wohlfahrt, G.: Partition-ing european grassland net ecosystem CO2 exchange into gross primary productivity and ecosystem respiration using light response function analysis Agriculture, Ecosyst. Environ.,
25
28, doi:10.1016/j.agee.2006.12.008, 2007
Giorgi, F.: Climate change hot-spots, Geophys. Res. Lett., 33, L08707,
doi:10.1029/2006GL025734, 2006
Granier, A., Reichstein, M., Breda, N., Janssens, I. A., Falge, E., Ciais, P., Grunwald, T., Aubi-net, M., Berbigier, P., Bernhofer, C., Buchmann, N., Facini, O., Grassi, G., Heinesch, B.,
30
Ilvesniemi, H., Keronen, P., Knohl, A., Kostner, B., Lagergren, F., Lindroth, A., Longdoz, B., Loustau, D., Mateus, J., Montagnani, L., Nys, C., Moors, E., Papale, D., Peiffer, M., Pile-gaard, K., Pita, G., Pumpanen, J., Rambal, S., Rebmann, C., Rodrigues, A., Seufert, G.,
BGD
4, 1703–1736, 2007 Effects of drought on carbon balance J. S. Pereira et al. Title Page Abstract Introduction Conclusions References Tables Figures ◭ ◮ ◭ ◮ Back CloseFull Screen / Esc
Printer-friendly Version Interactive Discussion
EGU Tenhunen, J., Vesala, T., and Wang, Q.: Evidence for soil water control on carbon and water
dynamics in european forests during the extremely dry year: 2003, Agric. Forest Meteorol., 143, 123–145, 2007
Greco, S. and Baldocchi, D. D.: Seasonal variations of CO2 and water vapour exchange rates over a temperate deciduoud forest, Global Change Biol., 2, 183–197, 1996
5
Huxman, T. E., Smith, M. D., Fay, P. A., Knapp, A. K., Shaw, M. R., Loik, M. E., Smith, S. D., Tissue, D. T., Zak, J. C., Weltzin, J. F., Pockman, W. T., Sala, O. E., Haddad, B. M., Harte, J., Koch, G. W., Schwinning, S., Small, E. E., and Williams, D. G.: Convergence across biomes to a common rain-use efficiency, Nature, 429, 651–654, 2004
Janssens, I. A., Freibauer, A., Ciais, P., Smith, P., Nabuurs, G. J., Folberth, G., Schlamadinger,
10
B., Hutjes, R. W. A., Ceulemans, R., and Schulze, E. D.: Europe’s terrestrial biosphere
absorbs 7 to 12% of European anthropogenic co2 emissions, Science, 300, 1538–1542,
2003
Jarvis, P. G., Rey, A., Petsikos, C., Wingate, L., Rayment, M., Pereira, J. S., Banza, J., David, J. S., Miglietta, F., Borgetti, M., Manca, G., and Valentini, R.: Drying and wetting of
mediter-15
ranean soils stimulates decomposition and carbon dioxide emission: The “birch effect”†, Tree Physiology, 27, 929–940, 2007
Kowalski, A. S., Loustau, D., Berbigier, P., Manca, G., Tedeschi, V., Borghetti, M., Valentini, R.,
Kolari, P., Berninger, F., Rannik, `E., Hari, P., Rayment, M., Mencuccini, M., Moncrieff, J., and
Grace, J.: Paired comparisons of carbon exchange between undisturbed and regenerating
20
stands in four managed forests in europe, Global Change Biol., 10, 1707–1723, 2004 Kurz-Besson, C., Otieno, D., Vale, R. L., Siegwolf, R., Schmidt, M., Herd, A., Nogueira, C.,
David, T. S., David, J. S., Tenhunen, J., Pereira, J. S., and Chaves, M.: Hydraulic lift in cork oak trees in a savannah-type Mediterranean ecosystem and its contribution to the local water balance, Plant Soil, 282, 361–378, 2006
25
Lauenroth, W. K., Burke, I. C., and Paruelo, J. M.: Patterns of production and precipitation-use efficiency of winter wheat and native grasslands in the central great plains of the United States, Ecosystems, 3, 344–351, 2000
Liu, H. P. and Peters, G.: New equations for sonic temperature variance and buoyancy heat flux with an omnidirectional sonic anemometer, Boundary-Layer Meteorol., 100, 459–468, 2001
30
Loustau, D., Hungate, B., and Drake, B.: Water, nitrogen, rising atmospheric co2 and terrestrial productivity, in: Terrestrial global productivity, edited by: Roy, J., Saugier, B., and Mooney, H. A., Academic Press, San Diego, Calif., 123–167, 2001.
BGD
4, 1703–1736, 2007 Effects of drought on carbon balance J. S. Pereira et al. Title Page Abstract Introduction Conclusions References Tables Figures ◭ ◮ ◭ ◮ Back CloseFull Screen / Esc
Printer-friendly Version Interactive Discussion
EGU Mauder, M. and Foken, T.: Quality control of eddy covariance measurements (c: 0,1,2).
CarboEurope-IP Task 1.2.2, 2004.
McMillen, R. T.: An eddy correlation technique with extended applicability to non-simple terrain, Boundary-Layer Meteorol., 43, 231–245, 1988
Miranda, P. M. A., Valente, M. A., Tom ´e, A. R., Trigo, R., Coelho, M. F. E. S., Aguiar, A.,
5
and Azevedo, E. B.: O clima de Portugal nos s ´eculos xx e xxi, in: Alterac¸ ˜oes clim ´aticas em Portugal, edited by: Santos, F. D. and Miranda, P., Cen ´arios, impactes e medidas de adaptac¸ ˜ao. Gradiva, Lisboa, 45–113, 2006.
Palmroth, S., Oren, R., McCarthy, H. R., Johnsen, K. H., Finzi, A. C., Butnor, J. R., Ryan, M. G., and Schlesinger, W. H.: Aboveground sink strength in forests controls the allocation
10
of carbon below ground and its [co 2]-induced enhancement. Proceedings of the National Academy of Sciences of the United States of America, 103(51), 19 362–19 367, 2006 Paredes, D., Trigo, R. M., Garcia-Herrera, R., and Trigo, I. F.: Understanding precipitation
changes in iberia in early spring: Weather typing and storm-tracking approaches, J. Hy-drometeorol., 7, 101–113, 2006
15
Pereira, J. S., David, J. S., David, T. S., Caldeira, M. C., and Chaves, M. M.: Carbon and water fluxes in mediterranean-type ecosystems – constraints and adaptations, in: Progress in botany, edited by: Esser, K., L ¨uttge, U., Beyschlag, W., and Murata, J., Springer-Verlag, Berlin Heidelberg, 467–498, 2004.
Pereira, J. S., Chaves, M. M., Caldeira, M. C., and Correia, A. V.: Water availability and
pro-20
ductivity, in: Plant growth and climate change, edited by: Morrison, J. I. L. and Morecroft, D., Blackwell Publishers, London, 118–145, 2006.
Rebmann, C., Gockede, M., Foken, T., Aubinet, M., Aurela, M., Berbigier, P., Bernhofer, C., Buchmann, N., Carrara, A., Cescatti, A., Ceulemans, R., Clement, R., Elbers, J. A., Granier, A., Grunwald, T., Guyon, D., Havrankova, K., Heinesch, B., Knohl, A., Laurila, T.,
Long-25
doz, B., Marcolla, B., Markkanen, T., Miglietta, F., Moncrieff, J., Montagnani, L., Moors, E., Nardino, M., Ourcival, J. M., Rambal, S., Rannik, U., Rotenberg, E., Sedlak, P., Unterhuber, G., Vesala, T., and Yakir, D.: Quality analysis applied on eddy covariance measurements at complex forest sites using footprint modelling, Theoretical Appl. Climatol., 80, 121–141, 2005
30
Reichstein, M., Tenhunen, J.D., Roupsard, O., Ourcival, J. M., Rambal, S., Miglietta, F., Peres-sotti, A., Pecchiari, M., Tirone, G., and Valentini, R.: Severe drought effects on ecosystem co2 and h2o fluxes at three mediterranean evergreen sites: Revision of current hypotheses?,
BGD
4, 1703–1736, 2007 Effects of drought on carbon balance J. S. Pereira et al. Title Page Abstract Introduction Conclusions References Tables Figures ◭ ◮ ◭ ◮ Back CloseFull Screen / Esc
Printer-friendly Version Interactive Discussion
EGU Global Change Biol., 8, 999–1017, 2002
Reichstein, M., Falge, E., Baldocchi, D., Papale, D., Aubinet, M., Berbigier, P., Bernhofer, C., Buchmann, N., Gilmanov, T., Granier, A., Grunwald, T., Havrankova, K., Ilvesniemi, H., Janous, D., Knohl, A., Laurila, T., Lohila, A., Loustau, D., Matteucci, G., Meyers, T., Migli-etta, F., Ourcival, J.-M., Pumpanen, J., Rambal, S., Rotenberg, E., Sanz, M., Tenhunen,
5
J., Seufert, G., Vaccari, F., Vesala, T., Yakir, D. and Valentini, R.: On the separation of net ecosystem exchange into assimilation and ecosystem respiration: Review and improved al-gorithm, Global Change Biol., 11, 1424–1439, 2005
Rosati, A. and DeJong, T. M.: Estimating photosynthetic radiation use efficiency using incident light and photosynthesis of individual leaves, Ann. Botany, 91, 869–877, 2003
10
Russell, G., Jarvis, P. G., and Monteith, J. L.: Absorption of radiation by canopies and stand growth. In: G. Russell, B. Marshall and P.G. Jarvis (Editors), Plant canopies. Their growth form and function, Cambridge Univ. Press, Cambridge, 21–39, 1989.
Schenk, H. J. and Jackson, R. B.: Mapping the global distribution of deep roots in relation to climate and soil characteristics, Geoderma, 126, 129–140, 2005
15
Schwinning, S., Sala, O. E., Loik, M. E., and Ehleringer, J. R.: Thresholds, memory, and seasonality: Understanding pulse dynamics in arid/semi-arid ecosystems, Oecologia, 141, 191–193, 2004
Shotanus, E. K., Nieuwstadt, F. T. M., and de Bruin, H. A. R.: Temperature measurement with a sonic anemometer and its application to heat and moisture flux, Boundary-Layer Meteorol.,
20
26, 81–93, 1983
Stape, J. L., Binkley, D., and Ryan, M. G.: Eucalyptus production and the supply, use and efficiency of use of water, light and nitrogen across a geographic gradient in brazil, Forest Ecol. Manage., 193, 17–31, 2004
Vickers, D. and Mahrt, L.: Quality control and flux sampling problems for tower and aircraft
25
data, J. Atmos. Oceanic Technol., 14, 512–526, 1997
Webb, E. K., Pearman, G. I., and Leuning, R.: Correction of flux measurements for density effects due to heat and water-vapor transfer, Quart. J. Royal Meteorol. Soc., 106, 85–100, 1980
Wilczak, J. M., Oncley, S. P., and Stage, S. A.: Sonic anemometer tilt correction algorithms,
30
Boundary-Layer Meteorol., 99, 127–150, 2001
Xu, L. K. and Baldocchi, D. D.: Seasonal variation in carbon dioxide exchange over a Mediter-ranean annual grassland in California, Agric. Forest Meteorol., 123, 79–96, 2004
BGD
4, 1703–1736, 2007 Effects of drought on carbon balance J. S. Pereira et al. Title Page Abstract Introduction Conclusions References Tables Figures ◭ ◮ ◭ ◮ Back CloseFull Screen / Esc
Printer-friendly Version Interactive Discussion
EGU
Table 1. Characterization of the ecosystems studied.
Name Vegetation, main
plant genus
LAI Vegetation
height
Soil type
Mitra Evergreen oak
wood-land: Quercus ilex
ssp. rotundifolia and
Q. suber, with
under-storey of a diversity of C3 grasses and legumes
Maxima of 2.3 in
April-May and min-ima ca. 0.7 (2005).
7.3±1.3 m Dystric Cambisol
Tojal Grassland: diversity
of C3 grasses and legumes + C4 inva-sive species 0.4 and 2.5 in 2005 and 2006. 0.4–0.5 m at peak growth Luvisol
Espirra Eucalyptus globulus
plantation
Maxima of 4.5 in
spring of normal rain-fall years and less than 3 in 2005
BGD
4, 1703–1736, 2007 Effects of drought on carbon balance J. S. Pereira et al. Title Page Abstract Introduction Conclusions References Tables Figures ◭ ◮ ◭ ◮ Back CloseFull Screen / Esc
Printer-friendly Version Interactive Discussion
EGU
Table 2. Annual climatic variables for the Mitra site.
Year Precipitation (mm) Mean annual air temperature (◦C) Global Solar Radiation (MJ m−2) 2002 765 15.3 6006 2003 706 15.9 6075 2004 488 15.8 6260 2005 434 15.7 6411 2006 808 16.1 6118
BGD
4, 1703–1736, 2007 Effects of drought on carbon balance J. S. Pereira et al. Title Page Abstract Introduction Conclusions References Tables Figures ◭ ◮ ◭ ◮ Back CloseFull Screen / Esc
Printer-friendly Version Interactive Discussion
EGU
Table 3. Location, main equipment and flux measuring tower characteristics at each of the
sites.
Name Latitude Longitude Altitude Main equipment Tower height Footprint Mitra 38◦32′N 8◦00′W 256 m R3 Gill ultrasonic anemometer
LI-7000 (Licor) closed-path IRGA
29 m, (height of sonic anemome-ter)
<800 m
Tojal 38◦28′N 8◦01′′W 190 m R3 Gill ultrasonic anemometer LI-7500 (Licor) open path IRGA
2.5 m <300 m
Espirra 38◦38′N 8◦36′′W 95 m R2 Gill ultrasonic anemometer LI-7500 (Licor) open path IRGA
BGD
4, 1703–1736, 2007 Effects of drought on carbon balance J. S. Pereira et al. Title Page Abstract Introduction Conclusions References Tables Figures ◭ ◮ ◭ ◮ Back CloseFull Screen / Esc
Printer-friendly Version Interactive Discussion
EGU
winter spring summer autumn
Rainfall anomaly (mm month
-1 ) -100 -80 -60 -40 -20 0 20 40 60 80 100 2002 2003 2004 2005 2006
Fig. 1. Deviation of mean seasonal rainfall from the long-term average (1961–1990) in Mitra
BGD
4, 1703–1736, 2007 Effects of drought on carbon balance J. S. Pereira et al. Title Page Abstract Introduction Conclusions References Tables Figures ◭ ◮ ◭ ◮ Back CloseFull Screen / Esc
Printer-friendly Version Interactive Discussion
EGU
NEE (Mitra), gC m -2month-1
-100 -50 0 50 100 NEE (Tojal), gC m -2 month -1 -100 -50 0 50 100 2005 2006
Fig. 2. Correlation between monthly averages of net ecosystem exchange (NEE) in Mitra and
BGD
4, 1703–1736, 2007 Effects of drought on carbon balance J. S. Pereira et al. Title Page Abstract Introduction Conclusions References Tables Figures ◭ ◮ ◭ ◮ Back CloseFull Screen / Esc
Printer-friendly Version Interactive Discussion EGU 2002 2003 2004 2005 2006 2007 NEE, g C m -2year -1 -800 -600 -400 -200 0 Espirra Mitra Tojal 2002 2003 2004 2005 2006 2007 GPP, gC m -2year -1 0 500 1000 1500 2000 2500 2002 2003 2004 2005 2006 2007 Reco, gC m -2year -1 0 500 1000 1500 2000 2500
Fig. 3. Annual totals of net ecosystem exchange (NEE), gross primary production (GPP) and
ecosystem respiration (Reco) during the experiment for the three sites (Espirra – eucalypt plan-tation; Mitra – oak savannah and Tojal – grassland).
BGD
4, 1703–1736, 2007 Effects of drought on carbon balance J. S. Pereira et al. Title Page Abstract Introduction Conclusions References Tables Figures ◭ ◮ ◭ ◮ Back CloseFull Screen / Esc
Printer-friendly Version Interactive Discussion EGU LAD, year 0 1 2 3 GPP, gC m -2 year -1 400 800 1200 1600 2000 2400 Espirra Mitra Tojal
Fig. 4. Relationhsip between GPP and leaf area duration (LAD) in the three experimental
sites (Espirra – eucalypt plantation; Mitra – oak savannah; and Tojal – grassland) during the experimental period (2003–2006).
BGD
4, 1703–1736, 2007 Effects of drought on carbon balance J. S. Pereira et al. Title Page Abstract Introduction Conclusions References Tables Figures ◭ ◮ ◭ ◮ Back CloseFull Screen / Esc
Printer-friendly Version Interactive Discussion
EGU
Mitra
Winter Spring Summer Autumn NEE GPP Reco Espirra
Winter Spring Summer Autumn
g(C)m -2month -1 -100 0 100 200 300
Fig. 5. Average seasonal variation of NEE, GPP and Reco for Espirra and Mitra sites during
BGD
4, 1703–1736, 2007 Effects of drought on carbon balance J. S. Pereira et al. Title Page Abstract Introduction Conclusions References Tables Figures ◭ ◮ ◭ ◮ Back CloseFull Screen / Esc
Printer-friendly Version Interactive Discussion
EGU
Winter Spring Summer Autumn
Transpiration, mm month -1 0 2 4 6 8 10 12 14 16 2002 2003 2004 2005
Fig. 6. Average seasonal variation of tree transpiration (sap flow) on a ground area basis
assuming a 21% tree crown cover (monthly averages) during part of the experimental period (2002–2005) in the oak savannah of Mitra.
BGD
4, 1703–1736, 2007 Effects of drought on carbon balance J. S. Pereira et al. Title Page Abstract Introduction Conclusions References Tables Figures ◭ ◮ ◭ ◮ Back CloseFull Screen / Esc
Printer-friendly Version Interactive Discussion
EGU
2002 2003 2004 2005 2006
LUE, mmol mol
-1 0 2 4 6 8 10 12 14 16 18 Espirra Mitra Tojal
Fig. 7. Gross ecological light use efficiency, (LUEecol, mmol mol−1) expressed in monthly
aver-ages for the three experimental sites (Espirra – eucalypt plantation; Mitra – oak savannah; and Tojal – grassland) during the extended experimental period (2002–2006).
BGD
4, 1703–1736, 2007 Effects of drought on carbon balance J. S. Pereira et al. Title Page Abstract Introduction Conclusions References Tables Figures ◭ ◮ ◭ ◮ Back CloseFull Screen / Esc
Printer-friendly Version Interactive Discussion
EGU
winter spring summer autumn
Rain use efficiency, g(C) L
-1 0 2 4 6 8 10 12 14 16 Espirra Mitra Tojal 2006
Fig. 8. Seasonal variation in GPP rain use efficiency (GPP/precipitation, g C L−1) in two
exper-imental sites (Espirra – eucalypt plantation and Mitra – oak savannah) during the experexper-imental period (4 years – 2003–2006 - averages with standard error). The 2006 value for Tojal grass-land is also shown.
BGD
4, 1703–1736, 2007 Effects of drought on carbon balance J. S. Pereira et al. Title Page Abstract Introduction Conclusions References Tables Figures ◭ ◮ ◭ ◮ Back CloseFull Screen / Esc
Printer-friendly Version Interactive Discussion
EGU Precipitation, mm
200 300 400 500 600 700 800 900
Rain use efficiency, gC L
-1 0 1 2 3 4 5 6 Espirra Mitra Tojal
Fig. 9. GPP rain use efficiency (GPP/precipitation, g C L−1) for the three experimental sites (Espirra – eucalypt plantation; Mitra – oak savannah; and Tojal – grassland) during the experi-mental period (2003–2006).
BGD
4, 1703–1736, 2007 Effects of drought on carbon balance J. S. Pereira et al. Title Page Abstract Introduction Conclusions References Tables Figures ◭ ◮ ◭ ◮ Back CloseFull Screen / Esc
Printer-friendly Version Interactive Discussion EGU 25-09-05 05-10-05 15-10-05 25-10-05 Solar radiation MJ m -2day -1 0 5 10 15 20 Date NEE, gC m -2day -1 0 1 2 3 Precipitation, mm day -1 0 10 20 30 40 50
Fig. 10. The effect of rain pulses at the end of the dry season in the experimental site of Mitra –
oak woodland – in the autumn of 2005. Upper panel, incident solar radiation; lower panel, net ecosystem exchange rate – continuous line – and daily rainfall totals (dark bars).