HAL Id: hal-00296974
https://hal.archives-ouvertes.fr/hal-00296974
Submitted on 26 Apr 2007
HAL is a multi-disciplinary open access
archive for the deposit and dissemination of
sci-entific research documents, whether they are
pub-lished or not. The documents may come from
teaching and research institutions in France or
abroad, or from public or private research centers.
L’archive ouverte pluridisciplinaire HAL, est
destinée au dépôt et à la diffusion de documents
scientifiques de niveau recherche, publiés ou non,
émanant des établissements d’enseignement et de
recherche français ou étrangers, des laboratoires
publics ou privés.
Stord Orographic Precipitation Experiment (STOPEX):
an overview of phase I
J. Reuder, G. O. Fagerlid, I. Barstad, A. Sandvik
To cite this version:
J. Reuder, G. O. Fagerlid, I. Barstad, A. Sandvik. Stord Orographic Precipitation Experiment
(STOPEX): an overview of phase I. Advances in Geosciences, European Geosciences Union, 2007,
10, pp.17-23. �hal-00296974�
© Author(s) 2007. This work is licensed under a Creative Commons License.
Geosciences
Stord Orographic Precipitation Experiment (STOPEX):
an overview of phase I
J. Reuder1, G. O. Fagerlid1, I. Barstad2, and A. Sandvik2 1Geophysical Institute, University of Bergen, Norway 2Bjerknes Centre for Climate Research, Bergen, Norway
Received: 31 July 2006 – Revised: 9 January 2007 – Accepted: 15 February 2007 – Published: 26 April 2007
Abstract. STOPEX (Stord Orographic Precipitation Experi-ment) is a research project of the Geophysical Institute, Uni-versity of Bergen, Norway, dedicated to the investigation of orographic effects on fine scale precipitation patterns by a combination of numerical modelling and tailored measure-ment campaigns. Between 24 September and 16 November 2005 the first field campaign STOPEX I has been performed at and around the island of Stord at the west coast of Nor-way, about 50 km south of Bergen. 12 rain gauges and 3 autonomous weather stations have been installed to measure the variability of precipitation and the corresponding mete-orological conditions. This paper gives an overview of the projects motivation, a description of the campaign and a pre-sentation of the precipitation measurements performed. In addition, the extreme precipitation event around 14 Novem-ber with precipitation amounts up to 240 mm in less than 24 h, is described and briefly discussed. In this context liminary results of corresponding MM5 simulations are pre-sented, that indicate the problems as well as potential im-provement strategies with respect to modelling of fine scale orographic precipitation.
1 Introduction
As moist air is forced over mountains, orographic precipita-tion (OP) is formed (e.g. Smith, 1979; Jiang, 2003). The phe-nomenon has miscellaneous and partly grave implications on the environment. Eroded landscapes and fresh water supply are two examples of environmental impact by OP. Hazardous events such as mudslides, avalanches and flooding, killing numerous of people every year, are strongly related to OP. In the climate system, the phenomenon is essential in mainte-nance and development of glaciers and the balance of fresh
Correspondence to: J. Reuder
water, as well as for long-term trends in terrain evolution and the variation of plant and animal life.
The main mechanism of OP is the terrain induced forced lifting of air masses. The resulting horizontal precipitation pattern depends critically on various atmospheric parame-ters, as the speed and direction of the flow towards the moun-tain, the available moisture, and the stability of the approach-ing air. In addition the shape and dimension of the orographic barrier plays an important role. The spillover effect (e.g. Sin-clair et al., 1996), i.e. the transport of rain droplets mainly created in the upwind lifting and condensation region into the lee in the presence of strong winds, is an integral manifesta-tion of all parameters menmanifesta-tioned above. Combining flow dy-namics, thermodynamics and cloud microphysics, this phe-nomenon provides a challenging test for model parameteriza-tion schemes. Recent studies (e.g. Z¨angl, 2005; Colle, 2004; Roe and Baker, 2005) have mainly focussed on modelling of OP associated to a typical halfwidth of the mountain barrier of 20 to 50 km. In the paper presented here we will empha-size to a somewhat smaller scale in the order of 5 to 10 km.
Norway (Fig. 1) with its steep mountains located in the belt of extra-tropical cyclone bringing moisture from lower latitudes, is an ideal test area for OP’s impact. Due to its exposure to open ocean and the high frequency of extra-tropical cyclones approaching the area, in particular the west-ern coast provides an excellent opportunity to study OP with high probability of detection.
We will present an overview of the measurements per-formed during the campaign STOPEX I. This campaign is in-tended to improve our understanding in fine scale orographic precipitation patterns by combination of model simulations and analysis of measurements.
18 J. Reuder et al.: STOPEX I
Fig. 1. Topography of Southern Norway. The two boxes represent
the two innermost domains (D3, D4) used for MM5 model simula-tions. In addition the locations of the precipitation radar at Bømlo and the two nearest upstream radiosonde stations Sola and Ekofisk are displayed.
2 Campaign STOPEX I
2.1 Motivation
The island of Stord, located to the south of the city Bergen at the west coast of Norway, has been the focus area for the campaign (Fig. 2). The island extends about 30 km north-south and 10 km east-west and its highest mountains form a plateau at around 600 m. Climatological recordings of pre-cipitation on the windward and the leeward side of the is-land indicate a large horizontal gradient that has to be as-sociated with orographic effects. On the eastern, predom-inantly leeward side, Børtveit shows an annual average of 2661 mm during the 1931–1960 climatological period, while Fitjar 10 km further upstream merely reaches a mean value of 1590 mm per year.
The theoretical work of Smith and Barstad (2004) and the corresponding observational assessment (Barstad and Smith, 2005) have been the initial motivation of this field campaign. Observations from existing campaigns do not give a clear view of how well the theory works. Particularly, information on the natural time scale of OP related processes is needed. The formation of hydrometeors in OP depends on the time the droplets stay in an environment favorable for condensa-tional growth, mainly in the windward lifting zone. Advec-tion can transport these droplets to evaporaAdvec-tion zones,
partic-Table 1. List of rain gauges (P1-P12) and weather stations
(AWS1-AWS3) during STOPEX I.
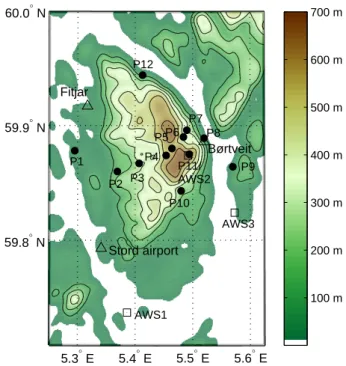
name latitude longitude altitude deg N deg E [m] P1 Korsvik 59.868 5.295 33 P2 Hov˚asen 59.860 5.369 177 P3 Ytste Sørlivatnet 59.867 5.407 242 P4 Store Tjødnadalen 59.874 5.454 551 P5 Stemmetjødno 59.880 5.464 504 P6 Utløp Strupen 59.890 5.484 338 P7 Børtveitdalen 59.896 5.490 282 P8 Børtveit 59.889 5.520 10 P9 Nord-Huglo 59.864 5.570 32 P10 Lundastølen 59.843 5.480 187 P11 Kattnakkjen 59.875 5.494 697 P12 Vistvik 59.944 5.413 104 AWS1 Nautøy 59.737 5.386 2 AWS2 Kattnakkjen 59.874 5.493 700 AWS3 Korsneset (Nord-Huglo) 59.824 5.573 3
ularly in the lee, where number and size of droplets will de-crease. The observational indications from Stord have shown that this site is promising for studies of these mechanisms.
Guidance for the campaign design was provided by the theory, first of all by running a linear model in a quasi-steady operational modus for 3 months upfront of the campaign. It was decided to deploy rain gauges (“tipping-buckets”) where the theory indicated the strongest gradients, and see if the gradient changed dramatically for different weather regimes. The gauges have been aligned across and along the highest mountains (P1-P12 in Fig. 2). The gauge at P2 failed after short operation, therefore only 11 precipitation data series are available for evaluation. At one location, three collectors (P4, P5, P6) have been located within a distance below 2 km at comparable elevation to test if the collectors capture the same precipitation signal. In addition three autonomous weather stations (AWS1-AWS3) recording 10 min averages of wind, temperature and humidity have been deployed. They were partly used to see if channelling effects around the island could explain some of the variation in precipitation. Their location is also indicated in Fig. 2.
2.2 Instrumentation
For the precipitation measurements the data logging rain gauge HOBO RG2 has been used. The instruments are based on the tipping bucket principle and enable a resolu-tion of 0.2 mm. The rain gauges have been validated by a three month intercomparison campaign from May to August 2005. For that two of the 12 HOBO rain gauges (serial num-bers 20371 and 20372) have been operated in parallel to the official precipitation registration performed by the Norwe-gian Meteorological Service (met.no) at the station Bergen-Florida based on standard rain gauge measurements.
The monthly integrated precipitation amount of both HOBO instruments coincides within ±0.5%. Compared to the measurements of met.no the RG2 gauges underestimate monthly integrated precipitation slightly by 2% (June) to 6% (May). A closer look into daily integrated values shows that the underestimation mainly occurs for small precipita-tion amounts below 5 mm/day. This behavior can most likely be addressed to the protective grating of the HOBO instru-ment. It is intended to minimize blocking of the rain gauge by e.g. falling leaves or insects. Of course it also provides an additional surface area that increases losses in measured precipitation by the effects of surface wetting and evapora-tion. These effects are strongest for weak and intermittent precipitation events.
The meteorological measurements at the three selected sites have been performed by autonomous weather stations (AWS) of Aanderaa Data Instruments (AADI). Each of the stations has been equipped with sensors for temperature, rel-ative humidity, wind speed, and wind direction.
2.3 Measurements
The measurements of STOPEX I cover the time period be-tween 24 September and 16 November 2005. During the campaign, 21 different precipitation events have been iden-tified with respect to the large scale synoptic situation, de-rived from surface and 500 hPa analysis charts and infrared satellite images. An overview is given in Table 2. For each identified period the table provides a short description of the synoptic situation, the range of observed accumulated precip-itation at the stations P1 to P12, and the average surface tem-perature measured at the AWS3 Huglo-Korsneset. From ra-diosonde ascents at Sola, about 150 km south of Stord, wind speed and wind direction at the 925 hPa level have been used to characterize the large scale flow conditions. The sound-ings available every 12 h have been selected with respect to best representation of the period of maximum precipitation during each event. In addition two stability parameters Nd and Nmfor the atmospheric boundary layer have been calcu-lated from the sounding data at the surface and the 850 hPa level: Nd =δ s g0 θ dθ dz Nm=δ s g0 θe dθe dz (1) g0:gravity θ : potential temperature
θe:equivalent potential temperature
z : altitude
δ : stability indicator (+1: stable; −1: instable)
N basically represents a slightly modified version of the
Brunt-Vaisala frequency for dry- and moist-adiabatic condi-tions, with negative values (instead of imaginary numbers) indicating instability. The magnitude of both stability pa-rameters or a combination of them are expected to provide a
5.3° E 5.4° E 5.5° E 5.6° E 59.8° N 59.9° N 60.0° N 100 m 200 m 300 m 400 m 500 m 600 m 700 m Stord airport Fitjar P9 AWS1 AWS3 P1 P12 P8 P10 P11/ AWS2 P2 P3 P4 P5P6 P7 Børtveit
Fig. 2. Topography of Stord with location of rain gauges (P1-P12) and autonomous weather stations (AWS1-AWS3) during the field campaign STOPEX I. At Stord airport continuous routine ob-servations are performed by the Norwegian Meteorological Service met.no.
measure for the classification of the identified precipitation events into stratiform, convective and mixed cases.
During the 8 week campaign a total amount of precip-itation between 340 mm (P1: Korsvik, 30 m a.s.l.) and 1237 mm (P11: Kattnakkjen, 697 m a.s.l.) has been observed (Fig. 3). It has to be mentioned that these precipitation values have not been corrected with respect to the known decrease in sample efficiency with increasing wind speed (e.g. WMO, 1998; Nespor and Sevruk, 1999). Due to the measurement height of around 1 m above ground, and the shielded sur-rounding of some of the rain gauges, the wind effects should not be too dramatic, but they will tend to increase the mea-sured values especially for the higher and therefore more wind exposed sites.
Figure 4 shows that the precipitation in general increases markedly with altitude. In addition the data indicate that the stations on the leeward side of Stord (P6 to P9) receive distinctly higher precipitation amounts then those at corre-sponding altitudes on the windward side. P6 and P7, located around 300 m, reach values comparable to P4 and P5, ele-vated above 500 m on the windward side of the mountains. Compared to the westernmost site P1 close to sea level, the two leeward measurements at comparable elevation (P8, P9) registered more than twice in total amount of precipitation. This feature is a typical manifestation of the spillover effect.
20 J. Reuder et al.: STOPEX I
Table 2. Overview of precipitation events during STOPEX I. Values given for each period are the range of accumulated precipitation
(P ) measured by the rain gauges, the 925 hPa wind speed and wind direction from sounding at Sola, the stability as modified (negative values indicate instable conditions) Brunt-Vaisala frequencies (Ndand Nm) calculated from potential temperature θ and equivalent potential
temperature θebetween surface and 850 hPa , and the average temperature (T0) measured at Huglo-Korsneset. The soundings available every
12 h have been selected with respect to be representative for the period of maximum amount of precipitation during each event.
# time interval synoptic situation P vv dir Nd/Nm T0
[mm] [m s−1] [×10−2s−1] [degC] 1 27.09. 00–28.09. 12 cold front and showers behind 11–48 24 S 1.25/−1.35 13 2 28.09. 12–30.09. 00 several occlusions 20–42 9 SW 0.93/−0.50 10 3 30.09. 09–02.10. 03 frontal system 14–81 18 S 1.03/−0.30 13 4 02.10. 09–04.10. 03 occlusion 7–39 4 W 0.88/−0.75 11 5 08.10. 18–09.10. 18 sharp cold front with few subsequent showers 20–37 21 SSE 1.45/0.74 10 6 12.10. 18–14.10. 12 cold front and subsequent showers 17–60 23 SSE 1.25/−0.60 13 7 20.10. 00–23.10. 00 several fronts/occlusions; rather complicated situation 35–115 11 SSW 0.70/−1.08 11 8 25.10. 00–27.10. 00 occlusion and warm front, close to center of low 14–60 30 SE 1.47/1.34 6 9 28.10. 12–29.10. 00 cold front 12–33 28 S 1.28/0.12 13 10 30.10. 09–31.10. 06 cold front 3–28 20 S 1.32/0.85 14 11 31.10. 15–01.11. 06 cyclogenesis at stationary front 8–20 21 SSE 1.33/0.94 12 12 30.10. 09–31.10. 06 passage of cold front and 2 subsequent troughs 5–32 15 S 1.10/−0.33 11 13 02.11. 12–04.11. 00 occlusion and subsequent trough 14–56 19 SSE 1.46/1.13 12 14 04.11. 00–05.11. 00 occlusion 18–84 14 S 1.36/0.90 12 15 05.11. 12–06.11. 09 occlusion 1–17 10 SSW 1.17/0.41 10 16 06.11. 12–08.11. 00 warm front, cold front, trough 8–48 18 SSW 1.52/1.21 11 17 08.11. 00–09.11. 18 passage of frontal system, cyclogenesis 43–86 25 SSW 1.12/0.02 13 18 10.11. 00–11.11. 06 occlusion and subsequent showers 15–44 – – – 10 19 11.11. 03–12.11. 03 passage of warm and cold front 3–26 13 S 1.20/0.71 11 20 12.11. 03–13.11. 12 occlusion, cyclogenesis 8–53 14 W 0.96/−0.49 10 21 13.11. 21–15.11. 15 passage of frontal system, subsequent showers 45–240 14–25 SW–W 1.18/0.76 10
24.09. 01.10. 08.10. 15.10. 22.10. 29.10. 05.11. 12.11.0 200 400 600 800 1000 1200 1400 date accumulated precipitation [mm] P1 P3 P4 P5 P6 P7 P8 P9 P10 P11 P12
Fig. 3. Accumulated precipitation during the 8 week campaign of
STOPEX I.
3 Case study: Extreme precipitation event 13–15 November 2005
During 14 November the fronts of a low pressure system pass southern Norway and lead to exceptionally high precipita-tion amounts along the Norwegian coast. On 12 Novem-ber 00:00 UTC, the cyclone is already well developed and
200 400 600 800 1000 1200 1400 0 100 200 300 400 500 600 700 precipitation [mm] z [m] P3 P11 P9 P8 P12 P10 P1 P7 P6 P4 P5
Fig. 4. Altitude dependence of accumulated precipitation during the 8 week campaign of STOPEX I.
its center (986 hPa) is located around 60◦N at the east coast of Newfoundland. Between it and a strong anticyclone over the central North Atlantic, subtropical moist air is transported towards North. Until 13 November 00:00 UTC the cyclone has slightly weakened (1001 hPa) and moved in between Greenland and Iceland. During the next 24 h the system is
13.11. 21:000 14.11. 09:00 14.11. 21:00 15.11. 09:00 50 100 150 200 250 time [UTC] accumulated precipitation [mm] P1 P3 P4 P5 P6 P7 P8 P9 P10 P11 P12
Fig. 5. Accumulated precipitation during event 21 of STOPEX I.
For extended legend see Fig. 3.
intensifying vigorously (14 November 00:00 UTC: 976 hPa), steadily advecting moist subtropical air.
3.1 Measurements
The precipitation field associated with this frontal system reaches Stord on 13 November around 22:00 UTC (Fig. 5). Within a 24 h period, precipitation amounts between 45 mm (P1: Korsvik) and 240 mm (P11: Kattnakkjen) are measured by the STOPEX rain gauge network. A closer look into the time series of accumulated precipitation reveals four distinct periods of high, nearly constant precipitation intensity, in-dicated by nearly linear and steep increase in accumulated precipitation. These intense precipitation periods, typically lasting 3 to 5 h are separated by shorter (lasting typically 1– 2 h) phases of distinctly lower precipitation intensities. This temporal structure is occurring nearly simultaneously at all rain gauges and can therefore not be related to local orogra-phy. Explanation for these fluctuations must therefore rather be connected to large scale fluctuations.
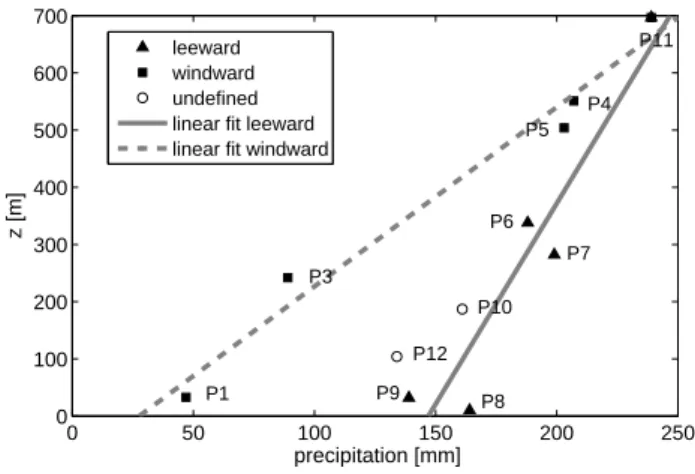
Figure 6 presents the altitude dependence of the ac-cumulated precipitation during event 21 from 13.11.2005 21:00 UTC until 15.11.2005 15:00 UTC. This event was characterized by quite strong wind (10 min averages mea-sured at AWS3: 15–25 m/s), at the beginning from South-west, later from West. The selected positions of rain gauges oriented along the mean incoming flow of moist air (except P10 and P12) provide therefore an ideal transect for the in-vestigation of this precipitation event. The measured precip-itation amounts show again a distinct increase with altitude. By separating windward (P1-P5) and leeward stations (P6-P9), two different regimes of altitude dependence of the pre-cipitation amount become evident. Obviously both regimes can be approximated by a linear dependency with height in-dicated by the fitted curves in Fig. 6. The distinctly larger gradients are observed windward, with an increase of nearly
0 50 100 150 200 250 0 100 200 300 400 500 600 700 precipitation [mm] z [m] leeward windward undefined linear fit leeward linear fit windward
P1 P3 P4 P5 P11 P6 P7 P8 P9 P10 P12
Fig. 6. Altitude dependence of accumulated precipitation during event 21 of STOPEX I.
200 mm per 700 m, i.e. nearly fourfold precipitation amount at P11 compared to P1. The fit through the data of the lee-ward stations results in an increase of around 100 mm per 700 m (from appr. 150 to 250 mm). The leeward stations close to sea level receive around 150 mm about, i.e. approx-imately the threefold precipitation amount of P1 upstream. This again can only be explained by the spillover effect al-ready mentioned above.
3.2 Model simulations
In a first attempt, numerical sensitivity experiments for the event 21 have been performed with the mesoscale atmo-spheric model MM5 version 3.6 (see Dudhia, 1993; Grell et al., 1994, or http://www.mmm.ucar.edu/mm5/ for details). The model has been configured with four domains, the out-ermost covering the southern part of Norway, the North Sea and parts of the Norwegian Sea, the innermost covering the island of Stord and its surroundings. The two inner domains D3 and D4 are shown as boxes in Fig. 1. The horizontal grid resolutions have been selected as 27, 9, 3 and 1 km, the corre-sponding modelling time steps are 81, 27, 9 and 3 s. Each nu-merical simulation started on November, 13:00 at 12:00 UTC and lasted for 30 h. The model has been initialized with an-alyzes of upper air and surface data from ECMWF, and lat-eral boundary values have been included every 6 h during the simulation. Model output data for further analysis have been taken every hour.
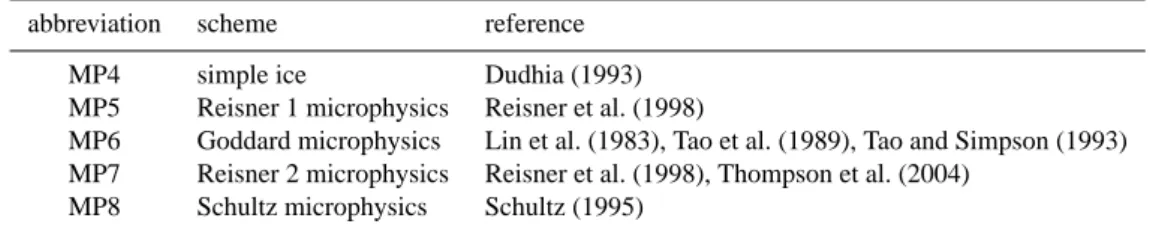
Sensitivity experiments with 5 different microphysical pa-rameterizations schemes given in Table 3 have been per-formed. The radiation transfer has been treated by the Dud-hia radiation scheme (DudDud-hia, 1993). The Grell convection parameterization (Grell et al., 1994) has been used for the 27 km domain, while convection is assumed to be solved ex-plicitly for the higher horizontal resolutions. Turbulence is parameterized by the MRF scheme (Hong and Pan, 1996).
22 J. Reuder et al.: STOPEX I
Table 3. Microphysical parameterization schemes used for MM5 simulations.
abbreviation scheme reference MP4 simple ice Dudhia (1993) MP5 Reisner 1 microphysics Reisner et al. (1998)
MP6 Goddard microphysics Lin et al. (1983), Tao et al. (1989), Tao and Simpson (1993) MP7 Reisner 2 microphysics Reisner et al. (1998), Thompson et al. (2004)
MP8 Schultz microphysics Schultz (1995)
34 36 38 40 42 44 46 48 50 52 54 56 58 60 62 64 0 50 100 150 200 250 300 350 accumulated precipitation [mm]
grid point number, dx=1km
MP4 MP5 MP6 MP7 MP8 topographical height [m] 0 500 1000 1500 2000 2500 3000 3500 topography
Fig. 7. MM5 simulations of accumulated precipitation along a
tran-sect across Stord for the period 13 September 12:00 UTC until 14 September 18:00 UTC using five different cloud microphysics pa-rameterization schemes. The bold solid line represents the MM5 model topography. Circles denote corresponding observations of the rain gauge network.
The results of the model simulations along a transect across Stord are presented in Fig. 7. Except the Schultz mi-crophysics scheme MP8 the MM5 results agree reasonable for the windward side of Stord. Approaching the highest part of the mountains, the deviations between these schemes in-crease. The maxima of predicted precipitation are slightly shifted to the lee and range between 125 mm and 165 mm for the simulated 30 h period. Further downstream the dif-ferences between the different schemes reach a maximum (MP4: 160 mm; MP 7: 75 mm) before obviously converg-ing again about 15 km downstream the top of the orography. In contrast the Schultz scheme MP8 shows a completely dif-ferent behavior. It already starts with slightly enhanced pre-cipitation when approaching the island. Reaching the coast line the amount of precipitation increases sharply to a max-imum of more than 310 mm that is allocated exactly above the highest topography. In the lee the accumulated precipi-tation decreases with distance nearly as steep as it increased upstream.
The occurring differences in total precipitation amount and in the spatial distribution amongst the model runs con-firm the need of appropriate precipitation measurements for validation purposes. Measured accumulated precipitation values for the event 21 from the rain gauges P1 to P9, lo-cated close to the transect, have been plotted as open cir-cles in Fig. 7. Excellent agreement between measurements and MP4 to MP7 simulations can be found at the windward side of Stord. In contrast to the results of these simulations the measured maximum of precipitation coincides with the maximum of topography. Moreover the measured values are markedly above the simulated ones at these elevations. Due to the fact that the measurements have not been corrected with respect to wind-induced undersampling, the real mea-sured values should tend to be even higher. In the lee of the island measurements and model results seem to converge again. Based only on one measurement, this fact should not be overinterpreted. Anyway, the model simulations point out that for future validation purposes additional rain gauges have to be deployed in the downstream region.
4 Summary and Outlook
During STOPEX I high resolution time series of precipita-tion have been derived from rain gauge measurements at 11 sites on and around the island of Stord. These measurements represent an unique data set on horizontal fine-scale variabil-ity of OP. The data presented here preliminarily, will be used in the future for extended comparison and validation tasks of OP model simulations both using advanced weather pre-diction models (e.g. MM5) as well as simpler process ori-ented models, like the linear model of OP proposed by Smith and Barstad (2004). Due to its high temporal resolution the presented data set can not only be used for comparing daily amounts of precipitation, as mostly done in the past. These data now enable moreover the validation of simulated pre-cipitation intensities and have thus a large potential to in-crease our understanding of the underlying microphysical processes.
In addition this first campaign has given invaluable infor-mation for the redistribution and extension of the rain gauge network for the forthcoming, extended campaign STOPEX II
during autumn 2006. At least 6 additional rain gauges will be deployed and a recently purchased Micro Rain Radar (MRR by Metek) will be available both for stationary and mobile precipitation measurements. Additional sources of informa-tion (e.g. integrated water vapor from dual band GPS mea-surements (e.g. Bevis et al., 1992) and high resolution pre-cipitation information derived from the mobile phone trans-mitter network (Messer et al., 2006) will complement our own measurements during STOPEX I and STOPEX II. Acknowledgements. The authors thank their colleague Tor de
Lange for his support in preparation and field setup of instrumenta-tion and in data acquisiinstrumenta-tion and handling. The rain gauges used in this project have been funded by a grant of Meltzer foundation. We are also grateful to the reviewers for their helpful and constructive suggestions and comments.
Edited by: S. C. Michaelides and E. Amitai Reviewed by: anonymous referees
References
Barstad, I. and Smith, R. B.: Evaluation of an orographic precipita-tion model, J. Hydrometeorol., 6, 85–99, 2005.
Bevis, B. G., Bussinger, S., Herring, T. A., Rocken, C., Anthes, R. A., and Ware, R. H.: GPS meteorology: Remote sensing of atmospheric water vapor using the Global Positioning System, J. Geophys. Res., 97, 15 787–15 801, 1992.
Colle, B. A.: Sensitivity of orographic precipitation to changing am-bient conditions and terrain geometries: An idealized modeling perspective, J. Atmos. Sci., 61, 588–606, 2004.
Dudhia, J.: A nonhydrostatic version of the Penn State NCAR Mesoscale Model – Validation tests and simulation of an Atlantic cyclone and cold-front, Mon. Wea. Rev., 121, 1493–1513, 1993. Grell, G., Dudhia, J., and Stauffer, D.: A Description of the Fifth-Generation Penn State/NCAR Mesoscale Model (MM5), Na-tional Centre for Atmospheric Research, Boulder Colorado, US, 1994.
Hong, S.-Y. and Pan, H.-L.: Non-local boundary layer vertical dif-fusion in a medium-range forecast model, Mon. Wea. Rev., 124, 2322–2339, 1996.
Jiang, Q.: Moist dynamics and orographic precipitation, Tellus, 55A, 301–316, 2003.
Lin, Y.-L., Farley, R. D., and Orville, H. D.: Bulk parameterization of the snow field in a cloud model, J. Clim. Appl. Meteorol., 22, 1065–1092, 1983.
Messer, H., Zinevich, A., and Alpert, P.: Environmental monitoring by wireless communication networks, Science, 312, 713, 2006. Nespor, V. and Sevruk, B.: Estimation of wind-induced error of
rainfall gauge measurements using a numerical simulation, J. At-mos. Ocean. Tech., 16, 450–464, 1999.
Reisner, J., Rasmussen, R. M., and Bruintjes, R. T.: Explicit fore-casting of supercooled liquid water in winter storms using the MM5 mesoscale model, Q. J. R. Meteorol. Soc., 124, 1071– 1107, 1998.
Roe, G. H. and Baker, M. B.: Microphysical and geometrical con-trols on the pattern of orographic precipitation, J. Atmos. Sci., 63, 861–880, 2005.
Schultz, P.: An explicit cloud physics parameterization for opera-tional numerical weather prediction, Mon. Wea. Rev., 123, 3331– 3343, 1995.
Sinclair, M. R., Wratt, D. S., Henderson, R. D., and Gray, W. R.: Factors affecting the distribution and spillover of precipitation in the Southern Alps of New Zealand – A case study, J. Appl. Meteorol., 36, 428–442, 1996.
Smith, R. B.: The influence of mountains on the atmosphere, Adv. Geophys., 21, 87–230, 1979.
Smith, R. B.: A linear time-delay model of orographic precipitation, J. Hydrol., 282, 2–9, 2004.
Smith, R. B. and Barstad, I.: A linear theory of orographic precipi-tation, J. Atmos. Sci., 61, 1377–1391, 2004.
Tao, W.-K., Simpson, J., and McCumber, M.: Ice-water saturation adjustment, Mon. Wea. Rev., 117, 231–235, 1989.
Tao, W.-K. and Simpson, J.: Goddard Cumulus Ensemble Model. Part I: Model description, Terr. Atmos. Ocean. Sci., 4, 192–209, 1993.
Thompson, G., Rasmussen, R. M., and Manning, K.: Explicit forecasts of winter precipitation using an improved bulk mi-crophysics scheme. Part I: Description and sensitivity analysis, Mon. Wea. Rev., 132, 519–542, 2004.
WMO: WMO Solid Precipitation Measurement Intercomparison, WMO Instruments and Observing Methods, Report No. 67, WMO/TD 872, 1998.
Z¨angl, G.: The impact of lee-side stratification on the spatial distri-bution of orographic precipitation, Q. J. R. Meteorol. Soc., 131, 1075–1091, 2005.