HAL Id: hal-00295800
https://hal.archives-ouvertes.fr/hal-00295800
Submitted on 14 Dec 2005
HAL is a multi-disciplinary open access
archive for the deposit and dissemination of
sci-entific research documents, whether they are
pub-lished or not. The documents may come from
teaching and research institutions in France or
abroad, or from public or private research centers.
L’archive ouverte pluridisciplinaire HAL, est
destinée au dépôt et à la diffusion de documents
scientifiques de niveau recherche, publiés ou non,
émanant des établissements d’enseignement et de
recherche français ou étrangers, des laboratoires
publics ou privés.
Hydrocarbon-like and oxygenated organic aerosols in
Pittsburgh: insights into sources and processes of
organic aerosols
Q. Zhang, D. R. Worsnop, M. R. Canagaratna, J. L. Jimenez
To cite this version:
Q. Zhang, D. R. Worsnop, M. R. Canagaratna, J. L. Jimenez. Hydrocarbon-like and oxygenated
organic aerosols in Pittsburgh: insights into sources and processes of organic aerosols. Atmospheric
Chemistry and Physics, European Geosciences Union, 2005, 5 (12), pp.3289-3311. �hal-00295800�
Atmos. Chem. Phys., 5, 3289–3311, 2005 www.atmos-chem-phys.org/acp/5/3289/ SRef-ID: 1680-7324/acp/2005-5-3289 European Geosciences Union
Atmospheric
Chemistry
and Physics
Hydrocarbon-like and oxygenated organic aerosols in Pittsburgh:
insights into sources and processes of organic aerosols
Q. Zhang1,*, D. R. Worsnop2, M. R. Canagaratna2, and J. L. Jimenez1,3
1Cooperative Institute for Research in Environmental Sciences (CIRES), 216 UCB, University of Colorado-Boulder, Boulder,
Colorado 80309-0216, USA
2Aerodyne Research Inc., Billerica, Massachusetts 01821-3976, USA
3Department of Chemistry and Biochemistry, 216 UCB, University of Colorado-Boulder, Boulder, Colorado 80309-0216,
USA
*now at: Atmospheric Science Research Center, State University of New York, 251 Fuller Rd, Albany, NY 12204, USA
Received: 8 August 2005 – Published in Atmos. Chem. Phys. Discuss.: 9 September 2005 Revised: 7 December 2005 – Accepted: 7 December 2005 – Published: 14 December 2005
Abstract. A recently developed algorithm (Zhang et al.,
2005) has been applied to deconvolve the mass spectra of organic aerosols acquired with the Aerosol Mass Spectrom-eter (AMS) in Pittsburgh during September 2002. The re-sults are used here to characterize the mass concentrations, size distributions, and mass spectra of hydrocarbon-like and oxygenated organic aerosol (HOA and OOA, respectively). HOA accounts for 34% of the measured organic aerosol mass and OOA accounts for 66%. The mass concentra-tions of HOA demonstrate a prominent diurnal profile that peaks in the morning during the rush hour and decreases with the rise of the boundary layer. The diurnal profile of OOA is relatively flat and resembles those of SO2−4 and NH+4. The size distribution of HOA shows a distinct ul-trafine mode that is commonly associated with fresh emis-sions while OOA is generally concentrated in the accumu-lation mode and appears to be mostly internally mixed with the inorganic ions, such as SO2−4 and NH+4. These observa-tions suggest that HOA is likely primary aerosol from local, combustion-related emissions and that OOA is secondary or-ganic aerosol (SOA) influenced by regional contributions. There is strong evidence of the direct correspondence of OOA to SOA during an intense new particle formation and growth event, when condensational growth of OOA was ob-served. The fact that the OOA mass spectrum from this event is very similar to that from the entire study suggests that the majority of OOA in Pittsburgh is likely SOA. O3appears to
be a poor indicator for OOA concentration while SO2−4 is a relatively good surrogate for this dataset. Since the diurnal averages of HOA track those of CO during day time, oxida-tion/aging of HOA appears to be very small on the time scale
Correspondence to: J. L. Jimenez (jose.jimenez@colorado.edu)
of several hours. Based on extracted mass spectra and the likely elemental compositions of major m/z’s, the organic mass to organic carbon ratios (OM:OC) of HOA and OOA are estimated at 1.2 and 2.2 µg/µgC, respectively, leading to an average OM:OC ratio of 1.8 for submicron OA in Pitts-burgh during September. The C:O ratio of OOA is estimated at 1:0.8. The carbon contents in HOA and OOA estimated accordingly correlate well to primary and secondary organic carbon, respectively, estimated by the OC/EC tracer tech-nique (assuming POC-to-EC ratio=1). In addition, the total carbon concentrations estimated from the AMS data agree well with those measured by the Sunset Laboratory Carbon analyzer (r2=0.87; slope=1.01±0.11). Our results represent the first direct estimate of the OM:OC ratio from highly time-resolved chemical composition measurements.
1 Introduction
Organic compounds are ubiquitous and abundant in ambient aerosols. They typically account for 20–50% of the fine par-ticle mass (Jacobson et al., 2000; Kanakidou et al., 2005; NARSTO, 2003; Saxena and Hildemann, 1996; Seinfeld and Pankow, 2003) and are often internally mixed in the same particles with inorganic aerosols (Middlebrook et al., 2003, 1998; Murphy et al., 1998). Organic compounds play impor-tant roles in the formation, growth, and removal of ambient aerosols (IPCC, 2001). They also significantly affect the hy-groscopicity (Saxena et al., 1995), toxicity (Sheesley et al., 2005), direct radiative properties (Chung and Seinfeld, 2002; Haywood and Boucher, 2000), and indirect effects (Facchini et al., 1999) of atmospheric aerosols and therefore have ma-jor implications for climate, visibility, and human health.
3290 Q. Zhang et al.: Hydrocarbon-like and oxygenated organic aerosols
Elucidating the urban-to-global roles as well as the sources and fate of atmospheric aerosols inherently must rely on a thorough understanding of the chemical and microphysical properties of particulate organics. However, it is extremely difficult to obtain a complete description of the molecular composition of aerosol organics because of the number, com-plexity, and extreme range of physical and chemical proper-ties of these compounds. Usually analysis of over a hun-dred different molecules can only account for 10–20% of the organic mass (NARSTO, 2003; Rogge et al., 1993). For these reasons in order to understand the chemistry of atmo-spheric organic aerosols, bulk characterization approaches such as those targeting compound classes and/or bulk prop-erties (Fuzzi et al., 2001; Gelencser, 2004; Murphy, 2005) should be developed in addition to compound-specific tech-niques.
Spectroscopic techniques, including Fourier transform in-frared (FTIR) spectroscopy (Allen et al., 1994; Blando et al., 1998, 2001; Edney et al., 2003; Laurent and Allen, 2004; Maria et al., 2002; Russell, 2003) and nuclear mag-netic resonance (NMR) (Decesari et al., 2005, 2000; Fuzzi et al., 2001), have been applied to characterize the functional group composition of aerosol organics. A major advantage of these techniques is that they characterize ambient aerosols based on the majority of the organic mass, rather than a lim-ited number of molecules (Allen et al., 1994; Blando et al., 1998; Decesari et al., 2000; Fuzzi et al., 2001; Maria et al., 2002). However, in analysis of ambient samples, both FTIR and NMR methods rely on assumptions about the relation-ship between the strength of the electromagnetic interaction and the amount of material that may introduce significant un-certainties in quantification of functional groups (Blando et al., 2001; Fuzzi et al., 2001). In addition, until now neither method has been adapted for real-time sampling, nor are they capable to determine ambient organic aerosols with high time and size resolution.
Mass spectrometry techniques have been widely used in aerosol analysis because of their universal, extremely sensi-tive, and rapid detection of aerosol components (Jayne et al., 2000; Jimenez, 2005; Johnston, 2000; McKeown et al., 1991; Murphy, 2005; Noble and Prather, 2000; Suess and Prather, 1999). Among these, the Aerodyne Aerosol Mass Spectrom-eter (AMS) (Jayne et al., 2000; Jimenez et al., 2003) is the most commonly used. It is capable of quantitatively measur-ing the size-resolved mass concentrations of organic aerosols with a time resolution of minutes (e.g., Allan et al., 2003a; Drewnick et al., 2004a, b; Jimenez et al., 2003; Zhang et al., 2005b). Good correlations between the mass concentrations of organic aerosols measured by an AMS and the organic carbon concentrations measured by thermal-optical Carbon Analyzers have been observed in various locations, includ-ing Pittsburgh (Zhang et al., 2005b), Houston (Canagaratna et al., 20051), Tokyo (Takegawa et al., 2005b), and the coast
1Canagaratna, M., Jimenez, J. L., Silva, P., et al.: Time resolved
of New England (Bates et al., 2005; de Gouw et al., 2005). The AMS employs thermal vaporization (usually at 600◦C) and 70 eV electron ionization that generally causes extensive fragmentation of organic molecules (Alfarra, 2004; Jayne et al., 2000; Jimenez et al., 2003). As a result, in ambi-ent analysis each mass-to-charge ratio (m/z) peak in an AMS mass spectrum may contain contributions from many differ-ent molecules. For this reason the AMS does not characterize individual molecules in ambient air, but rather the methodol-ogy fits into the group of techniques that characterizes bulk chemistry of organic aerosols.
A recently developed custom principal component analy-sis technique makes it possible to use an AMS to identify and quantify broad aerosol “classes” that have different temporal and mass spectral signatures (Zhang et al., 2005a). When applied in urban areas, this technique deconvolves and quan-tifies two types of organic aerosols, hydrocarbon-like and oxygenated (HOA and OOA, respectively), which together account for almost all the organic aerosol mass measured by the AMS (Zhang et al., 2005a). Hydrocarbon-like aerosols are named based on the similarity of their AMS mass spec-tra to those of hydrocarbons mixtures, while oxygenated or-ganic aerosols are named based on their high oxygen con-tent (Zhang et al., 2005a). More importantly, this technique allows the extraction of mass concentrations, size distribu-tions, and mass spectra of HOA and OOA that are physi-cally and chemiphysi-cally meaningful. As reported by Zhang et al. (2005a), the extracted mass spectrum of HOA is remark-ably similar to the spectra of directly sampled vehicle ex-haust and lab-generated lubricating oil aerosols, while the spectrum of OOA closely resembles those of highly pro-cessed organic aerosols sampled at rural and remote loca-tions. The OOA spectrum also shows similarity with that of fulvic acid (Alfarra, 2004; Zhang et al., 2005a) – a humic-like substance that is ubiquitous in the environment and has previously been used as an analogue to represent polyacid components found in highly processed and oxidized atmo-spheric organic aerosols (Decesari et al., 2002).
In this paper we report the application of this technique to the AMS data acquired at the U.S. EPA Pittsburgh Super-site and the major findings regarding the time trends, con-centrations, and size distributions of HOA and OOA in Pitts-burgh. These results complement two earlier publications from us that discuss the chemistry of new particle growth (Zhang et al., 2004) and the general characteristics of sub-micron aerosol species (inorganic ions + organics) in Pitts-burgh (Zhang et al., 2005b). Because those two articles were published before the development of the HOA and OOA de-convolution technique (Zhang et al., 2005a) discussions con-cerning aerosol organics in both were made based on analysis of total organic signals and a few m/z fragments. Only in this current paper are we able to provide an in-depth analysis of
aerosol size and chemical composition measured during the Texas Air Quality Study, in preparation, 2005.
Q. Zhang et al.: Hydrocarbon-like and oxygenated organic aerosols 3291
the possible sources and processes of organic aerosols based on 1) correlations of HOA and OOA with gas phase and or-ganic carbon measurements; 2) temporal variations, size dis-tributions, and mass spectra of HOA and OOA; and 3) the dynamics of HOA and OOA during an intense new particle formation and growth event.
2 Experimental and data analysis methods
The AMS data used for this study were acquired during 7– 22 September 2002 from the main site of the Pittsburgh Air Quality Study (PAQS). Dates and times are reported in East-ern Standard Time (EST). The local time during this study was Eastern Daylight Savings Time (EDT), which is 1 h ahead of EST. An overview on the sampling location, in-strumentation, and the objectives of PAQS is given elsewhere (Wittig et al., 2004). Gas-phase and meteorological variables were measured simultaneously (Wittig et al., 2004). Note that the original CO data of this study period were offset by
−0.35 ppm to adjust the average minimum CO concentra-tion during periods of very clean air (e.g., air masses from the north) to ∼0.1 ppm, which is the background concen-tration of CO in Northern Hemisphere (Finlayson-Pitts and Pitts, 2000). 2-h averaged PM2.5EC and OC were measured
in situ using a Sunset Laboratory thermal optical transmit-tance carbon analyzer (sampling details are given by Polidori et al., 20052).
Detailed information on the AMS operation and data anal-ysis is presented by Zhang et al. (2005b, 2004). The mass concentrations and size distributions of fine particle species (e.g., SO2−4 , NO−3, NH+4, and organics) measured by the AMS during this study compare well with measurements made by collocated instruments, with some systematic dif-ferences due to different size cuts (Zhang et al., 2005b). The absolute accuracy of the data reported here is mainly lim-ited by the uncertainties in AMS particle collection efficiency (Zhang et al., 2005b).
The mass concentrations and mass spectra of HOA and OOA were derived using the deconvolution procedures de-scribed in a separate publication (Zhang et al., 2005a). This technique involves a series of multivariate linear regressions that use mass-to-charge ratios (m/z’s) 57 (mostly C4H+9)and
44 (mostly CO+2), the identified AMS mass spectral tracers for HOA and OOA, respectively, as the time series of the ini-tial principal components followed by an iterative algorithm to determine HOA and OOA time series and mass spectra. The time resolution of the HOA and OOA time series are 5–10 min.
2Polidori, A., Turpin, B. J., Lim, H.-J., Cabada, J. C.,
Subrama-nian, R., Robinson, A. L., and Pandis, S. N.: Local and regional secondary organic aerosol: Insights from a year of semi-continuous carbon measurements at Pittsburgh, Aerosol Sci. Technol., submit-ted, 2005.
Because of the use of a quadrupole mass spectrometer only a subset of m/z’s (16 in total, out of which 8 are mainly or-ganic m/z’s) were scanned for size distributions in this study (Jayne et al., 2000; Jimenez et al., 2003; Zhang et al., 2005b). We are thus unable to derive the size distributions of HOA and OOA using the full mass spectra. Those presented in this study are derived based on the measured size distributions of
m/z’s 57 and 44 because they are the first order AMS trac-ers for OOA and HOA, respectively, and correlate closely to the HOA and OOA time series (Zhang et al., 2005a). The size distribution of OOA was derived by normalizing the in-tegrated signals of m/z 44 in 20–1500 nm particles to the estimated concentrations of OOA. Note that this size range was selected to ensure the capture of all particle signals. The first paper on the AMS showed about 50% transmission at 1000 nm, which is typically referred to as PM1 (Fig. 9 on
Jayne et al., 2000) and a detailed analysis of signals from Pittsburgh AMS data showed partial transmission for parti-cles down to 33 nm (Zhang et al., 2005a). Slightly different aerodynamic lens designs have been used in the AMS, in-cluding during this study, and each lens may have slightly different particle transmission characteristics. This is a sub-ject of ongoing research that will be presented in a future publication.
The potential for interferences to m/z 44 to cause differ-ences between the real size distribution of OOA and the dis-tribution presented here is low because of the very high cor-relation of m/z 44 and OOA and the lack of m/z 44 signal in the HOA mass spectrum (Zhang et al., 2005a). However, considering that m/z 57 is present in the OOA mass spec-trum at intensity ∼2% of that of m/z 44, which indicates that m/z 57 may have contributions from oxygenated species (e.g., C3H5O+)in addition to hydrocarbons (i.e., C4H+9), we
derived the size distribution of HOA by subtracting 2% of the m/z 44 signal from the size distribution of m/z 57 and then normalizing the integrated signals in 20–1500 nm par-ticles to the estimated concentrations of HOA. The presence of oxygenated m/z 57 (C3H5O+)when the OOA to HOA
ra-tio is high has been confirmed by recently acquired high m/z resolution AMS data.
Organic mass to organic carbon ratios (OM:OC) of HOA and OOA are estimated based on the extracted mass spectra of the two components (Zhang et al., 2005a) and the likely el-emental compositions of the major m/z’s in the correspond-ing spectrum. All the data reduction and analysis are per-formed with Igor Pro 5 (Wavemetrics Inc.).
3292 Q. Zhang et al.: Hydrocarbon-like and oxygenated organic aerosols 0 1 2 3 4 5 6 M a s s C o n c en tr at io n ( µ g m -3 ) 0 1 2 3 4 5 6
e
HOA OOA 0 20 40 60 80 100 90% Mean Median 10% 25% 75% % of Tot a l Organ ics 0 20 40 60 80 100f
HOA OOA 0 1 2 3 4 5 6 M a s s C o n c en tr at io n ( µ g m -3 ) 0 1 2 3 4 5 6e
HOA OOA 0 20 40 60 80 100 90% Mean Median 10% 25% 75% % of Tot a l Organ ics 0 20 40 60 80 100f
HOA OOAFigure 1.
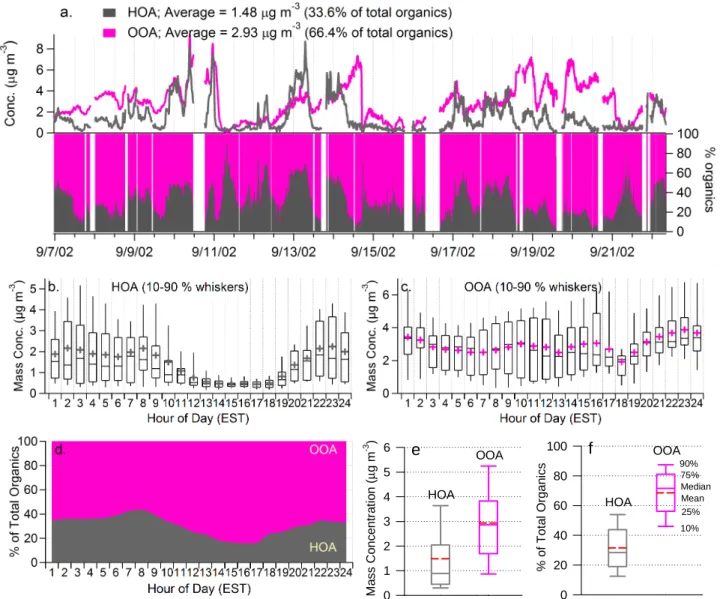
Fig. 1. (a) Time series of the absolute and fractional HOA and OOA in Pittsburgh during 7–22 September 2002. Missing data points are due to either occasional instrumental malfunction or maintenance/calibration. Average diurnal cycles of the mass concentrations of (b) HOA and (c) OOA. (d) Average diurnal cycles of the fractional contribution of HOA and OOA to the total organic aerosol mass. Box plots of (e) the mass concentration and (f) the fractional contribution of HOA and OOA to total organics. The box plots are read as follows: the upper and lower boundaries of the box indicate the 75th and the 25th percentiles, the solid line within the box marks the median, the whiskers above and below the box indicate the 90th and 10th percentiles. Cross symbols or the red broken lines represent the means. The results of the statistical analysis are given in Table 1. The x-axis labels of the diurnal plots corresponds to the hour that ends the averaging interval and the ordinal of the hour in the day, e.g., “1” means the first hour of the day, from 00:00–01:00 a.m. EST.
3 Results and discussion
3.1 Mass concentrations and temporal variations of HOA and OOA
3.1.1 Mass concentrations and diurnal variations of HOA and OOA
The time series of the mass concentration and the frac-tional contribution of hydrocarbon-like and oxygenated or-ganic aerosols are shown in Fig. 1 (and see Zhang et al.,
2005a). During this study in Pittsburgh the mass concen-trations of atmospheric fine particles changed dramatically. Multiday episodes of fine particle pollution are interleaved with clean periods following heavy rainfall and/or the arrival of clean air from the north. The time trends of HOA and OOA are very different, except for a few periods when their concentrations appear to co-vary due to the arrival of clean air masses and/or rainfall scavenging. In general, the time se-ries of HOA demonstrates a pronounced variation pattern that typically peaks during morning rush hours, when the mixing layer is relatively shallow and primary emissions from traffic
Q. Zhang et al.: Hydrocarbon-like and oxygenated organic aerosols 3293
42 Figure 2.
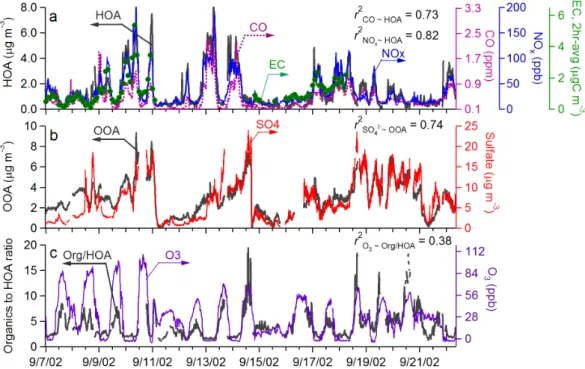
Fig. 2. Time trends of (a) HOA and typical combustion emission tracers (CO, NOx, EC), (b) OOA and PM1SO2−4 (both from the AMS),
and (c) the OOA to organic mass ratio and O3during 7–22 September 2002 in Pittsburgh.
are intense. OOA demonstrates a time trend similar to that of sulfate (Fig. 2b), a dominant secondary aerosol species that is strongly influenced by regional accumulation rather than local emissions in Pittsburgh (Zhang et al., 2005b).
The significantly different diurnal patterns of HOA and OOA are evident in Figs. 1b and c. Note that these diur-nal averages may be skewed by a few abnormally low/high loading events due to the relatively short duration of this study (16 days). The dip at the 18th hour (between 5:00 to 6:00 p.m.) on the diurnal curve of OOA, for example, is mainly caused by the abrupt drop in the mass concentra-tion associated with a rainfall event in the afternoon of 15 September. HOA demonstrates a clear diurnal pattern that peaks in the morning during the rush hour (8:00–9:00 a.m.), gradually decreases after 8:00 a.m., and reaches its minimum between 3:00–5:00 p.m. In contrast, the OOA diurnal pro-file is relatively flat and resembles those of SO2−4 and NH+4 (Zhang et al., 2005b). In addition, while the trend is rela-tively weak, the mean values of OOA show slight increases in the afternoon between 13:00 to 16:00 EST (Fig. 1c), when photochemistry is relatively intense. As a result, the high-est fraction of OOA was observed in the afternoon around 15:00–17:00 EST, during which OOA accounts for more than 80% of the total organic mass on average (Fig. 1d).
Table 1 and Figs. 1e, f summarize the statistics of the mass concentrations of HOA and OOA and their fractional contributions to the total organics. OOA dominates organic aerosol mass loading in Pittsburgh, accounting for more than half of the organic mass for ∼85% of the time during this
Table 1. Statistical parameters of the distributions of the mass con-centrations of HOA and OOA, and of their fractional contributions to the total organic mass in Pittsburgh during 7–22 September 2002.
Mass Concentration (µg m−3) % of Total Organicsa
HOA OOA HOA OOA
Mean 1.48 2.93 31 69 1σ 1.44 1.65 16 16 Median 0.89 2.86 28 72 Min <D.L.b <D.L.b 0 7 Max 8.71 9.33 93 100 90th percentile 3.63 5.25 54 88 75th percentile 2.04 3.83 44 81 25th percentile 0.45 1.69 19 56 10th percentile 0.30 0.87 12 46
aThese values are obtained by analyzing the relative concentrations
(percent values) of HOA and OOA, rather than estimated from the absolute mass concentration statistics.
bD.L.: Detection limit of organic mass concentration, which was
estimated to be 0.15 µg m−3for this study (Zhang et al., 2005b).
study (Fig. 1a). The average (±1σ ) mass concentration of OOA is 2.93 (±1.65) µg m−3, roughly twice that of HOA (1.48±1.44 µg m−3; Figs. 1e, f). On average, HOA repre-sents 34% of the organic aerosol mass in Pittsburgh while OOA accounts for 66%. Even during the morning rush hour, the mass loading of OOA is larger than that of HOA on aver-age (Fig. 1d).
3294 Q. Zhang et al.: Hydrocarbon-like and oxygenated organic aerosols
Figure 3
Fig. 3. Scatter plots of the concentrations of (a) HOA vs. CO; (b) HOA vs. NOx; (c) HOA vs. elemental carbon; (d) OOA vs. sulfate; and
(e) OOA vs. O3(data points are colored by hour of day).
3.1.2 Correlation of HOA and OOA with combustion and secondary aerosol tracers
Figure 2a shows the time series of HOA together with three primary combustion emission tracers – CO, NOx, and
el-emental carbon (EC). Figure 2b shows the time series of OOA and sulfate – a secondary aerosol species that is mainly formed through gas-phase and aqueous-phase oxidation of SO2. The corresponding linear regression scatter plots are
shown in Figs. 3a–d.
HOA correlates well with CO (r2=0.73), NOx(r2=0.82),
and EC (r2=0.72), all of which demonstrate a pronounced di-urnal pattern that peaks in the morning when traffic emissions are intense, declines with the rise of the mixed layer depth, and gradually increases after the boundary layer collapses in the evening. Such diurnal behavior is characteristics for air pollutants from local emissions and thus indicates a strong association of HOA to combustion aerosol emitted locally (e.g., from traffic). This hypothesis is consistent with the size distribution of HOA, which constantly shows a prominent ul-trafine mode that is common for combustion aerosols (see Sect. 3.2). The mass spectrum of HOA is also very similar to those of freshly emitted vehicle exhaust aerosols, showing ion series characteristic of hydrocarbons (see Sect. 3.3 and Zhang et al., 2005a).
The time trend of OOA tracks that of SO24 (r2=0.74) but correlates very weakly to the combustion tracers (r2<0.1). The good correlation between OOA and SO2−4 suggests sim-ilar sources and/or processes of these two aerosol compo-nents. SO2−4 is a major fine particulate species in Pittsburgh due to the high SO2 emissions in this geographical region
(Wittig et al., 2004; Zhang et al., 2005b). The atmospheric concentration of SO2−4 is strongly influenced by regional ac-cumulation rather than local production since a significant fraction of the fine particles in Pittsburgh are aged over re-gional scales (Anderson et al., 2004; Tang et al., 2004). For these reasons the rather weak response of the ambient con-centrations of OOA and SO2−4 to the daily fluctuation of mixed layer depth is indicative of the regional nature of both components (i.e., similar levels of SO2−4 and OOA in the morning boundary layer and in air aloft). This is in contrast to HOA, which originates predominantly from local emis-sions and as expected demonstrates a pronounced diurnal pattern that peaks in the morning when traffic emissions are high and the mixed layer depth is low.
The lack of strong diurnal variations of SO2−4 and OOA might also be the result of their relatively high background concentrations in the region – daily photochemical produc-tion of these two components, which is usually most intense in the afternoon, tends to be dwarfed by the much stronger
Q. Zhang et al.: Hydrocarbon-like and oxygenated organic aerosols 3295
variations in mass concentrations associated with changes of air mass or rainfall scavenging. Note that in areas where fine particles are more strongly influenced by local photochem-istry, such as in Mexico City, photochemical production of oxygenated organics is sufficiently pronounced that a clear increasing trend of OOA is often observed during morning and early afternoon3. OOA in Pittsburgh appears to be pri-marily secondary organic aerosol associated with regional accumulation rather than from local emissions. This hypoth-esis is consistent with the size distributions of OOA, which are dominated by the accumulation mode (see Sect. 3.2), and its mass spectrum, which closely resembles those of aged and highly oxidized organic aerosols (see Sect. 3.2 and Zhang et al., 2005a).
3.1.3 Correlation of OOA to O3
A previous study in Pittsburgh reported the use of ozone as an indicator for SOA formation supported by the observation that increases in the OC-to-EC ratio correlate with ozone in-creases (Cabada et al., 2004a). However, we found very little correlation between O3 and OOA during this study (r2≈0;
Fig. 3e), which suggests that ozone concentration is a rather poor indicator for SOA concentration, at least for this study period.
A possible explanation for the positive correlation of SOA to O3observed by Cabada et al. (2004a) is that the POC/EC
ratios used in their EC/OC tracer method were overestimated, possibly by an average factor of ∼2 as they were determined based on measured ambient OC/EC ratios during periods when ambient organic aerosol likely contained ∼50% SOA (see discussions in Sect. 3.4). Such underestimation of SOA (and overestimation of POA) would greatly diminish as the boundary layer rises, due to the strong dilution of EC. Since the O3diurnal profile is anti-correlated to that of EC (due to
the strong effect of the boundary layer on both), this would result in an apparent correlation between SOA and O3.
A related effect is illustrated in Fig. 2c where the organics-to-HOA ratio shows a pronounced daytime increase pattern that is similar to ozone (r2=0.38). Since the AMS cannot measure EC, the organics-to-HOA ratio is presented as a sur-rogate for the OC-to-EC ratio given the good correlation be-tween HOA and EC (Fig. 2a) and bebe-tween organic mass and OC concentrations (r2=0.88) (Zhang et al., 2005b). The ob-served daytime increase of organics-to-HOA ratio (as well as OC-to-EC ratio) is mainly driven by the strong diurnal varia-tions in HOA (and EC) concentravaria-tions associated with daily fluctuation of the boundary layer height (Fig. 1b), rather than production of OOA.
Due to the good correlation between SO2−4 and OOA (r2=0.74; Figs. 2b, 3d) as well as the fact that both are in
3Dzepina, K., Zhang, Q., Salcedo, D., et al.: Characterization of
ambient aerosol in Mexico City: The organic component, in prepa-ration, 2005
the particle phase and are thus likely exposed to similar mi-crophysical transformations and scavenging processes, SO2−4 concentration is a better indicator for SOA concentration, at least during this study.
3.1.4 Emission ratios of HOA and OOA-to-SO2−4 ratio We examine here the emission ratios of HOA to primary pol-lutants for this study. The average ratio of HOA to EC is
∼1.41±0.22 µg/µgC during this study. It is similar to the average POA to EC ratio in the Northeast US estimated with a dispersion model (=1.4 µg/µgC) (Yu et al., 2004), as well as the value estimated from emission inventory during Pitts-burgh summer time (=1.2 µg/µgC; calculated from Cabada et al., 2002).
The emission ratio of HOA to CO for this study, es-timated after subtracting the Northern Hemisphere back-ground of CO (0.1 ppm) from the measured CO concen-trations, is ∼4.3 ng m−3/ppbv. (The linear regression slope of HOA vs. CO with the intercept forced through zero is
∼3.7 ng m−3/ppbv). These values are lower than the POA to CO emission ratio in New England (9.4 ng m−3/ppbv)
determined based on correlated behavior of total OA with gas-phase tracers (de Gouw et al., 2005) and the POA to CO ratio estimated from the AMS data in Tokyo, Japan (11 ng m−3/ppbv) (Takegawa et al., 2005a4). All of these numbers are larger than the average POA to CO emis-sion ratios measured during a tunnel study in California –
∼1.8 ng m−3/ppbv for diesel trucks and ∼0.8 ng m−3/ppbv for light-duty vehicles (calculated from Kirchstetter et al., 1999). In addition, the emission factor of HOA to NOx of
this study (i.e., 42 ng m−3/ppbv) is roughly 3 times the POA to NOxratios of diesel trucks and light-duty vehicles
(aver-age ≈16 and 11 ng m−3/ppbv, respectively) from the Califor-nia tunnel study (calculated from Kirchstetter et al., 1999). Possible reasons for the variations in these measured ratios include different sampling locations, seasons and meteoro-logical conditions, different vehicle fleets (including differ-ent emission standards for California vehicles), as well as different measurement methods and assumptions applied for POA estimation.
Since sulfate is a better indicator for OOA concentration (see discussion above), we estimate the average concentra-tion ratio of OOA to sulfate as 0.38 (dimensionless) during this study (Fig. 3d). The significance of this number is that it provides a first order estimation of the mass concentrations of OOA based on measured sulfate concentrations in fine par-ticles in the Pittsburgh region during Fall. A survey of the OOA to SO2−4 ratios based on AMS data at many locations
4Takegawa, N., Miyakawa, T., Kondo, Y., Jimenez, J. L.,
Worsnop, D. R., and Fukuda, M.: Seasonal and diurnal variations of submicron organic aerosols in Tokyo observed using the Aerodyne Aerosol Mass Spectrometer (AMS), J. Geophys. Res., submitted, 2005a.
3296 Q. Zhang et al.: Hydrocarbon-like and oxygenated organic aerosols
44 Figure 4
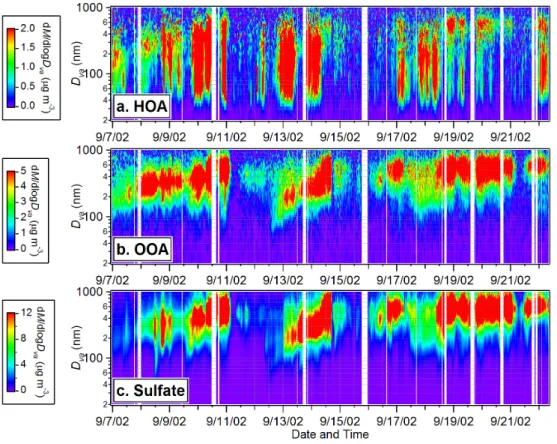
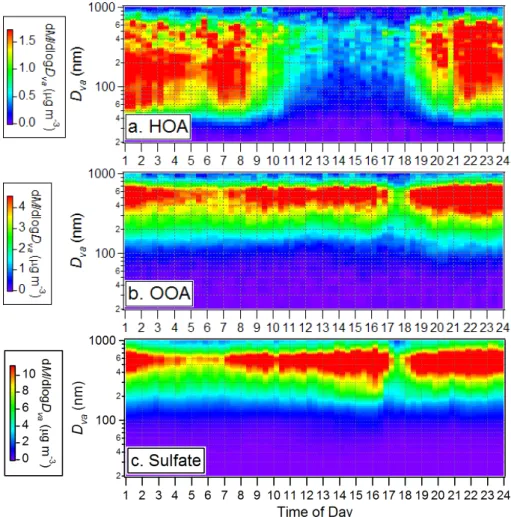
Fig. 4. Time variations of the size distributions of (a) HOA, (b) OOA, and (c) sulfate during 7–22 September 2002 in Pittsburgh. Missing data points are due to either occasional instrumental malfunction or maintenance/calibration.
in the Northern Hemisphere will be provided in a separate paper.
3.2 Size distributions of HOA and OOA
3.2.1 Change of size distributions of HOA and OOA as function of time
The image plots in Figs. 4a and b provide an overview of the temporal variations of the HOA and OOA size distribu-tions during this study, showing again very different behav-iors for HOA and OOA. OOA mostly resides in the accumu-lation mode with vacuum aerodynamic diameters (Dva;
De-Carlo et al., 2004) larger than 250 nm while HOA displays a much broader distribution that extends into the ultrafine mode (Dva<100 nm). Typically ∼30% of the HOA mass is
associated with ultrafine particles compared to less than 5% of the OOA mass.
Note that the AMS size distributions presented here are shown vs. Dva, which is the aerodynamic diameter measured
under free-molecular regime flow conditions. For a spherical particle, Dvaequals the product of its physical diameter and
density. Given that the average density of the bulk Pittsburgh particles was roughly 1.5 during this study (Zhang et al., 2005b, 2004), to a first approximation, 250 nm in Dva
corre-sponds roughly to 170 nm in physical diameter for spherical particles.
The size distribution of OOA tracks the behavior of sul-fate (and ammonium) throughout the entire study (Figs. 4b and c) (also see Zhang et al., 2005b and Suppl. Info), echo-ing the fact that their mass concentrations are highly corre-lated (Fig. 2; see Sect. 3.1). Simultaneous growth of OOA and SO2−4 size distributions is observed during some peri-ods, e.g., from the afternoon of 12 to 14 September – a pe-riod that follows an intense new particle formation event (see Sect. 3.5 for detailed discussion). These observations suggest that oxygenated organics are likely internally mixed with NH+4 and SO2−4 and that both OOA and SO2−4 are formed over similar regional scales. The HOA size distribution pat-tern is distinctly different from those of OOA and SO2−4 . It is generally much broader, showing a pronounced ultrafine mode that increases at night and in the morning. On aver-age, only ∼50% of the total HOA mass is associated with the accumulation mode.
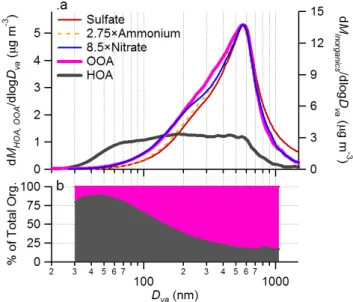
Figure 5a summarizes the average size distributions of HOA, OOA, and inorganic aerosols species of the entire study that again demonstrate the overall resemblance of OOA to secondary aerosol species (NH+4, SO2−4 , and NO−3). Com-pared to the size distributions of SO2−4 and NH+4, those of OOA and NO−3 are slightly broader, extending more into the
Q. Zhang et al.: Hydrocarbon-like and oxygenated organic aerosols 3297
smaller sizes (<300 nm). In the case of nitrate, this likely reflects active gas-particle partitioning due to its semivolatile character and the strong influences of ambient temperature and relative humidity on the partitioning (Seinfeld and Pan-dis, 1998). Similarly, the broader OOA distribution suggests a stronger influence of local gas-to-particle partitioning on OOA than on NH+4 and SO2−4 formation. This is consistent with the known semivolatile character of some SOA com-pounds (Sheehan and Bowman, 2001), compared to the non-volatile character of sulfates. Figure 5b shows the average fractional contributions of HOA and OOA to total organic mass as a function of aerosol size, from which we estimate that ∼75% of the accumulation mode organic mass is OOA. In contrast, ∼75% of the organic mass in ultrafine aerosols is HOA.
3.2.2 Diurnal variations of the size distributions
The average diurnal image plots of the HOA, OOA, and sul-fate size distributions are shown in Fig. 6. As pointed out in Sect. 3.1, the dip at 17:00∼18:00 EST on the diurnal plots of OOA and sulfate is primarily due to a rainfall event in the afternoon of 15 September. These figures are analo-gous to Fig. 4, showing that HOA has distinctly different behavior than OOA and SO2−4 and that the highest OOA-to-organics fraction (and the accompanying shift of particles toward larger sizes) preferentially occurs in the afternoon. Figure 7 provides a survey of the average size distributions of HOA and OOA and their relative contributions to the total organic mass during different hours of the day in correspon-dence to Fig. 6. Even in early afternoon, when the HOA mass loading is the lowest and its size distribution the narrowest, the ultrafine mode organics are about 50% HOA.
3.2.3 Size distributions of HOA and OOA for periods with different HOA and OOA fractions
We display in Fig. 8 the average size distributions of HOA and OOA and the correlations of HOA to CO and OOA to SO2−4 during: 1) high HOA and CO periods (when both HOA and CO are in the upper 75th percentile of their ab-solute concentrations) that represent the situation of intense primary combustion emissions and high loading of fresh or-ganic aerosols; 2) “typical” situation when the fractional con-tribution of OOA to the total organics (OOA%) is within the 25th–75th percentile of its absolute values (corresponding to periods when OOA contributes 58%∼81% of the total or-ganic mass); and 3) aged aerosol periods when OOA% are in the top 25th percentile of its absolute values (corresponding to periods when OOA contributes more that 81% of the to-tal organic aerosol mass). In general, there is a clear shift of all species (including, SO2−4 , OOA, and most dramati-cally HOA) to larger mode size with higher OOA fraction (e.g., Fig. 8a-1 vs. Fig. 8c-1). The size distribution of HOA demonstrates an increasingly prominent accumulation mode
45
Figure 5.
Fig. 5. (a) Average size distributions of HOA, OOA, and particle phase inorganic ions (NH+4, NO−3, and SO2−4 )and (b) the size re-solved fractional contributions of HOA and OOA to total organic aerosols in Pittsburgh over the entire study (7–22 September 2002).
with higher OOA fraction. Note that although part of the nar-rowing of OOA distribution observed could be due to limited transmission of the AMS lens at high particle sizes (Jayne et al., 2000; and see discussions in Zhang et al., 2005b), such effect is expected to be fairly small during this study since the majority of Pittsburgh organic mass is in submicron aerosols (Cabada et al., 2004b).
In addition, there are several trends observed: (1) the size distributions of OOA and SO2−4 are very similar under all sit-uations; (2) HOA always dominates the composition of small particles (Dva<100 nm), even during very high OOA periods
(Fig. 8c-1); 3) the linear regression slope of HOA vs. CO is somewhat lower with higher OOA fraction (Figs. 8b-1–8b-3); and 4) the correlation of OOA to SO2−4 is always good but the OOA/SO2−4 ratio decreases slightly with high OOA frac-tion (Figs. 8c-1–8c-3). In addifrac-tion, while not shown here, the correlation of OOA with O3does not improve (i.e., r2≈0) at
high OOA.
3.3 Mass spectra and estimated elemental compositions of HOA and OOA
Together with the mass concentrations of HOA and OOA, complete mass spectra of these two components were ex-tracted using the deconvolution technique described in Zhang et al. (2005a). Because of the clear separation of the HOA signals from the OOA in measured mass spectra, we are able to estimate the possible elemental compositions of each
m/z in the HOA and OOA spectra and thus the elemental composition of the organic aerosol. Table 2 lists the esti-mated compositions of the 14 and 16 most abundant m/z’s,
3298 Q. Zhang et al.: Hydrocarbon-like and oxygenated organic aerosols
46
Figure 6
Fig. 6. Average diurnal variations of the size distributions of (a) HOA, (b) OOA, and (c) sulfate during 7–22 September 2002 in Pittsburgh. The raw data have been averaged into 20 min intervals.
accounting for 75% and 67% of the OOA and HOA signals, respectively. The assumed compositions of the major peaks in the spectra were verified by examining preliminary data on the organic mass spectra of ambient aerosols acquired by a high-resolution ToF-AMS5. For m/z’s not listed in the ta-ble, we assume that those of HOA have the same average C:H ratio as the average of 16 HOA m/z’s listed in Table 2 (i.e., average molecular composition is (CH2)n)and those of
OOA have an average C:H:O ratio same as the average of the major OOA m/z’s in Table 2 excluding 17, 18, 28 and 44 (i.e., average molecular composition is (C2H3O)n).
These elemental compositions are first order estimations since we only included C, H, and O atoms. The omission of nitrogen atom may influence the OM:OC estimates since nitrogen-containing organic compounds have been detected in ambient aerosols (Li and Yu, 2004; Zhang and Anasta-sio, 2003; Zhang et al., 2002a, b]. However, the influence is expected to be relatively small because C, H, and O are
5DeCarlo, P., Aiken, A., Jimenez, J. L., et al.: A
High-Resolution Aerosol Mass Spectrometer, in preparation, 2005.
the three dominant atoms reported in aerosol organic species (Seinfeld and Pandis, 1998). Recent studies reported that N atoms typically account for 10% or less of the total or-ganic mass in atmospheric fine particles and fog waters (e.g., Zhang and Anastasio, 2001; Zhang et al., 2002a). In addi-tion, by using mass spectra to derive the elemental compo-sition of molecules (Table 2) we assume that the elemental composition of the ions is on average the same as the elemen-tal composition of the parent molecules. This assumption could introduce some bias on the estimated elemental com-position if certain functional groups or molecular structures have a greater tendency to end up as either ions or neutrals in the fragmentation process.
Figure 9 shows mass spectra of HOA and OOA colored with the contribution of C, H, and O at each m/z. See Zhang et al. (2005a) for detailed discussion on these two mass spectra; only the major points are summarized here: 1) the HOA spectrum demonstrates prominent ion series char-acteristic of hydrocarbons and shows remarkable similarity to the measured AMS mass spectra of diesel exhaust aerosols and lab-generated lubricating oil and diesel fuel aerosols
Q. Zhang et al.: Hydrocarbon-like and oxygenated organic aerosols 3299
47
Figure 7.
Fig. 7. Average size distributions of HOA, OOA and sulfate and the size resolved fractional distributions of HOA and OOA to total organics during different hours of day.
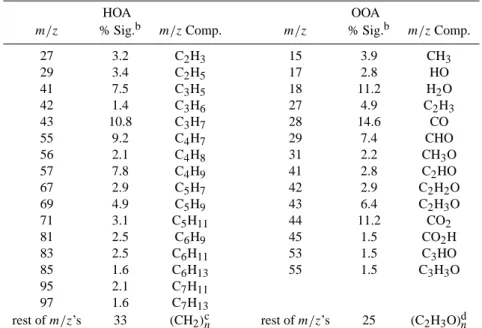
Table 2. Estimated elemental compositions of the major m/z’s (total number=270) in HOA and OOAa.
HOA OOA
m/z % Sig.b m/zComp. m/z % Sig.b m/zComp.
27 3.2 C2H3 15 3.9 CH3 29 3.4 C2H5 17 2.8 HO 41 7.5 C3H5 18 11.2 H2O 42 1.4 C3H6 27 4.9 C2H3 43 10.8 C3H7 28 14.6 CO 55 9.2 C4H7 29 7.4 CHO 56 2.1 C4H8 31 2.2 CH3O 57 7.8 C4H9 41 2.8 C2HO 67 2.9 C5H7 42 2.9 C2H2O 69 4.9 C5H9 43 6.4 C2H3O 71 3.1 C5H11 44 11.2 CO2 81 2.5 C6H9 45 1.5 CO2H 83 2.5 C6H11 53 1.5 C3HO 85 1.6 C6H13 55 1.5 C3H3O 95 2.1 C7H11 97 1.6 C7H13 rest of m/z’s 33 (CH2)cn rest of m/z’s 25 (C2H3O)dn
aThe mass spectra of HOA and OOA (up to m/z=150) are presented in Fig. 7 and those in logarithmic scale (to show low signal m/z’s more
clearly) are presented in Fig. 11 in Zhang et al. (2005a).
b% of the total signals in each component (HOA or OOA) mass spectrum that was detected at the specified m/z. cAverage molecular composition assumed for the rest of the HOA m/z’s.
3300 Q. Zhang et al.: Hydrocarbon-like and oxygenated organic aerosols
48
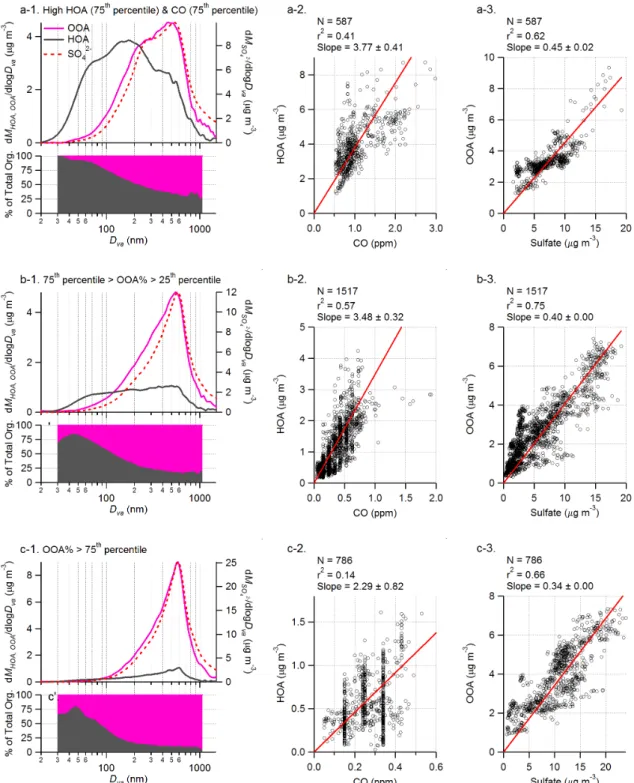
Figure 8
Fig. 8. Average size distributions and the size resolved fractional contributions of HOA and OOA to total organic aerosols during: (a-1) High HOA (above 75th percentile of HOA concentration) and CO (above 75th percentile CO concentration) periods; (b-1) Periods when the OOA to total organics ratios (OOA%) are within the 25th–75th percentile of its value and (c-1) Periods when OOA% are in top 75th percentile the value. To the right of the size distribution plots are the scatter plots and linear regressions between HOA and CO (a-2, b-2 and c-2) and OOA vs. sulfate (a-3, b-3 and c-3) during the corresponding periods. Red lines are the linear fits to the data. All the linear fits were performed with intercept forced through the origin.
Q. Zhang et al.: Hydrocarbon-like and oxygenated organic aerosols 3301
49 Figure 9.
Fig. 9. Mass spectra of (a) HOA and (b) OOA, colored with the estimated contribution of each element (C, H, and O) to the mass of each
m/zfragment. The elemental compositions of each m/z in HOA and OOA are estimated according to Table 2.
(Canagaratna et al., 2004); 2) the OOA spectrum is dom-inated by m/z 44 (CO+2) and m/z 28 (CO+)and demon-strates close similarity in the overall pattern with those of aged/oxidized organic aerosols in rural and urban areas; and 3) the OOA spectrum is also qualitatively similar to the AMS mass spectrum of Suwannee River fulvic acid (Alfarra, 2004), which is a class of highly oxygenated organic com-pounds that have been proposed as models of the highly ox-idized organic aerosols that are ubiquitous in the atmosphere (Decesari et al., 2002). In addition, neither HOA nor OOA mass spectrum represents individual species, but rather, they represent mixtures of many individual organic species asso-ciated with the same group of sources and atmospheric pro-cesses (i.e., urban emissions vs. regional secondary aerosol). Based on estimated elemental compositions of m/z’s, we estimate that the average molar ratio of C:H:O in OOA is 1:1.6:0.8 (or 5:8:4) and that the average molar ratio of C:H in HOA is 1:1.9 (or 10:19). The organic mass to or-ganic carbon ratios (OM:OC) of HOA and OOA are es-timated at 1.2 and 2.2 µg/µgC, respectively. This HOA OM:OC ratio is consistent with the value (1.2 µg/µgC) of hydrocarbons (Turpin and Lim, 2001) – the major compo-nents of urban fresh combustion aerosols. In addition, the OOA OM:OC ratio is close to the value estimated for nonur-ban aerosols (2.1±0.2 µg/µgC) (Turpin and Lim, 2001) but is significantly higher than estimates based on functional group measurements by FTIR spectroscopy for samples col-lected in northeastern Asia and the Carribean (1.2–1.6, mean
≈1.4 µg/µgC) (Russell, 2003).
The average OM:OC ratio of submicron organic aerosols (OOA plus HOA) estimated with this procedure is ∼1.8, a
50
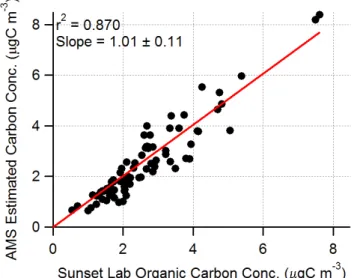
Figure 10.
Fig. 10. Scatter plot between organic carbon concentra-tions estimated from AMS mass spectra and component-specific
m/zelemental compositions, and those measured by the Sunset Lab carbon analyzer.
value that is close to the number determined by comparing organic mass concentration from the AMS and organic car-bon concentration from a Sunset labs carcar-bon analyzer (Zhang et al., 2005b). It is also comparable to the number (1.6±0.2) proposed by Turpin and Lim (2001) for urban aerosols. This analysis is summarized in Fig. 10, where the organic carbon contents derived from the HOA and OOA mass spectral anal-ysis show good agreement with the organic carbon (OC) con-centrations from the carbon analyzer (r2=0.87 and the linear regression slope=1.01±0.11).
3302
Figure 11.
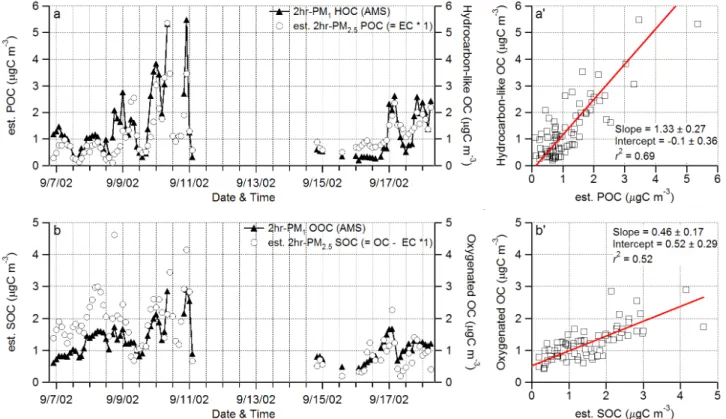
Q. Zhang et al.: Hydrocarbon-like and oxygenated organic aerosolsFig. 11. (a) and (a’) Time series, scatter plot and linear regression between (a) & (a’) hydrocarbon-like organic carbon (HOC) concentrations from the AMS measurements and primary organic carbon (POC) concentrations estimated from the EC measurements assuming a POC to EC ratio of 1 and (b) & (b’) oxygenated organic carbon (OOC) concentrations and secondary organic carbon concentrations (SOC=OC– POC). AMS HOA and OOA data were reduced to 2 h averages according to EC/OC measurement time intervals. Missing data during 11 September–15 September were due to malfunction of the Sunset Laboratory carbon analyzer. The linear regression parameters and r2’s are shown in the scatter plots.
3.4 Comparison with results from previous studies
3.4.1 Comparison with estimates from the EC/OC tracer method
The elemental carbon (EC)/organic carbon (OC) tracer method has been frequently used to estimate the carbon con-centrations of primary and secondary organic aerosol (POC and SOC, respectively) (Cabada et al., 2002, 2004a; Cas-tro et al., 1999; Park et al., 2005; Polidori et al., 20052; Turpin and Huntzicker, 1991, 1995). This method derives the POC concentration based on the EC measurements as-suming a constant POC to EC ratio (Turpin and Huntzicker, 1991, 1995). SOC is subsequently estimated as the differ-ence between measured total OC and the estimated POC based on the assumption that SOA is formed through gas to particle conversion that involves no EC emissions. Note that the POC and SOC concentrations thus estimated may con-tain significant uncercon-tainties due to 1) the operational defini-tion for the OC and EC fracdefini-tions in thermal-optical analysis (Gelencser, 2004; Turpin et al., 2000); 2) the uncertainties associated with the estimated POC/EC ratios for the average of the combustion emission sources (Turpin and Lim, 2001);
and 3) variations in time of POC/EC ratios due to factors such as varying fractions of diesel and gasoline vehicles on the road (Harley et al., 2005). Despite these limitations, the EC/OC method has been applied frequently because of the lack of direct measurement techniques that can distinguish POA from SOA (Kanakidou et al., 2005).
The POC and SOC concentrations during this study are estimated using the PM2.5 EC and OC data from
thermal-optical transmittance carbon analysis (Polidori et al., 20052): POC=1×EC and SOC=OC–POC. The POC/EC ratio of 1 was estimated based on summertime emission invento-ries in Pittsburgh (Cabada et al., 2002). Figure 11 com-pares the POC and SOC estimates to the concentrations of hydrocarbon-like and oxygenated organic carbon (HOC and OOC, respectively) estimated according to their estimated molecular compositions (see Sect. 3.3). Overall, HOC cor-relates well to POC (r2=0.69, Figs. 11a and 11a’) and OOC correlates with SOC (r2=0.52; Figs. 11b and 11b’). These correlations are consistent with the diurnal variation patterns, mass spectra, and size distributions of HOA and OOA, which all corroborate the hypothesis that most or all HOA is POA and that most or all OOA is SOA.
Q. Zhang et al.: Hydrocarbon-like and oxygenated organic aerosols 3303
52
HOA (34%)
(a) AMS estimates
OOA (66%) POA (53%) (d) POC:EC = 2:1 POA (36%) (b) POC:EC = 1.2:1 POA (29%) (c) POC:EC = 1:1 SOA (64%) SOA (71%) SOA (47%)
Figure 12
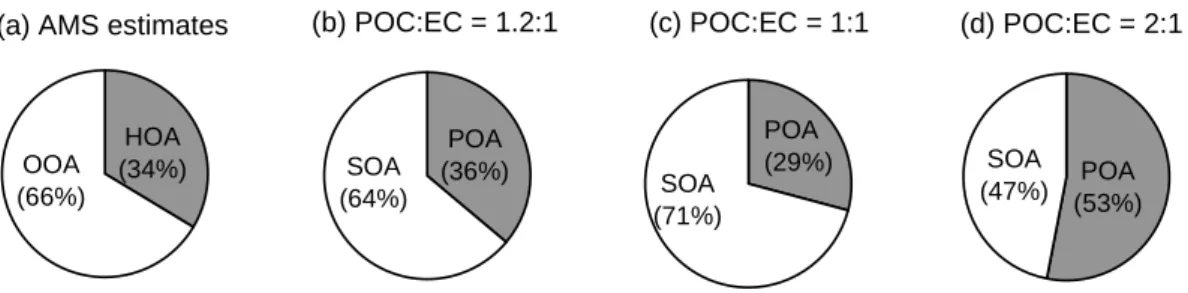
Fig. 12. Fractional distributions of (a) HOA and OOA estimated from the AMS data and POA and SOA estimated from OC/EC measure-ments assuming POC-to-EC ratio (b)=1.2, (c)=1 and (d)=2. POA and SOA are converted from POC and SOC assuming OM:OC ratios of 1.2 µg m−3/µgC m−3and 2.2 µg m−3/µgC m−3, respectively.
The linear regression fit to HOC vs. POC has a slope of 1.33±0.27 µgC/µgC) and an intercept of
−0.10±0.36 µgC m−3(Fig. 11a). In contrast, the fit to OOC vs. SOC yields slope=0.46±0.17 µgC/µgC with intercept of 0.52±0.29 µgC m−3. The slopes of HOC vs. POC and OOC vs. SOC obtained with the intercept fixed at zero are 1.23±0.22 and 0.74±0.35, respectively. Note that perfect agreement between these two estimates of POC and SOC is not expected because they were estimated by completely dif-ferent methods under difdif-ferent assumptions. In addition, un-certainties associated with both measurements and data anal-ysis procedures may also contribute to the observed discrep-ancy. For instance, there appear to be some changes in the correlation patterns after 11 to 14 September – a gap of miss-ing POC and SOC data due to a major component failure of the EC/OC analyzer (J. Cabada, Tecnol´ogico de Monterrey, personal communication).
As pointed out at the beginning of this section, the sound-ness of the OC/EC method for predicting POC and SOC is strongly influenced by the choice of the POC to EC ra-tio and the validity of the assumpra-tion that this rara-tio is rel-atively constant during the time period of interest. To il-lustrate this first point, we compare in Fig. 12 the frac-tional distribution of POA and SOA obtained from the AMS data to those obtained from the EC/OC tracer method us-ing different POC to EC ratios: 1) POC/EC=1.2, which is the average HOC to EC ratio estimated from this study; 2) POC/EC=1, which is estimated based on emission inventory for Pittsburgh in the summer (Cabada et al., 2002); and 3) POC/EC=2, which is approximately the average of a range of ratios estimated based on measured OC/EC ratios during periods dominated by primary emissions and with low O3
(Cabada et al., 2004a; Polidori et al., 20052). POA and SOA are estimated from the POC and SOC results of the EC/OC method assuming OM:OC ratios of 1.2 µg m−3/µgC m−3 and 2.2 µg m−3/µgC m−3, respectively (see Sect. 3.3).
As shown in Figs. 12a and b, the fractional distribution of POA/SOA estimated from EC/OC measurements agrees very well to that determined from the AMS data when POC/EC=1.2 is used. In comparison, assuming POC/EC=1 yields higher fraction of SOC (Fig. 12c) while assuming
POC/EC=2 projected from ambient measurements leads to significantly less SOC and twice more POC (Fig. 12d). Note that POC/EC=2 may be a significant overestimation since fine particles in Pittsburgh are strongly influenced by re-gional sources and thus contain a relatively high background of oxidized organic species (Anderson et al., 2004; Tang et al., 2004; Zhang et al., 2005b). Even during periods with intense primary emissions and reduced mixing (e.g., morn-ing rush hour) OOA contributes more than 50% of the total organic mass on average (Fig. 1). In addition, a low concen-tration of O3does not necessarily imply that SOA is also low
because O3 is a much shorter-lived photochemical product
than SOA. O3can be titrated away quickly by NO emitted
by traffic, while SOA will persist. Figure 3d, for example, shows that the r2between OOA and O3is almost zero during
this study (see Sect. 3.1.2). In fact, based on the OOA/HOA ratios observed during the morning rush hour (∼1.3:1), we estimate that the POC/EC assumptions projected from ambi-ent measuremambi-ents in Pittsburgh may be biased high by up to a factor of 2, suggesting that POC/EC∼1 is a better estimate. In addition, these comparisons, together with the good cor-relation between HOA and EC, also indicate that the EC/OC tracer method can produce a useful estimation of POC and SOC as long as the correct POC/EC ratio is given. Othwise, the POC and SOC estimates can have considerable er-rors if this ratio is not well constrained (as is often the case in practice).
3.4.2 Comparison with results from VOC-based factor analysis
Millet et al. (2005) also estimated the fraction of secondary carbon in Pittsburgh aerosols during July–August 2002, based on a new hybrid source apportionment method incor-porating elements of the EC/OC tracer method and of joint factor analysis of a large set of VOCs. These authors esti-mate an OC/EC ratio of 1.36 for primary combustion emis-sions, in qualitative agreement with our results discussed in the previous section. They also estimate that secondary or-ganic carbon contributed 37% of the total carbon, while 35% of the carbon was classified as regional background.
3304 Q. Zhang et al.: Hydrocarbon-like and oxygenated organic aerosols
53 Figure 13
Fig. 13. Average diurnal profiles of HOA mass concentrations and CO during 7–22 September 2002 in Pittsburgh.
It is likely that the secondary OC estimated by Millet et al. was primarily oxygenated given the high similarity be-tween the mass spectra of SOA and OOA in Pittsburgh (see Sect. 3.5.2). It is also likely that the majority of the regional background OC from Millet et al. study was oxygenated, be-cause 1) OOA on average accounts for 80% of the total OA in afternoon and 2) the diurnal profile of OOA concentration is relatively flat in Pittsburgh (Fig. 2), which suggests rela-tively small local production of OOA in comparison to the regional contribution (see discussion in Sect. 3.1). We there-fore estimate that “secondary” and “background” carbon in the Millet et al. study (which in total accounts for 72% of the OC during their study) was mostly oxygenated. This frac-tion is even larger than the OOC fracfrac-tion we estimated for the present study (see Fig. 12), which may be due to the rea-son that the Millet et al. study took place in the middle of the Summer when photochemical activity and SOA produc-tion was higher than for our study period at the end of the Summer.
3.5 Sources and processes of HOA and OOA
As discussed above, the diurnal variations, size distributions and mass spectra of HOA and OOA and their correlations with combustion and secondary aerosol tracers all suggest that HOA are mainly primary organic aerosols from com-bustion processes while OOA are mostly produced from sec-ondary processes. In this section, we will examine the evo-lution of HOA and OOA and gain further insights into the possible sources and processes of these two aerosol types.
3.5.1 HOA aging and processing
Recent studies have suggested that primary organic aerosols may undergo substantial photochemical oxidation and might contribute significantly to the oxygenated OA pool in urban particles (Robinson et al., 2005). To evaluate this point, in Fig. 13 we compare the diurnal profiles of HOA and CO un-der the consiun-deration that CO is a comparatively long-lived tracer of combustion emissions (cf. 1 month lifetime in the troposphere; Finlayson-Pitts and Pitts, 2000). On this plot, the y-axes of HOA and CO are scaled from zero and 100 ppb (the background level of CO in Northern Hemisphere),
re-spectively, to their morning maxima. The rationale behind this figure is that significant HOA oxidation would appear as a lowering of the HOA/CO ratio during photochemically ac-tive periods (e.g., between 13:00–15:00 EST), assuming rel-atively constant HOA to CO emission ratios throughout the day.
The synchronous decrease in the concentrations of CO and HOA around 07:00–08:00 a.m. is primarily the result of atmospheric dilution due to increasing mixed layer height. Overall the diurnal curve of HOA tracks that of CO during the day, suggesting that there is little oxidation of HOA on a time scale of several hours. This observation is consistent with previous field studies which did not observe any ap-preciable aging of particle-phase alkanes over similar time-scales (Schauer et al., 1996) and with recent laboratory stud-ies which suggest that the time scale for such oxidation is on the order of one week (Molina et al., 2004). Note that small variations in the HOA/CO ratio may reflect differences in di-urnal activity cycles of different sources which emit these species in different ratios, such as diesel and gasoline vehi-cles (Harley et al., 2005).
3.5.2 Evolution of OOA during new particle growth
We examine in this section a particle event on 12 Septem-ber 2002 (Fig. 14) in which intense new particle formation was observed starting at 08:10 in the morning (Zhang et al., 2004). Meterological conditions in the beginning of this day resulted in low aerosol loadings that were favorable for new particle formation. The subsequent growth of these particles was observed as condensation of fresh secondary inorganic (SO2−4 )and organic aerosol species that were formed from photochemical activity after 9:30 a.m. While an extensive discussion of the chemistry and microphysics of new par-ticle growth for this event has been provided in a previous manuscript (Zhang et al., 2004), we revisit this event here be-cause it offers a unique opportunity to probe and characterize the HOA and OOA content of freshly formed secondary or-ganic aerosol species that are responsible for condensational growth of the new particles.
Figure 14 shows an overview of the time trends of vari-ous gas and aerosol species during this day. It is clear from the figure that the time series of HOA and CO track each other, staying flat from 10:00 a.m. to roughly 05:00 p.m., while the OOA concentration increased after ∼10:00 a.m., together with increase of O3. OOA continued to increase
un-til 08:00 p.m. while O3 declined after ∼05:00 p.m., likely
as O3production decreased and was titrated by NO emitted
from traffic, accentuated by reduced vertical mixing of the emitted NO in the late afternoon and evening.
Figures 14b–e display the image plots that illustrate the evolution of four aerosol parameters: condensational sink (CS, in units of cm−2)and the mass concentrations of SO2−4 , OOA, and HOA during 12 September 2002. CS is a mea-sure of the available surface area for condensation (Pirjola
Q. Zhang et al.: Hydrocarbon-like and oxygenated organic aerosols 3305
54
Figure 14
Fig. 14. (a) Time series of HOA, OOA, CO, and O3, (b) evolution of the size distributions for condensational sink (CS) of vapor molecules
with estimated molecular weight =100 g/mol, and (c—e) mass concentrations of sulfate, OOA, and HOA during 12 September 2002 – a day when an intense new particle formation event occurred at 08:10 a.m. The four stages (I–IV) of the nucleation and growth are marked on the plot (a). To the right of the corresponding image plot are the average size distributions of each parameter during these four stages (b’–e’). Missing data (white areas in plot and white areas in plots b–e) are due to either occasional instrumental malfunction or mainte-nance/calibration.
3306 Q. Zhang et al.: Hydrocarbon-like and oxygenated organic aerosols
Figure 15.
Fig. 15. Average size distribution of the condensational sink, and size distribution of the increase in OOA mass concentration (1OOA) during 14:30–17:08 (period IV) on 12 September 2002. The condensational sink was estimated assuming that the average molecular weight of the condensable vapor molecules is 100 g/mol. A particle density of 1.5 g/cm3 is assumed to relate Dm to Dva (Dva=ρ×Dm) (DeCarlo et al., 2004).
et al., 1999). It was calculated from the number distribution in the mobility diameter range of 3–680 nm as measured by SMPS assuming an average molecular weight for the con-densing species of 100 g/mol. The image plots of HOA and OOA are relatively noisy because both are calculated from only one m/z and therefore have lower signal-to-noise ratios. To the right of the image plots are the average size distribu-tions of the corresponding parameters during four consecu-tive periods (I–IV) of this event (Figs. 14b’–14e’). Period I (08:10–09:30) corresponds to the initial stage of new par-ticle formation when the nucleation mode parpar-ticle number increased greatly; Periods II (09:30–11:30) and III (11:30– 14:30) represent the growth period when the number of nu-cleation mode particle number declined while the Aitken mode number increased; and Period IV (14:30–17:05) corre-sponds to a later period in the event when both the nucleation mode and the Aitken mode numbers were decreasing (Zhang et al., 2004). Note that the AMS can only detect particles that have grown into the Aitken mode (>33 nm Dva)(Zhang et
al., 2004).
The evolution patterns of the size distributions of HOA and OOA are substantially different, with ultrafine HOA (<100 nm) decreasing sharply after 09:30 a.m. and ultrafine OOA increasing throughout the day. This OOA behavior is similar to that of sulfate, except that sulfate also exhibits an intermediate mode (Dva=∼100–250 nm) at the beginning of
the event – during Periods I and II (Figs. 14c–d and 14c’–d’). As discussed in Zhang et al. (2004) the intermediate mode particles that suddenly appeared at around 08:00 a.m. on 12 September were composed of ammonium sulfate and likely were mixed in from the air mass aloft when the boundary
layer grew in the morning. We speculate that these parti-cles were the product of nucleation and growth in the pre-vious day from a large SO2-containing air mass. However,
although the intermediate mode contained little OOA during period I, an intermediate mode of OOA together with the ul-trafine mode for this species gradually emerged after around noon or so (Figs. 14d and 14d’). By Period IV (14:30– 17:05 EST) the size distributions of OOA and SO2−4 are very similar and both show tri-modal characteristics (Figs. 14c, 14c’, 14d, and 14d’), suggesting that the growth of OOA was due to condensation of secondary organics on all the avail-able surface area.
Further evidence for this condensation mechanism is the fact that the growth patterns of OOA and sulfate (Figs. 14c and d) are consistent with the aerosol condensational sink distributions (Fig. 14b). This is seen more clearly in Fig. 15, which shows the size-dependent increase of the OOA con-centration follows the average CS distribution during Period IV. In contrast, there is no obvious evidence of condensa-tional growth of the HOA mode on this day (Figs. 14e and 14e’). These observations provide strong evidence that the increase in OOA during this event reflects condensation of freshly formed SOA, supporting the hypothesis that pho-tochemically produced secondary organic aerosols played an important role in new particle growth during this event (Zhang et al., 2004).
Figure 16 compares the OOA mass spectrum observed during this new particle growth event with the OOA mass spectrum observed over the entire study period. These two spectra are very similar, suggesting that OOA in Pittsburgh (at least during this study) is primarily SOA. This hypoth-esis is consistent with the fact that 1) similar mass spectra suggest similar chemical compositions; 2) HOA oxidation appears to be negligible on the timescales of several hours (see Sect. 3.5.1); and 3) other oxygenated primary organic aerosols (including biomass burning and meat cooking OA) are unlikely to be present at significant concentration dur-ing this study (Pekney et al., 2005). The similarity between spectrum dominated by freshly formed SOA (with an appar-ent age of a few hours) and the average OOA during the study (with a likely average age of a few days) indicates that fresh SOA has a similar oxidation level (i.e. O:C ratio) as regional OOA in Pittsburgh. Since OOA appears to be highly oxy-genated (see Sect. 3.3) this observation suggests that a large fraction of SOA in Pittsburgh is already highly oxygenated when first formed, rather than being produced by slow oxi-dation of a less-oxygenated fresh SOA.
Finally we can use the data in Fig. 14a to calculate the relative photochemical production rates of OOA and O3.
Between 10:00 a.m. to 4:00 p.m. on 12 September 2002, OOA and O3increase with a nearly constant growth rates of
∼0.19 µg m−3h−1for OOA and 5 ppb h−1for O3, that yield
an observed ratio ∼38 ng m−3OOA/ppb O3(or equivalently
26 ppb O3/µg m−3 OOA). As discussed above the
concen-trations of OOA and O3 do not correlate for the study as a
Q. Zhang et al.: Hydrocarbon-like and oxygenated organic aerosols 3307
Fig. 16. Comparison of the OOA mass spectrum extracted from the entire study period vs. that during an intense new particle formation and growth period on 12 September 2002.
whole, likely due to the high background of OOA that buries its relatively small local production. However in the after-noon of 12 September 2002, because of the low background of OOA and intense UV light (Zhang et al., 2004), the in-crease of OOA due to photochemical production becomes more apparent and correlates with the increase of ozone. Al-though this ratio of observed SOA to O3apparent production
efficiencies is only characteristic of the air mass sampled that day, it is of great interest to compare it with other studies in the future.
4 Conclusions
This paper reports the mass concentrations, size distribu-tions, and temporal variations of hydrocarbon-like and oxy-genated organic aerosols in Pittsburgh during September 2002 and discusses the possible sources and processes of these two aerosol components. HOA and OOA together cap-ture nearly 100% of the organic aerosol mass with HOA rep-resenting 34% of the total on average and OOA reprep-resenting 66%.
The time series of HOA correlates well with those of com-bustion source tracers, including NOx, CO, and EC, and
demonstrates a well-defined diurnal pattern that peaks dur-ing morndur-ing rush hours and decreases with the rise of the boundary layer. The size distribution of HOA shows a promi-nent ultrafine mode that on average accounts for ∼1/3rd of the HOA mass. These observations, together with the mass spectrum of HOA, which is dominated by ion series char-acteristic for long chain hydrocarbons, indicate a direct cor-respondence of HOA to primary OA from local emissions (likely from combustion processes).
The time series and size distribution of OOA are distinctly different from those of HOA, but show close similarity to those of SO2−4 – a major secondary aerosol species in the Pittsburgh region. The diurnal profiles of both OOA and SO2−4 are relatively flat and their size distributions are gen-erally dominated by the accumulation mode. These observa-tions, together with the fact that the mass spectrum of OOA highly resembles those of aged and oxidized OA, suggests
the secondary and regional nature of Pittsburgh OOA. The direct correspondence of OOA to SOA is particularly evi-dent during an intense new particle formation and growth event, when condensational growth of OOA was found to be mainly responsible for the increase of OOA mass. In ad-dition, according to the observed HOA/CO emission ratios and ambient CO levels, oxidation/aging of HOA appears to be very small on the time scale of several hours.
Based on the mass spectra of HOA and OOA and the likely elemental compositions of major m/z’s, we estimated the carbon contents of HOA and OOA and their average OM:OC ratios, which are 1.2 and 2.2 µg/µgC for HOA and OOA, respectively. The average OM:OC ratio for bulk organ-ics is estimated at 1.8 µg/µgC. This represents the first di-rect estimate of the OM:OC ratio from highly time-resolved chemical composition measurements. The total carbon con-centrations (=HOC+OOC) thus estimated agree well with those measured by the Sunset Lab Carbon analyzer (r2=0.87; slope=1.01±0.11). The carbon concentrations of HOA and OOA correlate well to those in POC and SOC estimated by the OC/EC tracer technique assuming POC-to-EC ratio=1, respectively. In addition, based on the comparisons of the fractional distribution of HOC and OOC to those of POC and SOC estimated from the EC/OC measurement applying different POC to EC ratios, it appears that the EC/OC tracer method can provide a useful estimation of POC and SOC, at least in Pittsburgh, as long as the correct POC/EC ratio is used.
Appendix
The AMS with a quadrupole mass spectrometer (Q-AMS) can only scan a subset of m/z’s (typically <20) in the particle time-of-flight mode for a given study (Jimenez et al., 2003), from which the size distributions of bulk organic aerosols are estimated (Allan et al., 2003b). Depending on the se-lection of the organic m/z’s scanned, the estimated size dis-tribution of bulk organic aerosol may be biased to different degrees. Note that the new time-of-flight AMS (ToF-AMS) acquires the size distribution of each m/z’s simultaneously