HAL Id: hal-00303117
https://hal.archives-ouvertes.fr/hal-00303117
Submitted on 5 Oct 2007HAL is a multi-disciplinary open access
archive for the deposit and dissemination of sci-entific research documents, whether they are pub-lished or not. The documents may come from teaching and research institutions in France or abroad, or from public or private research centers.
L’archive ouverte pluridisciplinaire HAL, est destinée au dépôt et à la diffusion de documents scientifiques de niveau recherche, publiés ou non, émanant des établissements d’enseignement et de recherche français ou étrangers, des laboratoires publics ou privés.
Influence of particle size and chemistry on the cloud
nucleating properties of aerosols
P. K. Quinn, T. S. Bates, D. J. Coffman, D. S. Covert
To cite this version:
P. K. Quinn, T. S. Bates, D. J. Coffman, D. S. Covert. Influence of particle size and chemistry on the cloud nucleating properties of aerosols. Atmospheric Chemistry and Physics Discussions, European Geosciences Union, 2007, 7 (5), pp.14171-14208. �hal-00303117�
ACPD
7, 14171–14208, 2007Chemistry and cloud nucleating properties of aerosols P. K. Quinn et al. Title Page Abstract Introduction Conclusions References Tables Figures ◭ ◮ ◭ ◮ Back Close
Full Screen / Esc
Printer-friendly Version Interactive Discussion
EGU
Atmos. Chem. Phys. Discuss., 7, 14171–14208, 2007 www.atmos-chem-phys-discuss.net/7/14171/2007/ © Author(s) 2007. This work is licensed
under a Creative Commons License.
Atmospheric Chemistry and Physics Discussions
Influence of particle size and chemistry
on the cloud nucleating properties of
aerosols
P. K. Quinn1, T. S. Bates1, D. J. Coffman1, and D. S. Covert2
1
NOAA Pacific Marine Environmental Laboratory, Seattle, WA 98115, USA
2
Joint Institute for the Study of the Atmosphere and Oceans, University of Washington, Seattle, WA 98105, USA
Received: 28 September 2007 – Accepted: 28 September 2007 – Published: 5 October 2007 Correspondence to: P. K. Quinn ([email protected])
ACPD
7, 14171–14208, 2007Chemistry and cloud nucleating properties of aerosols P. K. Quinn et al. Title Page Abstract Introduction Conclusions References Tables Figures ◭ ◮ ◭ ◮ Back Close
Full Screen / Esc
Printer-friendly Version Interactive Discussion
EGU Abstract
The ability of an aerosol particle to act as a cloud condensation nuclei (CCN) is a function of the size of the particle, its composition and mixing state, and the super-saturation of the cloud. In-situ data from field studies provide a means to assess the relative importance of these parameters. During the 2006 Texas Air Quality –
5
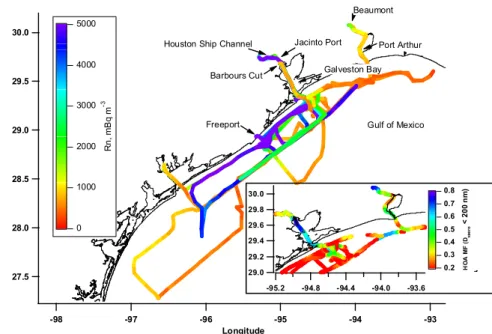
Gulf of Mexico Atmospheric Composition and Climate Study (TexAQS-GoMACCS), the NOAA RV Ronald H. Brown encountered a wide variety of aerosol types ranging from marine near the Florida panhandle to urban and industrial in the Houston-Galveston area. These varied sources provided an opportunity to investigate the role of aerosol sources, chemistry, and size in the activation of particles to form cloud droplets.
Mea-10
surements were made of CCN concentrations, aerosol chemical composition in the size range relevant for particle activation, and aerosol size distributions. Variability in aerosol composition was parameterized by the mass fraction of Hydrocarbon-like Or-ganic Aerosol (HOA) for particle diameters less than 200 nm (vacuum aerodynamic). The HOA mass fraction in this size range was lowest for marine aerosol and highest
15
for aerosol sampled close to anthropogenic sources. Combining all data from the ex-periment reveals that composition (defined by HOA mass fraction) explains 40% of the variance in the critical diameter for particle activation at 0.44% supersaturation (S). Correlations between HOA mass fraction and aerosol mean diameter show that these two parameters are essentially independent of one another for this data set. We
con-20
clude that, based on the variability of the HOA mass fraction observed during TexAQS-GoMACCS, composition played a significant role in determining the fraction of particles that could activate to form cloud droplets. In addition, we estimate the error that results in calculated CCN concentrations if the HOA mass fraction is neglected (i.e., a fully sol-uble composition of (NH4)2SO4is assumed) for the range of mass fractions and mean 25
diameters observed during the experiment. This error is then related to the source of the aerosol. At 0.22 and 0.44% S, the error is considerable (>50%) for anthropogenic
ACPD
7, 14171–14208, 2007Chemistry and cloud nucleating properties of aerosols P. K. Quinn et al. Title Page Abstract Introduction Conclusions References Tables Figures ◭ ◮ ◭ ◮ Back Close
Full Screen / Esc
Printer-friendly Version Interactive Discussion
EGU
mass fraction in the sub-200 nm diameter size range (vacuum aerodynamic). The error is lower for aerosol distant from anthropogenic source regions as it had a lower HOA mass fraction. Hence, the percent error in calculated CCN concentration is larger for organic-rich aerosol sampled near the source and smaller for aerosol sampled away from sources of anthropogenic particulate organic matter (POM).
5
1 Introduction
In both the IPCC Third and Fourth Assessment Reports (IPCC, 2001, 2007), aerosol indirect forcing is assigned the largest source of uncertainty among all climate forcing mechanisms. In the Fourth Assessment Report, the radiative forcing due to the first indirect or cloud albedo effect is given a low level of scientific understanding for liquid
10
water clouds. The cloud albedo effect occurs as the portion of aerosol that forms cloud condensation nuclei (CCN) increases in concentration and modifies the microphysical properties of clouds that impact the climate system. For a fixed liquid water content, an increase in CCN will lead to enhanced cloud droplet number concentration, decreased droplet size, and enhanced cloud albedo (e.g., Twomey, 1977). The ability of any
parti-15
cle within a population of aerosol particles to act as a CCN and nucleate cloud droplets is a function of its size and chemical composition as well as the supersaturation of the cloud parcel. For a distribution of particles the spectrum of CCN with respect to supersaturation depends on the median diameter, standard deviation, number concen-tration and the internal mixing state. Composition affects CCN activity by determining
20
molecular weight of the solute within a cloud droplet, solubility, degree of dissociation, and surface tension. Understanding how these parameters influence particle activation to form CCN is essential to improving estimates of cloud droplet formation by global climate models (e.g., Abdul-Razzak and Ghan, 2002; Fountakis and Nenes, 2005).
The relative importance of aerosol parameters (size distribution and composition)
25
and dynamical parameters (updraft velocity and liquid water content) in controlling cloud albedo has been the subject of many recent studies. Modeling studies have
ACPD
7, 14171–14208, 2007Chemistry and cloud nucleating properties of aerosols P. K. Quinn et al. Title Page Abstract Introduction Conclusions References Tables Figures ◭ ◮ ◭ ◮ Back Close
Full Screen / Esc
Printer-friendly Version Interactive Discussion
EGU
investigated links between aerosol parameters and cloud microphysical properties. Us-ing a cloud parcel model, FeUs-ingold (2003) found that the aerosol number concentration was consistently important for determining cloud drop effective radius while the impor-tance of other parameters varied for different conditions. Modeling studies have also investigated the influence of selected organic compounds and inorganic/organic
mix-5
tures on cloud drop number concentration (e.g., Shantz et al., 2003; Nenes et al., 2002; Mircea et al., 2002). A comparison of these studies revealed that predicted changes in droplet concentration due to the presence of organics in aerosols varied from −86% to +110% (Ervens et al., 2005). This wide range is a result of variability in the treatment of composition parameters in the models including solubility, molecular weight, and
10
surface tension suppression. Most of these previous studies focused on the impact of organic acids and water soluble organic carbon. Petzold et al. (2005) investigated carbonaceous particles produced by combustion and found that this insoluble OC dra-matically reduced CCN activation.
Measurements from recent field campaigns have been used to assess the
impor-15
tance of particle size versus composition in determining CCN concentrations. Based on measurements of a limited range of aerosol composition encountered at a non-urban site in Germany, Dusek et al. (2006) reported that variation in the size distribu-tion was able to explain 84 to 96% of the variance in measured CCN concentradistribu-tions. Measurements of a broader range of aerosol composition during several aircraft
cam-20
paigns indicated that both size and composition are required to accurately deduce CCN concentrations (Hudson, 2007). Here we investigate the roles of aerosol size and com-position in determining CCN concentrations based on measurements made during the 2006 Texas Air Quality – Gulf of Mexico Atmospheric Composition and Climate Study (TexAQS-GoMACCS; hereafter TexAQS) onboard the NOAA RV Ronald H. Brown.
25
During TexAQS, the NOAA RV Ronald H. Brown encountered a wide variety of aerosol types ranging from marine near the Florida panhandle to urban and indus-trial in the Houston-Galveston area (Fig. 1). This wide variability in aerosol sources and chemical composition provided an opportunity to investigate the role of chemistry
ACPD
7, 14171–14208, 2007Chemistry and cloud nucleating properties of aerosols P. K. Quinn et al. Title Page Abstract Introduction Conclusions References Tables Figures ◭ ◮ ◭ ◮ Back Close
Full Screen / Esc
Printer-friendly Version Interactive Discussion
EGU
and size in the activation of particles to form cloud droplets. For this purpose, measure-ments were made of the CCN number concentration at five different supersaturations, aerosol chemical composition in the size range where cloud drop activation is particu-larly sensitive to particle composition, and the particle size distribution.
For realistic updraft velocities and corresponding supersaturations of clouds,
com-5
position effects on cloud drop activation will be most pronounced for particles with diameters between about 40 and 200 nm (e.g., McFiggans et al., 2006). Regardless of composition, smaller diameter particles will not activate under these conditions while larger diameter particles will. Hence, it is this intermediate size range that is of interest when determining composition effects on CCN activation. It is significant, then, that
10
this size range (<200 nm) often contains a large mass fraction of particulate organic
matter (POM). Furthermore, the POM in this size range tends to be composed of rel-atively low solubility hydrocarbon-like organic aerosol (HOA) while POM measured at larger diameters is composed of oxygenated organic aerosol (OOA) (e.g., Zhang et al., 2005a, b; Alfarra et al., 2004; Allan et al., 2003) The presence of HOA in the smaller
15
size range may potentially amplify chemical effects in CCN activation (McFiggans et al., 2006).
In this study, we relate the HOA mass fraction (HOAMF) for vacuum aerodynamic
di-ameters (Dvaero)<200 nm and the geometric mean diameter (Dgn) of the aerosol
mea-sured during TexAQS to the critical diameter for activation (Dc). The goal of this anal-20
ysis is to examine the roles of particle composition and size in CCN activation for the variability in the aerosol observed during this experiment. In addition, the error imposed on calculated CCN concentrations by neglecting the HOA mass fraction is estimated and related to the source of the aerosol.
ACPD
7, 14171–14208, 2007Chemistry and cloud nucleating properties of aerosols P. K. Quinn et al. Title Page Abstract Introduction Conclusions References Tables Figures ◭ ◮ ◭ ◮ Back Close
Full Screen / Esc
Printer-friendly Version Interactive Discussion
EGU
2 Methods
2.1 Aerosol sampling inlet
Sample air for all aerosol measurements was drawn through a 6-m mast. The entrance to the mast was 18 m above sea level and forward of the ship’s stack. The mast was automatically rotated into the relative wind to maintain nominally isokinetic flow and
5
minimize the loss of supermicrometer particles. Air entered the inlet through a 5 cm diameter hole, passed through a 7◦ expansion cone, and then into the 20 cm inner diameter sampling mast. The flow through the mast was 1 m3min−1. The transmission efficiency of the inlet for particles with aerodynamic diameters less than 6.5 µm (the largest size tested) is greater than 95% (Bates et al., 2002).
10
The bottom 1.5 m of the mast were heated to establish a stable reference relative humidity (RH) for the sample air of 60±5%. On average, the aerosol was heated 2.5◦C above the ambient temperature. Stainless steel tubes extending into the heated
portion of the mast were connected to downstream aerosol instrumentation with either conductive silicon tubing or stainless steel tubing for analysis of organic aerosol.
15
The data reported here are based on air that was sampled only when the particle number concentration, the relative wind speed, and the relative wind direction all indi-cated that there was no possibility of contamination from the ship’s stack.
2.2 CCN concentration
A Droplet Measurement Technologies (DMT) CCN counter was used to determine CCN
20
concentrations at supersaturations of 0.22, 0.44, 0.65, 0.84, and 1.0%. Details con-cerning the characteristics of the DMT CCN counter can be found in Roberts and Nenes (2005) and Lance et al. (2006). A multijet cascade impactor (Berner et al., 1979) with a 50% aerodynamic cutoff diameter of 1 µm was upstream of the CCN counter. The instrument was operated in two different modes. When the ship was
25
concen-ACPD
7, 14171–14208, 2007Chemistry and cloud nucleating properties of aerosols P. K. Quinn et al. Title Page Abstract Introduction Conclusions References Tables Figures ◭ ◮ ◭ ◮ Back Close
Full Screen / Esc
Printer-friendly Version Interactive Discussion
EGU
trations fluctuated rapidly, a single supersaturation setting of 0.44% was often used. Away from sources when aerosol conditions were more stable, the five different super-saturations were cycled through over a 30 min period. For the multiple supersaturation mode, the first 2 min of each 6 min period were discarded so that only periods with stable supersaturations are included in the analyzed data set.
5
The CCN counter was calibrated before and during the experiment as outlined by Lance et al. (2006). An (NH4)2SO4aqueous solution was atomized with dry air, passed
through a diffusional drier, diluted and then introduced to a Scanning Mobility Parti-cle Sizer (SMPS, TSI). The resulting monodisperse aerosol stream was sampled si-multaneously by the CCN counter and a water-based Condensation Particle Counter
10
(WCPC, TSI) in order to determine the average activated fraction (CCN/CN). This pro-cedure was repeated for a range of particle sizes and instrumental supersaturations. The supersaturations reported in the text are based on the calibrations and not the instrumental readout which disregards thermal efficiency. The difference between the calibrated values and those reported by the instrument were similar to the difference
15
found by Lance et al. (2006).
2.3 Particle number size distributions
Size distributions from 20 to 200 nm and from 200 to 800 nm in geometric diameter were measured with two parallel differential mobility particle sizers (DMPS, Univer-sity of Vienna (Reischle) short and medium length columns, respectively) coupled to
20
condensation particle counters (CPC model 3760A, TSI). The relative humidity of the sheath air for both instruments was controlled such that the measurement RH was ap-proximately 60%. Mobility distributions were collected every 5 min. Details of the mo-bility distribution measurements and inversion methods are given by Bates et al. (2004) and Stratman and Wiedensohler (1997).
25
Size distributions from 0.9 to 10µm in aerodynamic diameter were measured with
an aerodynamic particle sizer (APS model 3321, TSI). Modifications were made to the APS to reduce internal heating of the sample air so that the measurement RH was
ACPD
7, 14171–14208, 2007Chemistry and cloud nucleating properties of aerosols P. K. Quinn et al. Title Page Abstract Introduction Conclusions References Tables Figures ◭ ◮ ◭ ◮ Back Close
Full Screen / Esc
Printer-friendly Version Interactive Discussion
EGU
close to 60%. Size distributions were collected every 5 min to match the DMPS scan time. APS size distributions were converted from aerodynamic to geometric diameters using densities based on the measured chemical composition (Quinn et al., 2002).
Geometric number mean diameters (Dgn) were calculated from a lognormal fit to
each measured size distribution. If the size distribution contained both an Aitken and
5
accumulation mode, the fit was performed on the larger accumulation mode. If only an Aitken mode was present in the submicrometer size range, it was used to determine
Dgn.
2.4 Particle chemical composition
Concentrations of submicrometer non-refractory NH+4, SO=4, NO−3, and POM were
mea-10
sured with a Quadrupole Aerosol Mass Spectrometer (Q-AMS, Aerodyne Research Inc., Billerica, MA). The AMS was downstream of a multijet cascade impactor with a 50% cutoff diameter of 1 µm (Berner et al., 1979). Sample air reaching the AMS was at an RH of 52±3.2%. The species measured by the AMS are referred to as non-refractory (NR) and are defined here as all the chemical components that vaporize at
15
the operating temperature of 550◦C. These species include most organic components, inorganics such as ammonium nitrate and ammonium sulfate salts but not mineral dust, elemental carbon, or sea salt. The POM aerosol was divided into two frac-tions, a hydrocarbon-like organic aerosol (HOA) and an oxygenated organic aerosol (OOA) using a multiple linear regression of m/z 57 and m/z 44, respectively (Zhang
20
et al., 2005a). The ionization efficiency of the AMS was calibrated every few days with dry monodisperse NH4NO3 particles using the procedure described by Jimenez
et al. (2003). The instrument operated on a 5 min cycle with the standard AMS aero-dynamic lens (Canagaratna et al., 2007).
The collection efficiency of the AMS is the product of the transmission of particles
25
through the aerodynamic lens (EL), the efficiency with which particles are focused by the lens and directed to the vaporizer (ES), and the degree to which particles are vaporized and analyzed versus bounced off the vaporizer (EB) (Huffman et al., 2005).
ACPD
7, 14171–14208, 2007Chemistry and cloud nucleating properties of aerosols P. K. Quinn et al. Title Page Abstract Introduction Conclusions References Tables Figures ◭ ◮ ◭ ◮ Back Close
Full Screen / Esc
Printer-friendly Version Interactive Discussion
EGU
Particle losses due to transmission through the lens were corrected by using the DMPS and APS-measured size distributions. This correction added, on average, 14±8% to the AMS total mass. Based on beam width probe data, there was no indication of particle loss due toEs. EB is a function of particle water content and chemical
compo-sition (Allan et al., 2003). Comparison of the size corrected (EL) AMS NR sulfate with 5
sulfate simultaneously measured with a particle-into-liquid-sampler coupled to an ion chromatograph (PILS-IC) indicates that EB varied from 1 for acidic sulfate (ammonium to sulfate molar ratio of <0.5) to 0.54 for ammonium sulfate. Therefore, EB was
as-signed to each 5 min sample based on the AMS ammonium to sulfate molar ratio with EB as an exponential function of the ammonium to sulfate molar ratio varying from 0.54
10
to 1 for ammonium to sulfate molar ratios of 2 to 0.5. There was no indication from the AMS mass size distributions that the ammonium to sulfate molar ratio varied as a function of size over the accumulation mode size range. A linear regression of 5 min transmission and bounce corrected AMS sulfate concentrations versus PILS-IC sulfate concentrations yielded a slope of 0.95 and anr2 of 0.81. The uncertainty in the AMS
15
concentration measurements during TexAQS/GoMACCS was estimated at ±20%.
2.5 Radon
Radon was detected with a dual-flow loop, two-filter detector (Whittlestone and Za-horowski, 1998). The radon detector was standardized using radon emitted from a permeation tube. Background counts were measured with the air flow set to zero.
20
3 Results
To relate aerosol sources and transport to CCN formation, the data set was segregated in two different ways. The first was based on geographical location and includes both offshore and inland sampling sites (Fig. 1). The offshore locations include a portion of the cruise track in the Atlantic Ocean as the ship transited from Charleston, SC to
ACPD
7, 14171–14208, 2007Chemistry and cloud nucleating properties of aerosols P. K. Quinn et al. Title Page Abstract Introduction Conclusions References Tables Figures ◭ ◮ ◭ ◮ Back Close
Full Screen / Esc
Printer-friendly Version Interactive Discussion
EGU
the TexAQS area. Additional offshore locations include the Gulf of Mexico during the initial transit to the Houston-Galveston area and subsequent visits over the course of the experiment. Inland locations include Galveston Bay which is the thoroughfare for ships transiting from the Gulf of Mexico to Houston, the Houston Ship Channel which is heavily impacted by marine vessel traffic and petrochemical and other industrial
5
activities, Barbours Cut which is located at the entrance to the east-west portion of the ship channel and is the site of a major container and cruise terminal, Jacinto Port which is located on the north side of the Houston Ship Channel, and Freeport which is the site of a large chemical plant.
The second data sorting procedure was based on surface wind direction and radon
10
concentrations. Radon was used in the data analysis to differentiate between sam-pled air from northerly flow that had been over the continent during the past day and “background” southerly flow from the Gulf of Mexico toward the continent. The radon threshold between continental and “background” air was 1000 mBq m−3(Fig. 1). This
sorting led to three categories 1) Gulf-Southerly Flow which includes samples taken
15
in the Gulf of Mexico during southerly flow and low radon concentrations and, hence, represents background air entering Texas, 2) Inland Texas-Southerly Flow which also includes samples taken during southerly flow and low radon concentrations but from in-land locations and, thus, represents background air entering Texas plus local sources near the sampling site, and 3) Northerly Flow which includes samples taken during
20
northerly flow and high radon concentrations and, therefore, represents continentally-influenced air masses impacted by both distant and local sources.
3.1 Aerosol composition and size during TexAQS 3.1.1 Aerosol composition
Previously reported AMS measurements indicate several general features concerning
25
the regional distribution of POM in terms of particle size and composition (Canagaratna et al., 2007). In general, in both rural and urban environments, the POM that occurs
ACPD
7, 14171–14208, 2007Chemistry and cloud nucleating properties of aerosols P. K. Quinn et al. Title Page Abstract Introduction Conclusions References Tables Figures ◭ ◮ ◭ ◮ Back Close
Full Screen / Esc
Printer-friendly Version Interactive Discussion
EGU
in the accumulation mode size range (200 to 500 nmDvaero) has a mass spectra that
is characteristic of oxygenated organic molecules (e.g., Zhang et al., 2005a, b; Alfarra et al., 2004; Allan et al., 2003; Boudries et al., 2004). This OOA is typically internally mixed with inorganic species such as ammonium sulfate salts (e.g., Cubison et al., 2005). However, in urban environments there often is a second mode of POM with a
5
smaller mass mean diameter (Dvaero∼100 nm) that has a mass spectrum characteristic
of hydrocarbons (Allan et al., 2003; Drewnick et al., 2004; Zhang et al., 2005b) and that is very similar to what has been measured in fresh vehicle exhaust (Canagaratna et al., 2004; Schneider et al., 2005).
Results from TexAQS are consistent with these previously reported measurements.
10
The mass fraction of HOA forDvaero<200 nm often exceeded 0.5 for the inland portions
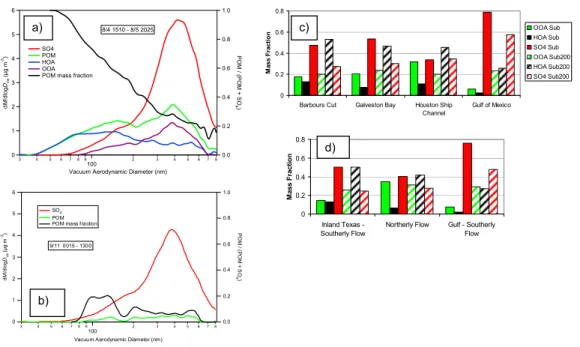
of the cruise track (Galveston Bay, Barbours Cut, Beaumont, and Port Arthur) where urban and marine vessel emissions were most pronounced (Fig. 1). Size distributions of the POM components, sulfate, and POM mass fraction are shown in more detail in Fig. 2a for a period when the ship was docked for thirty hours at Barbours Cut on 4
15
and 5 August. The POM mass fraction is calculated as the mass concentration of POM divided by the total mass measured by the AMS. AMS size distributions averaged over this period show the occurrence of POM in the accumulation mode at about one third the mass concentration of sulfate. The majority of this POM was OOA. In contrast, POM dominated the Aitken mode (mass meanDvaeroof 160 nm) and was composed 20
primarily of HOA. The POM mass fraction was 0.45 atDvaero= 200 nm and increased
steadily to near one atDvaeroof 50 nm.
Figure 2b shows the same information for a 13 h period on 11 September when the ship was offshore in the Gulf of Mexico. During this period, local winds were from the south at less than 5 m s−1 and radon concentrations were low indicating that the
25
sampled air mass had not had recent contact with land. In this case, sulfate dominated the submicrometer mass at all sizes such that the POM mass fraction was 0.25 or less for all particle diameters. The majority of the sulfate was most likely due to emissions
ACPD
7, 14171–14208, 2007Chemistry and cloud nucleating properties of aerosols P. K. Quinn et al. Title Page Abstract Introduction Conclusions References Tables Figures ◭ ◮ ◭ ◮ Back Close
Full Screen / Esc
Printer-friendly Version Interactive Discussion
EGU
from the large number of marine vessels in the upwind region (Bates et al., 20071). To compare the degree to which HOA contributed to the sub-200 nm mass versus the entire submicrometer size range, HOA, OOA, and sulfate mass fractions were cal-culated for these two size ranges. Mass fractions were calcal-culated as the mass of the component divided by the total mass measured by the AMS. Average mass fractions
5
for the periods spent in Barbours Cut, Galveston Bay, the Houston Ship Channel, and the Gulf of Mexico are shown in Fig. 2c. On average, for the inland sampling locations, sulfate dominated the submicrometer mass with OOA having the second largest mass fraction. Average submicrometer mass fractions of HOA were less than 0.14 for each of the inland locations (Barbours Cut: 0.13±0.11, Galveston Bay: 0.07±0.08, Houston
10
Ship Channel: 0.11±0.08). The sub-200 nm mass fractions look very different, how-ever, with average HOAMF of 0.53±0.20 at Barbours Cut, 0.47±0.21 in Galveston Bay, and 0.45±0.16 in the Houston Ship Channel. Relative to the inland sampling locations, both submicrometer and sub-200 nm HOAMFwere lower for the offshore trips into the Gulf of Mexico. Averaged over all the times the ship spent in the Gulf of Mexico, the
15
submicrometer HOAMF was 0.02±0.03 compared to a sub-200 nm value of 0.26±0.19.
Figure 2a shows that not only the mass fractions but also the size distributions of HOA, OOA, and sulfate are different within the sub-200 nm size range. Sulfate and OOA tail into this size range meaning that their largest concentrations occur at large diam-eters while HOA peaks in this size range and, therefore, has more broadly distributed
20
concentrations throughout the size range.
Average submicrometer and sub-200 nm mass fractions are shown for the different wind-radon regimes in Fig. 2d. For all three regimes, the submicrometer mass is domi-nated by sulfate with OOA having the second largest average mass fraction. However, for the Inland Texas – Southerly Flow regime, HOAMF and OOAMF are nearly the 25
1
Bates, T., Quinn, P., Coffman, D., Schulz, K., Covert, D. S., Johnson, J. E., Williams, E. J., Lerner, B. M., Tucker, S., and Brewer, A.: Boundary layer aerosol chemistry during Tex-AQS/GoMACCS 2006: Insights into aerosol sources and transformation processes, in prepa-ration, 2007.
ACPD
7, 14171–14208, 2007Chemistry and cloud nucleating properties of aerosols P. K. Quinn et al. Title Page Abstract Introduction Conclusions References Tables Figures ◭ ◮ ◭ ◮ Back Close
Full Screen / Esc
Printer-friendly Version Interactive Discussion
EGU
same reflecting the close proximity of the ship to anthropogenic sources. The OOAMF is about three times greater than the HOAMF for the Northerly Flow regime reflecting
the mix of distant and local sources in this category. Submicrometer average mass fractions for the Gulf-Southerly Flow regime are similar to the “Gulf of Mexico” cate-gory in Fig. 2b. For the two wind-radon regimes impacted by continental emissions,
5
HOA dominated the sub-200 nm size range. The HOAMF for this size range averaged 0.51±0.21 for the Inland Texas-Southerly Flow regime and 0.42±0.23 for the Northerly Flow regime.
In summary, the particle size range most sensitive to composition effects in CCN activation was, for much of the experiment, dominated by HOA, an organic component
10
whose mass spectrum is similar to those of diesel exhaust, lubricating oil, and freshly emitted traffic aerosols (Zhang et al., 2005a). In contrast, the organics within particles
withDvaero>200 nm were dominated by a component with a mass spectrum indicative
of aged, oxygenated organic aerosols. In the following analysis, the mass fraction of HOA for Dvaero<200 nm was used to represent the variability of aerosol composition 15
during the TexAQS experiment because of its prevalence in this composition-sensitive size range and its limited solubility which is expected to impact the CCN activation process.
3.1.2 Aerosol number size distribution
The geometric mean number diameter based on a lognormal fit of each measured size
20
distribution was used to indicate the variability of particle size during TexAQS. Only number modes contained in the submicrometer size range were considered. If the size distribution contained both an Aitken and accumulation mode, the fit was performed on the larger accumulation mode. If only an Aitken or accumulation mode was present, that mode was used to determine Dgn. The geometric standard deviation, σsg, or
25
width of the mode also has been shown in modeling studies to affect cloud drop num-ber concentrations (Feingold, 2003). For a givenDgnand total number concentration,
be-ACPD
7, 14171–14208, 2007Chemistry and cloud nucleating properties of aerosols P. K. Quinn et al. Title Page Abstract Introduction Conclusions References Tables Figures ◭ ◮ ◭ ◮ Back Close
Full Screen / Esc
Printer-friendly Version Interactive Discussion
EGU
comes broader, relatively more large particles are present and activated which leads to a suppression of the supersaturation. Hence, sensitivity to supersaturation becomes large, especially in polluted air masses dominated by larger particles. Neglecting the effects of σsg, as is done here, may lead to an overestimation of the impact of particle
size on CCN activation.
5
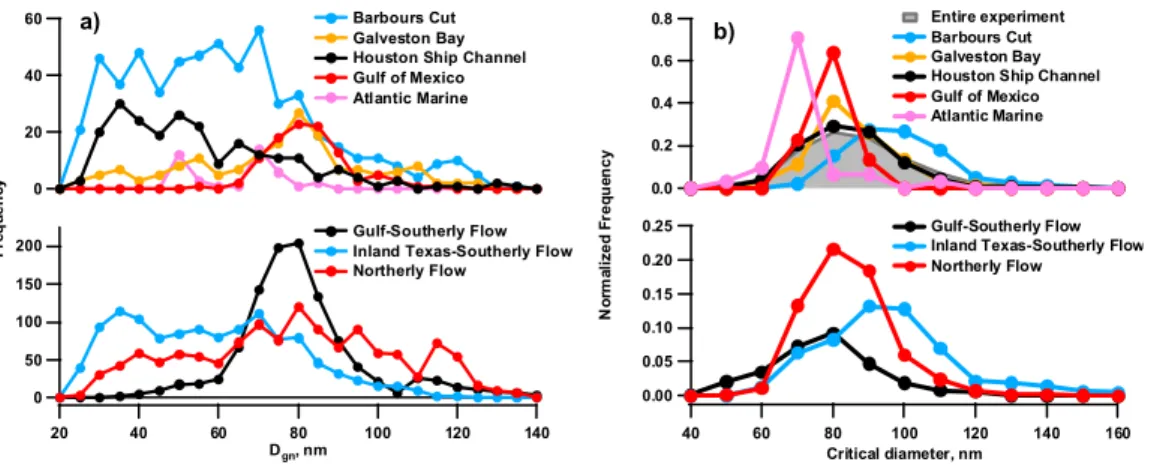
Near-source sampling locations (Barbours Cut and Houston Ship Channel) had high frequencies of lower values of Dgn (<70 nm) (Fig. 3a). Larger frequencies of
Dgn>70 nm occurred for Galveston Bay and Gulf of Mexico which are more distant
from anthropogenic continental sources. Correspondingly, the local sources picked up under Inland-Texas-Southerly Flow conditions led to a high frequency of smallerDgn
10
values while Gulf-Southerly Flow conditions had a high frequency ofDgn>70 nm. The
Northerly Flow regime which included both local and more distant continental sources had more broadly distributed values ofDgn.
Both the sub-200 nm HOA mass fraction and the mean diameter displayed general trends in the context of sampling location and wind direction-radon regimes as
dis-15
cussed above. There was no significant correlation between these two parameters, however, for either the individual sample categories or for the overall data set. The coefficient of determination, r2, forDgn versus HOAMF for the whole experiment was
0.14 indicating thatDgncould only explain about 10% of the variance in the HOAMF.
3.2 Impact of composition on CCN formation
20
3.2.1 Calculation of critical diameter
The correlation between critical diameter for CCN activation (Dc) and aerosol composi-tion was used to quantify the impact of composicomposi-tion on particle activacomposi-tion.Dcis defined
in this analysis as the diameter at which
CCNmeasured/CNintegrated= 1.0 (1)
ACPD
7, 14171–14208, 2007Chemistry and cloud nucleating properties of aerosols P. K. Quinn et al. Title Page Abstract Introduction Conclusions References Tables Figures ◭ ◮ ◭ ◮ Back Close
Full Screen / Esc
Printer-friendly Version Interactive Discussion
EGU
where CNintegrated was found by integrating the number concentration from the largest diameter measured down to the diameter where the above equation was satisfied. Normalized frequency distributions of Dc are shown at S=0.44% in Fig. 3b. Values ofDc calculated for the entire experiment extended up to near 170 nm. The highest
frequency of small values ofDc (<80 nm) corresponded to measurements of marine 5
aerosol made as the ship transited from South Carolina to the study region (denoted here as Atlantic Marine). Locations with a high frequency ofDc between 70 and 90 nm included the Gulf of Mexico and Galveston Bay. These locations are impacted by an-thropogenic emissions but are not immediately downwind. Values ofDc greater than 90 nm were most frequent for inland sampling locations next to urban and industrial
10
sources (Barbours Cut and the Houston Ship Channel). For reference, Dc of
ammo-nium sulfate at S=0.44% is 47 nm.
A comparison of values ofDccalculated for the different wind-radon regimes reveals distinct differences similar to those for the geographical sampling locations (Fig. 3b). The Gulf-Southerly Flow regime had the highest frequency of values at or less than
15
80 nm while the Inland Texas-Southerly Flow regime was just the opposite with the highest frequency of values at or greater than 90 nm. The highest frequency of values for the Northerly Flow regime occured between 70 and 90 nm which spans those of the other two regimes.
3.2.2 Relationship between HOA mass fraction and critical diameter
20
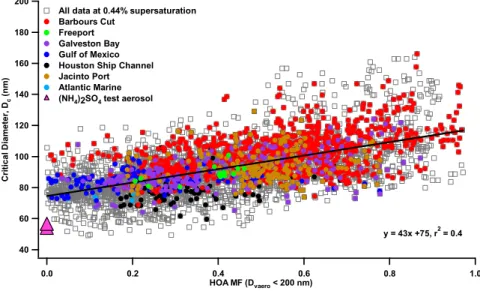
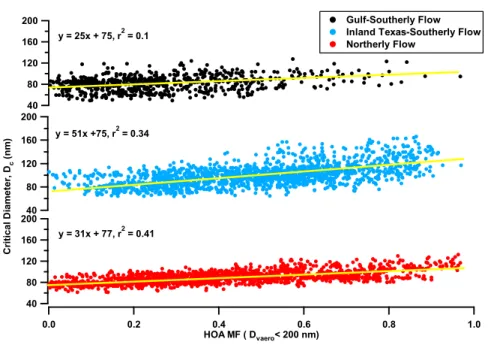
The HOA mass fraction for the sub-200 nm size range is plotted versusDc in Fig. 4
for the entire experiment and the geographical locations identified above and in Fig. 5 for the three wind-radon regimes. These plots only include measurements taken at S=0.44%. Over the course of the experiment, HOAMF spanned the maximum possible
range from near zero to near one.Dcranged from around 50 nm, which corresponds to
25
Dc of ammonium sulfate at S=0.44%, to near 170 nm. For each geographical location, an increase in HOAMF corresponded to an increase in Dc (Fig. 4). A regression of
ACPD
7, 14171–14208, 2007Chemistry and cloud nucleating properties of aerosols P. K. Quinn et al. Title Page Abstract Introduction Conclusions References Tables Figures ◭ ◮ ◭ ◮ Back Close
Full Screen / Esc
Printer-friendly Version Interactive Discussion
EGU
determination,r2, of 0.4 indicating that the HOAMF explained 40% of the variance in
Dc. The slope corresponds to a change in Dc of around 40 nm for the full range of HOAMF observed.
Positive correlations also were found for each of the three wind-radon regimes although the degree of correlation varied (Fig. 5). The correlation was strongest
5
(r2=0.41) for the Northerly Flow regime where HOAMF varied between near zero and
near one and mass concentrations were high so that the AMS signal-to-noise ratio was high. The correlation was weaker for the Inland Texas-Southerly Flow regime as con-centrations were lower and signal-to-noise ratio was higher. This noise issue and the occurrence of a narrower range of HOAMF most likely contributed to a poor correlation
10
(r2=0.1) for the Gulf-Southerly Flow regime.
The HOAMF–Dcrelationship is a strong function of supersaturation. Segregating the
data set by measurement supersaturation reveals a positive slope at each supersat-uration but the magnitude of the slope and the r2 values decreases with increasing supersaturation (Table 1). This change in slope is expected as composition becomes
15
less critical with increasing supersaturation.
A multivariate factor analysis was performed to more thoroughly assess the corre-lation between critical diameter, composition, and size. The analysis was performed using a principal component method with varimax rotation (SYSTAT 11, SYSTAT Soft-ware, Inc.) and the variables shown in Table 2. Table 2 shows the factor with the
20
highest loading for the critical diameter. Within this factor, the sub-200 nm HOA and POM mass fractions had the largest positive loadings (0.76 and 0.85, respectively) and the sub-200 nm SO=4 mass fraction had the largest negative loading (−0.87). Dgnhad
a relatively low negatively loading of −0.21. Hence, the multivariate analysis confirms the strong relationship between composition and critical diameter.
ACPD
7, 14171–14208, 2007Chemistry and cloud nucleating properties of aerosols P. K. Quinn et al. Title Page Abstract Introduction Conclusions References Tables Figures ◭ ◮ ◭ ◮ Back Close
Full Screen / Esc
Printer-friendly Version Interactive Discussion
EGU
3.3 Modeled sensitivity of CCN concentration to observed variability in composition and particle size
A sensitivity study was performed to determine the error in calculated CCN concentra-tions due to neglecting the HOA mass fraction. The equilibrium vapor pressure over the surface of a solution droplet is described by (Fitzgerald and Hoppel, 1984)
5 S = e ′ es − 1 = 2A d − Bdo3 d3 (2)
wheree′is the equilibrium vapor pressure over the curved surface of a solution droplet,
es is the equilibrium vapor pressure over a flat surface of pure water,
A = 2σMw ρwRvT (3) and 10 B =iερsMw ρwMs . (4)
Here,d and do are the droplet and dry particle diameters,σ is the surface tension, Mw
andMs are the molecular weights of water and solute,ρw andρs are the densities of water and solute,Rv is the gas constant for water vapor, T is the temperature,i is the
van’t Hoff factor, and ε is the water soluble fraction of the dry particle. By taking the first
15
derivative of Eq. (2) with respect to diameter and finding the maximum, the following equation relating critical supersaturation (Sc) toDc can be derived (e.g., Rogers and Yau, 1989; Corrigan and Novakov, 1999; Hudson, 2007)
Sc= " 32A3 27B #1/2 Dc−3/2. (5)
Using Eq. (5), Dc was calculated for a given value of Sc. In these calculations, the
20
ACPD
7, 14171–14208, 2007Chemistry and cloud nucleating properties of aerosols P. K. Quinn et al. Title Page Abstract Introduction Conclusions References Tables Figures ◭ ◮ ◭ ◮ Back Close
Full Screen / Esc
Printer-friendly Version Interactive Discussion
EGU
completely insoluble HOA. This composition was accounted for in the calculations by using ε=1–HOAMF and i =3 for the full dissociation of (NH4)2SO4. Ms and ρs were
assigned values corresponding to (NH4)2SO4.
CCN concentrations for a given supersaturation were calculated by integrating a modeled unimodal, log-normal size distribution over all diameters greater than theDc 5
that was found to correspond to the value of S using Eq. (5). Modeled size distributions were constructed using a geometric mean diameter varying between 20 and 140 nm. For each size distribution regardless ofDgn, the total number concentration was set to
3000 cm−3 and the geometric standard deviation was set to 1.5. Using this method,
CCN concentrations were calculated for a matrix of HOA mass fractions ranging from
10
0 to 1 and mean diameters ranging from 20 to 140 nm. Finally, the error incurred by neglecting the insoluble HOA mass fraction was calculated by taking a difference between a matrix where HOAMF=0 for all diameters and a matrix where HOAMF varied
from 0 to 1 at each diameter. The end result for calculated CCN concentrations and percent error in CCN concentrations is shown in Fig. 6.
15
Several assumptions made in this analysis warrant further discussion. As stated above, the mass spectrum of HOA is characteristic of long chain hydrocarbons and is similar to spectra measured for fresh vehicle exhaust and lubricating oil. Based on this information, it is assumed that the HOA mass fraction is insoluble. This assumption is supported by Petzold et al. (2005) who, based on measurements of combustion
parti-20
cles generated in a gas turbine engine, concluded that carbonaceous particles are very poor CCN. Furthermore, Saxena et al. (1995) reported that for urban aerosol, organic compounds decrease water adsorption by the inorganic fraction of the aerosol which, presumably, would lead to reduced CCN activation. Finally, based on simultaneous measurements of the hygroscopic growth factor and HOA mass concentration,
Cubi-25
son et al. (2006) reported that fresh, urban aerosol emissions dominated by HOA are virtually insoluble.
This analysis only includes composition effects on CCN activation that are associated with the fraction of insoluble material in the aerosol. In principle, the model could be
ACPD
7, 14171–14208, 2007Chemistry and cloud nucleating properties of aerosols P. K. Quinn et al. Title Page Abstract Introduction Conclusions References Tables Figures ◭ ◮ ◭ ◮ Back Close
Full Screen / Esc
Printer-friendly Version Interactive Discussion
EGU
modified to include chemical effects such as surface tension changes. However, the lack of surface tension data for the complex composition and mixture of atmospheric aerosol encountered would make the resulting calculations highly uncertain and would not necessarily improve the result.
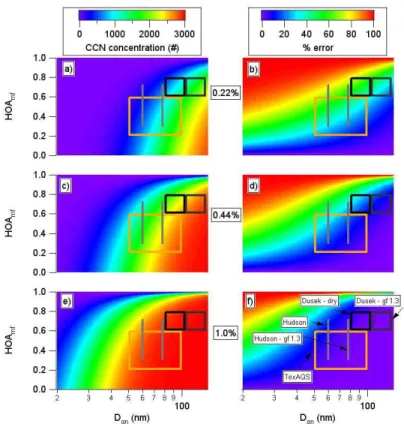
The combined effects of HOA mass fraction, mean diameter, and supersaturation on
5
calculated CCN concentrations are shown in Fig. 6. As expected, CCN concentrations are lowest for small diameter aerosol with a large HOA mass fraction and, conversely, highest for large aerosol that is composed primarily of (NH4)2SO4. Also as expected, as S increases, size and composition effects become less important so that only the smallest particles with the largest HOAMF remain unactivated.
10
Superimposed on Fig. 6 are boxes and lines representing the subsets of the com-position versus mean size CCN matrix that were observed during TexAQS, at a non-urban, mountain-top site in central Germany (Dusek et al., 2006), and during several aircraft experiments covering a wide range of aerosol sources and types (Hudson, 2007). Combining the measured variability with the model output allows the calculated
15
CCN concentrations and the error in calculated CCN concentrations due to neglecting the insoluble HOA to be put into “real-world space.” The box representing TexAQS ob-served variability is based on the standard deviation (1σ) of the mean of the HOAMF
and Dgn over the entire experiment. Hence, it is a conservative estimate of the vari-ability and does not include the full range of values observed. There are two boxes
20
representing the variability observed by Dusek et al. (2006). The first, labeled “Dusek-dry” is based on mean diameters of the size distributions shown in Fig. 2 and the range of POM mass fractions reported in Table 1 of Dusek et al. (2006). The POM mass fraction reported by Dusek et al. (2006) is for particle diameters less than 130 nm. We assume here that this Dusek et al. (2006) POM has the same limited solubility as the
25
TexAQS HOA. For comparison of the Dusek values ofDgn to the PMEL values, which
were measured at 60% RH, a growth factor of 1.3 (Maßling et al., 2003) was applied to the Dusek diameters. This RH-adjusted range of diameters is labeled as “Dusek – gf 1.3”. The line representing “Hudson” is based on reported values of diameter and B
ACPD
7, 14171–14208, 2007Chemistry and cloud nucleating properties of aerosols P. K. Quinn et al. Title Page Abstract Introduction Conclusions References Tables Figures ◭ ◮ ◭ ◮ Back Close
Full Screen / Esc
Printer-friendly Version Interactive Discussion
EGU
in Table 1 of Hudson (2006). “Hudson – gf 1.3” refers to the Hudson diameter adjusted to 60% RH. The CCN concentrations and percent error in calculated CCN for each corner of the TexAQS and Dusek boxes and for the minimum and maximum values on the Hudson lines are reported in Tables 3 and 4, respectively.
Calculated CCN concentrations corresponding to the range of observed variability
5
in HOAMF and Dgn are a strong function of supersaturation. At S=1.0%, CCN con-centrations are greater than 90% of the maximum possible value of 3000 cm−3 for the full range of observed HOAMF andDgn(60% RH) reported by Dusek et al. (2006) and Hudson (2007). At this same supersaturation, there is a 30% increase in CCN concen-tration in going from the highest HOAMF – smallestDgnto the lowest HOAMF – largest 10
Dgn of the TexAQS box. At lower supersaturations, however, the change in CCN over the range in observed variability is much larger. At S=0.44% (0.22%), for the full range of composition and size in the TexAQS box, the CCN concentration changes by a fac-tor 3.5 (16). Dusek et al. (2006) reported a smaller range of composition and size as well as larger absolute values of both POM mass fraction andDgn. Hence, the change
15
in calculated CCN concentration for the Dusek et al. (2006) conditions was less than observed during TexAQS. At S=0.44% (0.22%), the maximum change in CCN concen-tration is a factor of 1.8 (4.2), respectively. The change in calculated CCN concenconcen-tration due to the observed range of solubility reported by Hudson was a factor of 1.4 (2.4) at S=0.44% (0.22%).
20
To compare the magnitude of the change in CCN concentration due to the observed variability in size versus composition, one of these parameters was held constant and the change in CCN concentration due to the other parameter was determined (Table 3). For example, for the TexAQS box at 0.44% S, for a constant HOAMF of 0.2 (0.6), a change in Dgn from 50 to 100 nm results in a factor of 1.9 (3.1) increase in CCN 25
concentration. Alternatively, at the same supersaturation, for a constantDgnof 50 (100) nm a change in HOAMF from 0.2 to 0.6 results in a decrease in CCN concentration by a factor of 1.8 (1.1). A similar calculation for the Dusek et al. box (60% RH) reveals a change in CCN concentration of about a factor of 1.1 to 1.2 due to both size and
ACPD
7, 14171–14208, 2007Chemistry and cloud nucleating properties of aerosols P. K. Quinn et al. Title Page Abstract Introduction Conclusions References Tables Figures ◭ ◮ ◭ ◮ Back Close
Full Screen / Esc
Printer-friendly Version Interactive Discussion
EGU
composition.
At S=0.22%, the impact of the TexAQS range of Dgnon CCN concentration is more
dramatic. A constant HOAMF of 0.2 (0.6) and a change in Dgn from 50 to 100 nm
results in a factor of 5.7 (12) increase in calculated CCN concentration. At a constant
Dgn of 50 (100) nm, a change in HOAMF from 0.2 to 0.6 results in a decrease in CCN 5
concentration by a factor of 2.8 (1.4). For the Dusek et al. box, the maximum change in calculated CCN concentration due to composition is 1.7 and due to size is 1.8. The range in solubility reported by Hudson results in a factor of 2.5 change in calculated CCN concentration at this supersaturation.
Plots of the percent error in calculated CCN concentration due to neglecting the
10
HOAMF also reveal a complex dependence on size, composition, and supersaturation (Fig. 6). At S=0.22%, errors in excess of 80% occur at an HOAMF of 0.4 for the
small-est particles and at an HOAMF of 0.9 for the largest particles considered. The range of HOAMF and mean diameters over which such large errors occur decreases with increasing supersaturation. For the variability observed during TexAQS, the
overesti-15
mation of CCN concentrations ranges from 7.8 to 75% at S=0.22% and from 0.1 to 17% at S=1.0% (Table 4). For the Dusek et al. box at 60% RH, the error ranges from 17 to 61% at 0.22% S and 0.1 to 2.3% at 1.0% S. For the Hudson line at 60% RH, the error ranges from 21 to 68% at S=0.22% and is less than 6% at S=1.0%. For the vari-ability in composition observed during each of the experiments considered here, the
20
change in CCN concentration and percent error due to neglecting the insoluble fraction of the aerosol is significant for S=0.44% and lower.
3.4 Calculated CCN concentrations as function of aerosol history
More detailed data from TexAQS is shown superimposed on the percent error image plots in Fig. 7. Here, average HOAMF values are plotted versusDgn for the different 25
geographical sampling locations and for the three wind-radon regimes. The lowest HOAMF and largest sub-200 nm mean diameters correspond to the Atlantic Marine and Gulf of Mexico sampling locations as well as the Gulf-Southerly Flow wind-radon
ACPD
7, 14171–14208, 2007Chemistry and cloud nucleating properties of aerosols P. K. Quinn et al. Title Page Abstract Introduction Conclusions References Tables Figures ◭ ◮ ◭ ◮ Back Close
Full Screen / Esc
Printer-friendly Version Interactive Discussion
EGU
regime. Aerosol in each of these cases was sampled away from continental anthro-pogenic sources and had a sub-200 nm composition dominated by sulfate and/or OOA. At S=0.22%, the error in calculated CCN concentrations due to neglecting the insol-uble HOAMF was 30% or less for the Gulf of Mexico and 50% or less for the Atlantic Marine and the Gulf-Southerly Flow regime.
5
By comparison, the error is considerably larger for sampling locations next to conti-nental anthropogenic sources (Barbours Cut, Galveston Bay, Houston Ship Channel). In addition, it is larger for the Inland-Southerly Flow regime, where the aerosol was a result of local industrial and urban sources and background Gulf of Mexico aerosol, and for the Northerly Flow regime which was impacted by both near and distant
anthro-10
pogenic sources. The highest HOAMF were observed at Barbours Cut and during the Inland-Southerly Flow regime for mean diameters less than 60 nm. Corresponding er-rors in predicted CCN concentrations were around 90% at S=0.22%. For larger mean diameters (between 70 and 120 nm), the HOAMF was still sufficiently large to result in an overprediction of CCN concentration by 30 to 40%.
15
4 Conclusions
The mass fraction of HOA in the Dvaero<200 nm size range was used to represent
the observed variability in chemical composition during TexAQS and to assess the sensitivity of CCN activation to composition. For TexAQS sampling locations impacted by urban, industrial, and marine vessel emissions, HOA dominated the mass in the
sub-20
200 nm size range. HOA, which has a mass spectrum similar to that of diesel exhaust, lubricating oil, and freshly emitted traffic particulates is assumed to be hydrophobic. A regression of the sub-200 nm HOAMF versus critical diameter for all measurements made at 0.44% S resulted in anr2value of 0.4 indicating that HOA could explain 40% of the variance inDc. The slope andr2values of this regression were largest at small
25
values of S and decreased with increasing S confirming that composition becomes less critical to activation as S increases.
ACPD
7, 14171–14208, 2007Chemistry and cloud nucleating properties of aerosols P. K. Quinn et al. Title Page Abstract Introduction Conclusions References Tables Figures ◭ ◮ ◭ ◮ Back Close
Full Screen / Esc
Printer-friendly Version Interactive Discussion
EGU
Model calculations, which assumed that HOA was completely insoluble, were per-formed to determine the error in the calculated CCN concentration if the HOAMF were
neglected. It was found that for the variability in HOAMF and Dgn observed during TexAQS, CCN concentrations were overestimated by 7.8 to 75% at 0.22% S and 0.1 to 17% at 1.0% S. Errors in the CCN concentration were similar for the variability
ob-5
served by Hudson (2007) (21 to 68% at S=0.22%) and slightly lower for the variability observed by Dusek et al. (2006) (17 to 61% at S=22%). For the TexAQS data set, errors were largest for aerosol sampled from inland locations at close proximity to an-thropogenic sources due to higher HOAMFbut still considerable for aerosol sampled further offshore in the Gulf of Mexico.
10
The calculations presented here did not include other chemical effects of the HOA on CCN activation (e.g., surface tension) due to a lack of information about the chemical properties of the HOA. They were able, however, to indicate the importance of con-sidering the unique composition of the sub-200 nm size range which is the size range where chemical effects are most pronounced in CCN activation and where the majority
15
of the observed HOA is found. In addition, the unique combination of measurements and model calculations presented here served to relate errors in CCN calculations to observed variability in aerosol composition and size. Further measurements of the chemical composition in this size range are required to refine to calculations performed here.
20
Acknowledgements. This work was supported by the NOAA Climate Program Office, the NOAA Health of the Atmosphere Program, and the Texas Air Quality Study. We thank D. Hamilton, J. Johnson, K. Schulz, C. Hoyle and the officers and crew of the Ronald H. Brown for logistical, technical, and scientific support. This is PMEL contribution number 3136.
References
25
Abdul-Razzak, H. and Ghan, S. J.: A parameterization of aerosol activation 3. Sectional repre-sentation, J. Geophys. Res., 107(D3), 4026, doi:10.1029/2001JD000483, 2002.
ACPD
7, 14171–14208, 2007Chemistry and cloud nucleating properties of aerosols P. K. Quinn et al. Title Page Abstract Introduction Conclusions References Tables Figures ◭ ◮ ◭ ◮ Back Close
Full Screen / Esc
Printer-friendly Version Interactive Discussion
EGU Alfarra, M. R., Coe, H., Allan, J. D., Bower, K. N., Boudries, H., Canagaratna, M. R., Jimenez,
J. L., Jayne, J. T., Garforth, A. A., Li, S. M., and Wornsnop, D. R.: Characterization of urban and rural organic particulate matter in the lower Fraser valley using two Aerodyne mass spectrometers, Atmos. Environ., 38, 5745–5758, 2004.
Allan, J. D., Alfarra, M. R., Bower, K. N., Williams, P. I., Gallagher, M. W., Jimenez, J. L.,
5
McDonald, A. G., Nemitz, E., Canagaratna, M. R., Jayne, J. T., Coe, H., and Worsnop, D. R.: Quantitative sampling using an Aerodyne aerosol mass spectrometer. Part 2: Measure-ments of fine particulate chemical composition in two UK cities, J. Geophys. Res., 108, 4091, doi:410.1029/2002JD002359, 2003.
Bates, T. S., Coffman, D. J., Covert, D. S., and Quinn, P. K.: Regional marine boundary layer
10
aerosol size distributions in the Indian, Atlantic and Pacific Oceans: A comparison of IN-DOEX measurements with ACE-1, ACE-2, and Aerosols99, J. Geophys. Res., 107(D19), 8026, doi:10.1029/2001JD001174, 2002.
Bates, T. S., Quinn, P. K., Coffman, D. J., et al.: Marine boundary layer dust and pollutant transport associated with the passage of a frontal system over eastern Asia, J. Geophys.
15
Res., 109, D19S19, doi:10.1029/2003JD004094, 2004.
Berner, A., Lurzer, C., Pohl, F., Preining, O., and Wagner, P.: The size distribution of the urban aerosol in Vienna, Sci. Total Environ., 13, 245–261, 1979.
Boudries, H., Canagaratna, M. R., Jayne, J. T., Alfarra, M. R., Allan, J., Bower, K. N., Coe, H., Pryor, S. C., Jimenez, J. L., Brook, J. R., Li, S., and Worsnop, D. R.: Chemical and physical
20
processes controlling the distribution of aerosols in the Lower Fraser Valley, Canada during the PACIFIC 2001 field campaign, Atmos. Environ., 38, 5759–5774, 2004.
Canagaratna, M. R., Jayne, J. T., Ghertner, D. A., Herndon, S., Shi, Q., Jimenez, J. L., Silva, P. J., Williams, P., Lanni, T., Drewnick, F., Demerjian, K. L., Kolb, C. E., and Worsnop, D. R.: Chase studies of particulate emissions from in-use New York city vehicles, Aer. Sci. Tech.,
25
38, 555–573, 2004.
Canagaratna, M. R., Jayne, J. T., Jimenez, J. L., et al.: Chemical and microphysical characteri-zation of ambient aerosols with the Aerodyne Aerosol Mass Spectrometer, Mass Spectrom-etry Reviews, 26, 185–222, 2007.
Corrigan, C. E. and Novakov, T.: Cloud condensation nucleus activity of organic compounds: a
30
laboratory study, Atmos. Environ., 33, 2661–2668, 1999.
Cubison, M., Alfarra, M. R., Allan, J., Bower, K. N., Coe, H., McFiggans, G. B., Whitehead, J. D., Williams, P. I., Zhang, Q., Jimenez, J. L., Hopkins, J., and Lee, J.: The characterization of
ACPD
7, 14171–14208, 2007Chemistry and cloud nucleating properties of aerosols P. K. Quinn et al. Title Page Abstract Introduction Conclusions References Tables Figures ◭ ◮ ◭ ◮ Back Close
Full Screen / Esc
Printer-friendly Version Interactive Discussion
EGU pollution aerosol in a changing photochemical environment, Atmos. Chem. Phys., 6, 5573–
5588, 2006,
http://www.atmos-chem-phys.net/6/5573/2006/.
Drewnick, F., Schwab, J. J., Jayne, J. T., Canagaratna, M., Worsnop, D. R., and Demergian, K. L.: Measurement of ambient aerosol composition during the PMTACS-NY 2001 using an
5
Aerosol Mass Spectrometer, Part II: Chemically speciated mass distributions, Aer. Sci. Tech., 38, 104–117, 2004.
Dusek, U., Frank, G. P., Hildebrandt, L., et al.: Size matters more than chemistry for cloud-nucleating ability of aerosol particles, Science, 312, 1375–1376, 2006.
Ervens, B., Feingold, G., and Kreidenweis, S. M.: The influence of water-soluble
or-10
ganic carbon on cloud drop number concentration, J. Geophys. Res., 110, 18211, doi:10.1029/2004JD005634, 2005.
Feingold, G.: Modeling of the first indirect effect: Analysis of measurement requirements, Geo-phys. Res. Lett., 30, 1997, doi:10.1029/2003GL017967, 2003.
Fitzgerald, J. W. and Hoppel, W. A.: Equilibrium size of atmospheric aerosol particles as a
15
function of relative humidity: Calculations based on measured aerosol properties, in: Hygro-scopic Aerosols, edited by: Ruhnke, L. H. and Deepak, A., 21–34, A. Deepak, Hampton, VA, 1984.
Fountoukis, C. and Nenes, A.: Continued development of a cloud droplet formation parameteri-zation for global climate models, J. Geophys. Res., 110, 11212, doi:10.1029/2003JD004324,
20
2005.
Hudson, J.: Variability of the relationship between particle size and cloud-nucleating ability, Geophys. Res. Lett., 34, L08801, doi:10.1029/2006GL028850, 2007.
Huffman, J. A., Jayne, J. T., Drewnick, F., Aiken, A. C., Onasch, T., Worsnop, D. R., and Jimenez, J. L.: Design, Modeling, Optimization, and Experimental Tests of a Particle Beam
25
Width Probe for the Aerodyne Aerosol Mass Spectrometer, Aerosol Sci. Technol., 39, 1143– 1163, 2005.
IPCC (Intergovernmental Panel on Climate Change), 2001: Radiative forcing of climate change, in Climate Change 2001, Cambridge Univ. Press, New York, Cambridge University Press, 2001.
30
IPCC (Intergovernmental Panel on Climate Change), Changes in Atmospheric Constituents and in Radiative Forcing, in The IPCC 4th Assessment Report, 2007.
continu-ACPD
7, 14171–14208, 2007Chemistry and cloud nucleating properties of aerosols P. K. Quinn et al. Title Page Abstract Introduction Conclusions References Tables Figures ◭ ◮ ◭ ◮ Back Close
Full Screen / Esc
Printer-friendly Version Interactive Discussion
EGU ous flow CCN counter, Aer. Sci. Tech., 40, 242–254, 2006.
Maßling, A., Wiedensohler, A., Busch, B., Neusuß, C., Quinn, P., Bates, T., and Covert, D.: Hygroscopic properties of different aerosol types over the Atlantic and Indian Oceans, Atmos. Chem. Phys., 3, 1377–1397, 2003,
http://www.atmos-chem-phys.net/3/1377/2003/.
5
McFiggans, G., Artaxo, P., Baltensperger, U., et al.: The effect of physical and chemical aerosol properties on warm cloud droplet activation, Atmos. Chem. Phys., 6, 2593–2649, 2006,
http://www.atmos-chem-phys.net/6/2593/2006/.
Mircea, M., Facchini, M. C., Decesari, S., Fuzzi, S., and Charlson, R. J.: The influence of the organic aerosol component on CCN supersaturation spectra for different aerosol types,
10
Tellus B, 54, 74–81, 2002.
Nenes, A., Charlson, R. J., Facchini, M. C., Kulmala, M., Laaksonen, A., and Seinfeld, J. H.: Can chemical effects on cloud droplet number rival the first indirect effect?, Geophys. Res. Lett., 29, 1848, doi:10.1029/2002GL015295, 2002.
Petzold, A., Gysel, M., Vancassel, X., et al.: On the effects of organic matter and
sulfur-15
containing compounds on the CCN activation of combustion particles, Atmos. Chem. Phys., 5, 3187–3203, 2005,
http://www.atmos-chem-phys.net/5/3187/2005/.
Quinn, P. K., Coffman, D. J., Bates, T. S., Miller, T. L., Johnson, J. E., Welton, E. J., Neus ¨uss, C., Miller, M., and Sheridan, P.: Aerosol optical properties during INDOEX
20
1999: Means, variabilities, and controlling factors, J. Geophys. Res., 107(D19), 8020, doi:10.1029/2000JD000037, 2002.
Roberts, G. C. and Nenes, A.: A continuous-flow streamwise thermal gradient CCN chamber for atmospheric measurements, Aer. Sci. Tech., 39, 206–221, 2005.
Rogers, R. R. and Yau, M. K.: A Short Course in Cloud Physics, Elsevier, New Yori, 1989.
25
Saxena, P., Hildemann, L. M., McMurry, P. H., and Seinfeld, J. H.: Organics alter hygroscopic behavior of atmospheric particles, J. Geophys. Res., 100, 18 755–18 770, 1995.
Schneider, J., Hock, N., Weimer, S., Borrmann, S., Kirchner, R., Vogt, R., and Scheer, V.: Nucleation particles in diesel exhaust: Composition inferred from in situ mass spectrometric analysis, Env. Sci. Tech., 39, 6153–6161, 2005.
30
Shantz, N. C., Leaitch, W. R., and Caffrey, P. F.: Effect of organics of low solubility on the growth rate of cloud droplets, J. Geophys. Res., 108, 4168, doi:10.1029/2002JD002540, 2003. Stratman, F. and Wiedensohler, A.: A new data inversion algorithm for DMPS measurements,
ACPD
7, 14171–14208, 2007Chemistry and cloud nucleating properties of aerosols P. K. Quinn et al. Title Page Abstract Introduction Conclusions References Tables Figures ◭ ◮ ◭ ◮ Back Close
Full Screen / Esc
Printer-friendly Version Interactive Discussion
EGU J. Aerosol Sci., 27, 339–340, 1997.
Twomey, S.: The influence of pollution on the shortwave albedo of clouds, J. Atmos. Sci., 34, 1149–1152, 1977.
Whittlestone, S. and Zahorowski, W.: Baseline radon detectors for shipboard use: Development and deployment in the First Aerosol Characterization Experiment (ACE 1), J. Geophys. Res.,
5
103, 16 743–16 751, 1998.
Zhang, Q., Alfarra, M. R., Worsnop, D. R., Allan, J. D., Coe, H., Canagaratna, M. R., and Jimenez, J. L.: Deconvolution and quantification of hydrocarbon-like and oxygenated or-ganic aerosols based on aerosol mass spectrometry, Environ. Sci. Tech., 39, 4938–4952, doi:10.1021/es0485681, 2005a.
10
Zhang, Q., Worsnop, D. R., Canagaratna, M. R., Jayne, J. T., and Jimenez, J. L.: Hydrocarbon-like and oxygenated organic aerosols in Pittsburgh: Insights into sources and processes of organic aerosols, Atmos. Chem. Phys., 5, 3289–3311, 2005b.
ACPD
7, 14171–14208, 2007Chemistry and cloud nucleating properties of aerosols P. K. Quinn et al. Title Page Abstract Introduction Conclusions References Tables Figures ◭ ◮ ◭ ◮ Back Close
Full Screen / Esc
Printer-friendly Version Interactive Discussion
EGU
Table 1. Coefficients of Linear Regression for HOA Mass Fraction (Dvaero<200 nm) vs. Critical
Diameter at 5 Supersaturations.
% Supersaturation Slope y-intercept r2
0.22 57 96 0.5
0.44 43 75 0.4
0.65 32 64 0.25
0.84 28 62 0.19
ACPD
7, 14171–14208, 2007Chemistry and cloud nucleating properties of aerosols P. K. Quinn et al. Title Page Abstract Introduction Conclusions References Tables Figures ◭ ◮ ◭ ◮ Back Close
Full Screen / Esc
Printer-friendly Version Interactive Discussion
EGU
Table 2. CCN Activation Factor from the Factor Analysis. Variables with the largest factor
loadings (negative and positive) are highlighted.
Variable Factor 2
Subum NH4 mass concentration 0.07 Submicron AMS mass concentration −0.01 Submicron OOA mass concentration 0.00 Subum SO4 mass concentration −0.18 Subum POM mass concentration 0.06
Sub-200 nm SO4 mass fraction −0.87 Sub-200 nm POM mass fraction 0.85 Sub-200 nm HOA mass fraction 0.76 Critical diameter 0.69
Subum POM mass fraction 0.25 Subum SO4 mass fraction −0.38 Subum OOA mass fraction 0.01
Subum NH4 mas fraction 0.31
Sub-200 nm HOA mass concentration 0.13 Sub-200 nm POM mass concentration 0.01 Subum HOA mass fraction 0.34 Subum HOA mass concentration 0.11 Sub-200 nm OOA mass fraction −0.02 Sub-200 nm SO4 mass concentration −0.45
Dgn −0.21
ACPD
7, 14171–14208, 2007Chemistry and cloud nucleating properties of aerosols P. K. Quinn et al. Title Page Abstract Introduction Conclusions References Tables Figures ◭ ◮ ◭ ◮ Back Close
Full Screen / Esc
Printer-friendly Version Interactive Discussion
EGU
Table 3. Calculated CCN Concentrations at 0.22, 0.44, and 1.0% S for the Variability inDgn and HOAMF Observed in TexAQS, Dusek et al. (2006), and Hudson (2007).
S (%) Dgn,1(nm) Dgn,2(nm) HOAMF CCN (cm−3) CCN (cm−3) Dgn,1 Dgn,2 TexAQS 0.22 50a 100a 0.2 a 370 2100 0.6a 130 1500 0.44 50 100 0.20.6 1500830 29002600 1.0 50 100 0.20.6 27002300 30003000 Dusek (dry) 0.22 80b 105b 0.6 c 850 1600 0.8c 380 960 0.44 80 105 0.60.8 21001500 27002200 1.0 80 105 0.60.8 29002700 30002900 Dusek (∼60%) *calculated 0.22 104 136.5 0.6 1600 2300
using a growth factor of 1.3
0.8 930 1700 0.44 104 136.5 0.60.8 27002200 29002700 1.0 104 136.5 0.60.8 30002900 30003000 Hudson (dry) 0.22 60d – 0.3 d 620 – 0.72d 180 – 0.44 60 – 0.720.3 19001000 –– 1.0 60 – 0.720.3 29002500 –– Hudson (∼60%) *calculated 0.22 78 – 0.3 1300 –
using a growth factor of 1.3
0.72 530 – 0.44 78 – 0.720.3 25001800 ––
1.0 78 – 0.720.3 30003000 ––
aLower and upper limits ofD
gnand HOAMF for PMEL data are based on the standard deviation (1σ) of the mean
values for the entire experiment.
bBased on mean modal diameters shown in Fig. 2 of Dusek et al. (2006).
c Based on POM mass fraction in Table 1 of Dusek et al. (2006) and the assumption that the POM was entirely composed of HOA.