HAL Id: hal-00304172
https://hal.archives-ouvertes.fr/hal-00304172
Submitted on 22 May 2008HAL is a multi-disciplinary open access
archive for the deposit and dissemination of sci-entific research documents, whether they are pub-lished or not. The documents may come from teaching and research institutions in France or abroad, or from public or private research centers.
L’archive ouverte pluridisciplinaire HAL, est destinée au dépôt et à la diffusion de documents scientifiques de niveau recherche, publiés ou non, émanant des établissements d’enseignement et de recherche français ou étrangers, des laboratoires publics ou privés.
Internally mixed soot, sulfates, and organic matter in
aerosol particles from Mexico City
K. Adachi, P. R. Buseck
To cite this version:
K. Adachi, P. R. Buseck. Internally mixed soot, sulfates, and organic matter in aerosol particles from Mexico City. Atmospheric Chemistry and Physics Discussions, European Geosciences Union, 2008, 8 (3), pp.9179-9207. �hal-00304172�
ACPD
8, 9179–9207, 2008Internally mixed soot particles K. Adachi and P. R. Buseck Title Page Abstract Introduction Conclusions References Tables Figures ◭ ◮ ◭ ◮ Back Close
Full Screen / Esc
Printer-friendly Version Interactive Discussion
Atmos. Chem. Phys. Discuss., 8, 9179–9207, 2008 www.atmos-chem-phys-discuss.net/8/9179/2008/ © Author(s) 2008. This work is distributed under the Creative Commons Attribution 3.0 License.
Atmospheric Chemistry and Physics Discussions
Internally mixed soot, sulfates, and
organic matter in aerosol particles from
Mexico City
K. Adachi1,2and P. R. Buseck1,2
1
School of Earth and Space Exploration, Arizona State University, Tempe, AZ, USA
2
Department of Chemistry and Biochemistry, Arizona State University, Tempe, AZ, USA Received: 7 April 2008 – Accepted: 14 April 2008 – Published: 22 May 2008
Correspondence to: P. R. Buseck ([email protected])
ACPD
8, 9179–9207, 2008Internally mixed soot particles K. Adachi and P. R. Buseck Title Page Abstract Introduction Conclusions References Tables Figures ◭ ◮ ◭ ◮ Back Close
Full Screen / Esc
Printer-friendly Version Interactive Discussion
Abstract
Soot particles are major aerosol constituents that result from emissions of burning of fossil fuel and biomass. Because they both absorb sunlight and contribute to cloud formation, they are an influence on climate on local, regional, and global scales. It is therefore important to evaluate their optical and hygroscopic properties and those
5
effects on the radiation budget. Those properties commonly change through reaction with other particles or gases, resulting in complex internal mixtures. Using transmission electron microscopy, we measured ∼8000 particles (25 samples) with aerodynamic di-ameters from 0.05 to 0.3 µm that were collected in March 2006 from aircraft over Mex-ico City (MC) and adjacent areas. More than 50% of the particles consist of internally
10
mixed soot, organic matter, and sulfate. Imaging combined with chemical analysis of individual particles show that many are coated, consist of aggregates, or both. Coat-ings on soot particles can amplify their light absorption, and coagulation with sulfates changes their hygroscopic properties, resulting in shorter lifetime. Our results sug-gest that a mixture of materials from multiple sources such as vehicles, power plants,
15
and biomass burning occurs in individual particles, thereby increasing their complex-ity. Through changes in their optical and hygroscopic properties, internally mixed soot particles have a greater effect on the regional climate than uncoated soot particles. Moreover, soot occurs in more than 60% of all particles in the MC plumes, suggesting its important role in the formation of secondary aerosol particles.
20
1 Introduction
Aerosol particles have important influences on Earth’s radiative and hydrological bal-ance (Ramanathan et al., 2001) and human health (Dockery et al., 1993). Knowledge of their contribution to radiative forcing is inadequate (IPCC, 2007). Our study focuses on internal mixtures of soot (black carbon) particles with organic matter (OM) and
sul-25
ACPD
8, 9179–9207, 2008Internally mixed soot particles K. Adachi and P. R. Buseck Title Page Abstract Introduction Conclusions References Tables Figures ◭ ◮ ◭ ◮ Back Close
Full Screen / Esc
Printer-friendly Version Interactive Discussion
Observations) campaign in and near Mexico City (MC) and their implications for global climate. Many developing megacities, such as MC, are located in tropical areas. Their importance will increase through growing economic activity and populations. Many details of the aerosol particles emitted from tropical megacities are not well known, although they have important effects on the troposphere and people living in it.
5
Soot particles are emitted through incomplete combustion of fossil fuel and biomass carbon. They produce a net warming effect in the atmosphere through absorption of sunlight (Chung and Seinfeld, 2002, 2005; Jacobson 2001; Haywood et al., 1997; Myhre et al., 1998; Penner et al., 1998; Bond and Bergstrom, 2006). Internally mixed soot particles are estimated to be the second most significant component of global
10
warming after CO2 in terms of direct radiative forcing (Jacobson, 2001; Ramanathan and Carmichael, 2008).
Here we focus on particles of soot, OM, and sulfate, with emphasis on internally mixed particles. Climate models assume that aerosol particles are single phases (ex-ternal mixtures), in(ex-ternal mixtures, or both (Jacobson, 2001; Chung and Seinfeld, 2002,
15
2005; Bond et al., 2006; Takemura et al., 2005) The externally mixed assumption is un-realistic in many atmospheric situations as many, and perhaps most, aerosol particles are internally mixed (e.g., Murphy et al., 2006; P ´osfai et al., 1999). Internal mixtures are a better assumption if appropriate morphological and mixing properties are ap-plied to models, although these parameters are commonly not well known. However,
20
such properties affect their optical and hygroscopic properties. Therefore, a detailed analysis of internally mixed particles is appropriate.
We used transmission electron microscopy to analyze the morphologies, sizes, and compositions of individual aerosol particles. The transmission electron microscope (TEM) is a powerful instrument for determining these properties (Buseck and P ´osfai,
25
1999; Buseck and Schwartz, 2003; Niemi et al., 2006; Johnson et al., 2005; Ut-sunomiya et al., 2004). Soot is a common constituent of such mixtures, and the TEM can be used to recognize it based on its distinctive morphological features. Absent its destruction by instruments such as the particle soot absorption photometer (PSAP)
ACPD
8, 9179–9207, 2008Internally mixed soot particles K. Adachi and P. R. Buseck Title Page Abstract Introduction Conclusions References Tables Figures ◭ ◮ ◭ ◮ Back Close
Full Screen / Esc
Printer-friendly Version Interactive Discussion
(Baumgardner et al., 2007), because of the similarity of its chemical properties with OM, it can be difficult to detect by using other instruments. Moreover, several TEM studies have shown that OM with sulfate coatings on soot particles are widespread (e.g., Chen et al., 2006; Kojima et al., 2005; P ´osfai et al., 1999; Li et al., 2003; Okada et al., 2005; Johnson et al., 2005).
5
Our goal is to characterize the chemical and physical properties of internally mixed soot particles in order to understand their hygroscopic properties, optical properties, and coating processes at the individual-particle scale. Using the samples collected from the MC plumes, we also aim to characterize the particles that were emitted from heavily polluted areas, where contributions of aerosol emissions to the regional and
10
global environments are becoming increasingly important.
2 Materials and methods
2.1 Mexico City atmospheric research projects
The MILAGRO campaign was conducted in Mexico during March 2006 (Molina et al., 20081). The goal was to understand the evolution of trace gases and particles from
15
anthropogenic emissions in and around MC, as an example of a tropical megacity. Detailed meteorological conditions during the campaign are discussed in de Foy et al. (2008) and Fast et al. (2007). The prior MCMA-2003 (Mexico City Metropolitan Area field campaign 2003) also revealed important insights into the meteorology, pri-mary pollutant emissions, ambient secondary pollutant precursor concentrations,
pho-20
tochemical oxidant production, and secondary aerosol particle formation in MC (Molina et al., 2007).
1
Molina, L. T., Madronich, S., Gaffney J., et al.: An overview of the MILAGRO 2006 Cam-paign: Mexico City emissions and its transport and transformation, Atmos. Chem. Phys. Dis-cuss., in preparation, 2008.
ACPD
8, 9179–9207, 2008Internally mixed soot particles K. Adachi and P. R. Buseck Title Page Abstract Introduction Conclusions References Tables Figures ◭ ◮ ◭ ◮ Back Close
Full Screen / Esc
Printer-friendly Version Interactive Discussion
2.2 Sampling
Samples were collected using 3-stage impactor samplers (MPS-3, California Measure-ments, Inc.). Units were placed in both the NCAR/NSF C130 and the U.S. Forest Service Twin Otter (Yokelson et al., 2007) aircraft. Both contained isokinetic particle inlets with cutoff diameters of a few µm (Jonsson et al., 1995). The 50% cut-off
aero-5
dynamic diameters of the samplers are 2.0, 0.3, and 0.05 µm. In this study, we used the smallest impactor stage (0.05 to 0.3 µm). Sampling times were mostly between 4 and 6 min, although they ranged from 3 to 17 min (Table 1) depending on the particle concentrations.
SEM stubs, each having one TEM grid attached, were placed in each stage of the
10
samplers. Lacy carbon grids were used for TEM sample collections. Such grids, which have “spider net” carbon substrates, are designed to be used for chemical analyses and high-resolution imaging (e.g., Figs. 1 and 2). The substrate causes minimal overlap with samples and yields clear images where the particles extend over holes in the substrates (P ´osfai et al., 2003).
15
We acquired 30 samples from the C130 during 10 research flights and 182 samples from the Twin Otter during 12 research flights. Some samples are primarily from the MC plumes and others from biomass burning. In this study we focus on the samples from the MC urban plumes and adjacent areas near MC (Table 1).
Samples were collected from a wide range of locations and weather conditions. We
20
classified the samples as from either within the MC plume (MC sample, 8 samples) or outside of it (17 samples) using the HYSPLIT back-trajectory model of Draxler and Rolph (2003). Except for #14, all MC samples are from within 80 km of the city center (Table 1).
Most MC samples were collected around 02:00 p.m. local time (Table 1), suggesting
25
that most particles were within eight hours or less from emission. These samples include particles that were emitted during the morning rush hour and transported by local and regional air circulation (Fast et al., 2007). On the other hand, it is likely that
ACPD
8, 9179–9207, 2008Internally mixed soot particles K. Adachi and P. R. Buseck Title Page Abstract Introduction Conclusions References Tables Figures ◭ ◮ ◭ ◮ Back Close
Full Screen / Esc
Printer-friendly Version Interactive Discussion
samples from outside MC are older than the MC samples, as most do not have definite sources within 1- to 2-day back-trajectories.
2.3 TEM analysis
We used a Tecnai F20 TEM for imaging and electron energy-loss spectroscopy (EELS) analyses and a CM 200 TEM (both from the FEI Corp.) for energy-dispersive X-ray
5
spectrometer (EDS) analyses. Both TEMs were operated at an accelerating voltage of 200 kV.
The EDS analyses were used to measure compositions of particles ranging from nanometers to micrometers in diameter. By using expanded electron beams that in-cluded entire particles (∼1 µm), averaged compositions of individual particles were
10
determined. We measured all particles in a certain area of a TEM image (∼2000 to 5000 magnification) for the analyses. Each area had between 20 and 60 particles. We chose one or two areas from each of 12 samples and analyzed 379 particles in total (Table 1). Thirty-second collection times were used.
2.4 Soot particles, organic matter (OM), and sulfates
15
Soot particles from MC typically consist of aggregated carbon spheres ranging in di-ameter from 20 to 100 nanometers, with median about 44 nm. They contain poorly ordered, curved graphitic layers separated by ∼0.36 nm (Fig. 1b) and display a sharp
π* peak in EELS analyses. Soot particles can be recognized by their graphitic
struc-ture in TEM images even where they are internally mixed with OM, which is typically
20
amorphous. The structural difference causes contrast in TEM images. However, if the grains are too thick (∼1 µm), it can be difficult to identify the soot particles. Therefore, although such thick grains are not common in our samples, some internally mixed soot particles could be underestimated. In MC, soot particles mainly come from vehicles, but some come from biomass burning (Moffet et al., 2007; Jiang et al., 2005).
25
ACPD
8, 9179–9207, 2008Internally mixed soot particles K. Adachi and P. R. Buseck Title Page Abstract Introduction Conclusions References Tables Figures ◭ ◮ ◭ ◮ Back Close
Full Screen / Esc
Printer-friendly Version Interactive Discussion
(Figs. 1, 2, and 3). In MC, about half the organic carbon comes from motor vehicles, and from 5 to 26% of organic carbon is from biomass burning (Stone et al., 2008). Except for tar balls, which are spherical (P ´osfai et al., 2004; Hand et al., 2005), OM lacks a distinctive morphology. OM particles are less sensitive to the electron beam than sulfates, although they shrink slightly after strong radiation.
5
Sulfates readily decompose when exposed to an electron beam. Many are coated with OM and, when decomposing, they leave a carbonaceous residue (Figs. 1c,d,f) (P ´osfai et al., 2003). We used Ca-coated TEM grids to detect H2SO4 and (NH4)2SO4 using the same method as Kojima et al. (2006), Yamato and Ono (1989), and Yamato and Tanaka (1994). Most droplets did not react with the Ca coatings, which we
inter-10
pret as indicating our sulfates were neutralized by ammonium. Such neutralization is consistent with the results of DeCarlo et al. (2007) and Moya et al. (2003). The sul-fate comes from regional sources such as petrochemical, power plant, and volcanic emissions (Johnson et al., 2006; de Foy et al., 2007; DeCarlo et al., 2007).
2.5 Particle classification
15
For purposes of this study, we classified particles into categories based on their mor-phological features described above: 1) internally mixed soot particles (soot with coat-ings of OM, sulfates, or both; hereafter, we will refer to mixtures of OM and sulfate as OM-S); 2) soot particles without coatings (externally mixed soot); 3) OM-S without soot; 4) tar balls; and 5) others. Category 1 includes soot particles that were attached to or
20
partly coated by OM-S (soot size>OM-S size), which constitute ∼20% of this category, and particles that have both soot and mineral or metal particles with OM-S coatings. If no coatings were recognized in the TEM images, the soot particles were included in category 2. All other particles were classified as category 5 and were mostly mineral dust and metal particles, all of which are crystalline and resist decomposition in the
25
ACPD
8, 9179–9207, 2008Internally mixed soot particles K. Adachi and P. R. Buseck Title Page Abstract Introduction Conclusions References Tables Figures ◭ ◮ ◭ ◮ Back Close
Full Screen / Esc
Printer-friendly Version Interactive Discussion
2.6 Particle selection
For particle measurements, we selected a single grid square (125×125 µm) from a TEM grid of each sample, using the same method as Kojima et al. (2004). Between 100 and 300 TEM images were recorded for each sample. All particles with diameters greater than 50 nm in those TEM images, typically between 300 and 600 particles
5
per sample, were sized and categorized. A total of more than 7700 particles from 22 samples were used for size measurements and particle categorization (Table 1). The procedure produces uncertainties of less than 10% relative in the pie chart (Fig. 5). 2.7 Particle size measurements
Averaged particle radii were determined by fitting ellipses to the particle outlines and
10
taking the geometric mean of the semi-minor and semi-major axes. If more than two soot-particle aggregates occur in an internal mixture, only the larger one was mea-sured. The rationale was that these larger soot particles have the greatest effect on the particle optical properties.
Many particles containing OM-S were apparently liquid or at least relatively viscous
15
when collected. In these instances, they spread when on the grid (Figs. 1 and 2). We used lacy-carbon support films to minimize the effect. In some cases, they may have decreased in size because of loss of volatile fractions. Vacuum condition causes ∼20% of shrinkage for ammonium sulfate particles (P ´osfai et al., 1998). We used the same procedure for all samples, and therefore the comparison among our samples is
20
ACPD
8, 9179–9207, 2008Internally mixed soot particles K. Adachi and P. R. Buseck Title Page Abstract Introduction Conclusions References Tables Figures ◭ ◮ ◭ ◮ Back Close
Full Screen / Esc
Printer-friendly Version Interactive Discussion
3 Results
3.1 Nature of aerosol particles
We found that many MC particles are internally mixed. This observation is consistent with the results from single-particle mass spectrometer measurements (Moffet et al., 2007) and scanning and transmission electron microscopy (Doran et al., 2008;
John-5
son et al., 2005), all of which were used to analyze MC samples. Images of many MC particles show the intimate mixtures of constituent phases. Typical images and com-positions of both internally and externally mixed particles are shown in Figs. 1 and 2, respectively.
EDS measurements show that S occurs in more than 90% of all analyzed particles,
10
and more than 70% of these also contain K. Si occurs in 75% of the particles, although discrete mineral grains were not evident. Small peaks in the EDS spectra showed one or more of V, Cr, Mn, Ni, Zn, Sn, Pb, and Bi in 50% of the particles. Other studies also reported metals in MC aerosol particles (e.g., Moffet et al., 2007; Chow et al., 2002; Johnson et al., 2006; Querol et al., 2008).
15
In order to explore details of the sorts of particles typical of the MC plume, we ob-tained EELS analyses across a traverse of one such composite particle (Fig. 3). A plot of S, O, N, and K composition vs. position shows a sulfate decomposition residue (e.g., Point 4 in Fig. 3). The high π*/σ* ratios at, e.g., point 1, confirm the identity of soot. The low π*/σ* ratios at points 2 and 5 and the lack of a well-defined shape are consistent
20
with the identity of OM.
3.2 Sizes and aspect ratios of aerosol particles
The size distributions of MC samples are similar to those collected outside of MC (Fig. 4). However, the peak of the distribution for internally mixed OM-S coatings from the MC samples is smaller than that from particles collected outside of MC. Where
25
ACPD
8, 9179–9207, 2008Internally mixed soot particles K. Adachi and P. R. Buseck Title Page Abstract Introduction Conclusions References Tables Figures ◭ ◮ ◭ ◮ Back Close
Full Screen / Esc
Printer-friendly Version Interactive Discussion
The aspect ratio (long axis/short axis) is an indicator of compactness. Averaged as-pect ratios (and standard deviations) are 2.2 (0.9), 2.1 (0.9), and 1.9 (0.8) for uncoated soot and that with coatings from MC and outside of MC, respectively. Although particles become more compact during aging, those in our samples are not highly compacted but retain their chain-like structure.
5
3.3 Volumes and number fractions of aerosol particles
The volumes of particles are important for evaluating their optical properties and aging. Most particles have irregular shapes on TEM grids, but many were presumably liquid within the atmosphere. For simplification, we approximated their shapes as roughly elliptical when on the TEM grid. We used their measured semi-major and semi-minor
10
axes to calculate their volumes. The volumes, V , of the soot particles within the in-ternally mixed particles were determined using the relation V =4/3×π×a3×N, where a is the radius and N is the number of monomers. N was estimated from the
sta-tistical scaling law of fractal aggregates, N=ka×(Rg/a)Df, where ka is the structural coefficient, Rg is the radius of gyration, and Df is the fractal dimension (Adachi et
15
al., 2007). We used the measured semi-major axes of soot particles for determina-tion of Rg (Rg=semi-major axis/1.5) (Brasil et al., 2001; K ¨oyl ¨u et al., 1995; Gwaze et al., 2006). For simplification, we divided the soot particles into their extreme val-ues of either open or compact. For soot particles that have aspect ratios >2.0 (open clusters), we used Df=2.4 and ka=0.7 (Adachi et al., 2007). For the compacted soot
20
particles (aspect ratios ≤2.0), we used Df=2.6 and ka=2.1 (Adachi et al., 2007; Liu and Mishchenko, 2005).
Approximately 80% and 50% by volume of the OM-S particles collected from MC and outside of MC, respectively, contained soot particles. The median value of soot volume fractions for internally mixed particles was 15% when the median monomer
25
radius 22 nm was used and ranged from 10 to 22% for the range of our a (from 10 to 50 nm).
ACPD
8, 9179–9207, 2008Internally mixed soot particles K. Adachi and P. R. Buseck Title Page Abstract Introduction Conclusions References Tables Figures ◭ ◮ ◭ ◮ Back Close
Full Screen / Esc
Printer-friendly Version Interactive Discussion
particles dominated the MC samples (Fig. 5). Soot occurs in 62 and 35% of all particles in the samples from MC and outside MC, respectively, and more than 80% of them were coated by OM-S in both sample sets.
4 Discussion
4.1 OM-S coatings on soot particles
5
Most MC soot is embedded in or coated by OM-S. The proportion of internally mixed soot is higher than that reported by Okada et al. (2005) for Australia, Hara et al. (2003) for the Arctic, and Hasegawa and Ohta (2002) for Japan and Alaska, even though most of our MC samples were less aged. Since our MC samples were collected close to their sources, generally within less than eight hours after emission and yet were coated
10
when collected, we conclude that the rate of coating was rapid, consistent with the results of Doran et al. (2007), Johnson et al. (2005), and Baumgardner et al. (2007). The rate is much faster than that used in climate models. For example, Cooke et al. (1999) suggested that an exponential lifetime of hydrophobic soot is 1.15 days. Coated soot particles are removed by wet deposition and have shorter lifetimes, which
15
reduces their radiative forcing (van Poppel et al., 2005).
The coated soot particles retained their chain-like structure even though their aspect ratios showed that they were compacted slightly during aging (Abel et al., 2003). A possible explanation is that rapidly deposited coatings covered the entire soot particle and fixed its structure before it became completely compacted.
20
Light absorption of soot is enhanced when it is coated by OM-S. In our samples, the median coating fraction is 85% by volume in internally mixed particles. Such coat-ings focus sunlight on the soot and also enlarge the available absorption cross section (Fuller et al., 1999; Ch´ylek et al., 1995; Bond et al., 2006; Barnard et al., 2007). By us-ing Mie theory, calculations show that a spherical soot core surrounded by a concentric
25
ACPD
8, 9179–9207, 2008Internally mixed soot particles K. Adachi and P. R. Buseck Title Page Abstract Introduction Conclusions References Tables Figures ◭ ◮ ◭ ◮ Back Close
Full Screen / Esc
Printer-friendly Version Interactive Discussion
et al., 2006). However, such a configuration probably overestimates the light absorp-tion of our soot particles that are not completely compacted because soot monomers located away from the center of the particle have reduced absorption (Fuller et al., 1999; Bond et al., 2006).
In our MC samples, soot particles occur in 62% of OM-S particles, and 80% by
5
volume of all OM-S particles contain soot. These results suggest that soot particles are important seeds for the development and growth of secondary aerosol particles.
4.2 Contributions from biomass burning
Biomass burning is one of the most important sources of aerosol particles in MC (Moffet et al., 2007; Stone et al., 2008; Yokelson et al., 2007). K is a key element for identifying
10
such particles (Andreae 1983; Li et al., 2003; P ´osfai et al., 2003; Hudson et al., 2004; Murphy et al., 2006). In our samples, K occurs in more than 60% of the particles, most of which are sulfates. Sulfate condensation on the biomass-burning particles probably occurred during transport, as was also observed in biomass-burning particles in southern Africa (P ´osfai et al., 2003; Gaudichet et al., 1995; Andreae et al., 1998;
15
Gao et al., 2003; Kreidenweis et al., 2001; Liu et al., 2000).
K concentrations are variable among particles (Figs. 1, 2, 3). Some were presum-ably produced by biomass burning outside of MC. Such burning occurred during the campaign in the central and southern parts of Mexico such as Yucatan and around MC (Yokelson et al., 2007; Fast et al., 2007). Locally, cooking is another source of
20
K-bearing particles (Moffet et al., 2007).
Tar balls are also an indicator of biomass burning (P ´osfai et al., 2004). Their number fractions were smaller than those in other areas that had large contributions of biomass burning such as southern Africa, Hungary (P ´osfai et al., 2004), and Yosemite National Park (Hand et al., 2005). The relatively low biomass-burning contribution is consistent
25
ACPD
8, 9179–9207, 2008Internally mixed soot particles K. Adachi and P. R. Buseck Title Page Abstract Introduction Conclusions References Tables Figures ◭ ◮ ◭ ◮ Back Close
Full Screen / Esc
Printer-friendly Version Interactive Discussion
4.3 Sulfate implications
Sulfate particles are commonly smaller than 200 nm across and are attached to soot, OM, or their mixtures (Fig. 1). Although in areas such as the northern Atlantic Ocean (P ´osfai et al., 1999) and southern Finland (Niemi et al., 2006) sulfates encapsulate entire soot particles, the dominant material in the MC samples is OM, and the
sul-5
fate as well as soot are either embedded within the OM or attached to its edges. The difference arises because the MC plume included large quantities of OM (Salcedo et al., 2006; Jiang et al., 2005; Zavala et al., 2006; Stone et al., 2008; Querol et al., 2008; Takahama et al., 2007; DeCarlo et al., 2007; Molina et al., 2007; Kleinman et al., 2008), which produced coatings on the soot before the sulfate particles developed.
10
The attached sulfates hardly enhance the light absorption of soot (Mishchenko et al., 2004). On the other hand, the sulfates change the OM and soot particles from hy-drophobic to hydrophilic and eventually make them efficient cloud condensation nuclei (CCN) (Lohmann et al., 2004; King et al., 2007). CCN activity influences the formation and properties of clouds, which are important cooling contributors to Earth’s radiative
15
balance (Lohmann and Feichter, 2005).
5 Conclusions
Over 50% of the aerosol particles that we sampled from the MC plume consist of internally mixed soot, OM, and sulfates. MC sulfate commonly contains K, suggesting a contribution from biomass burning. These findings suggest that individual particles
20
typically contain materials from multiple sources. OM is a dominant material in the MC plume, and soot particles are common. As a result, OM rapidly coats most soot particles. Additionally, sulfate commonly attaches to OM and soot particles, changing them from hydrophobic to hydrophilic.
In a city where pollution is heavy and formation of secondary organics is rapid, as is
25
ACPD
8, 9179–9207, 2008Internally mixed soot particles K. Adachi and P. R. Buseck Title Page Abstract Introduction Conclusions References Tables Figures ◭ ◮ ◭ ◮ Back Close
Full Screen / Esc
Printer-friendly Version Interactive Discussion
modeling. Depending on their nature, the coatings can have either negative or positive effects on the radiative forcing. They reduce soot lifetimes in the atmosphere through the changes in particle hygroscopicity and increased mass, which together result in both washout and dry deposition and, on the other hand, they amplify light absorption. Such shorter lifetimes and stronger absorption of coated soot, compared to uncoated
5
ones, suggest that it has significant influences on the radiation budget in the regional area and eventually climate. Since soot is the dominant primary particle in many urban areas, its properties, especially when coated, are important for accurate evaluation of its effects on local and regional climate. Moreover, soot occurs in more than 60% of all particles in the MC plumes, suggesting its important role in the formation of secondary
10
aerosol particles.
Acknowledgements. The authors thank T. Karl, F. Flocke, and S. Madronich for their help with
collection of the C130 samples and R. Yokelson, T. Christian, S. Urbanski, C. Wold, D. Toohey, M. Fisher, E. Thompson, G. Moore, J. Stright, A. Knobloch, and K. Bailey for their help with collection of Twin Otter samples. C. Wilson and J. Cagle helped greatly with the aircraft inlets.
15
We are grateful to E. Freney, L. Garvie, and S. H. Chung for their discussions of this manuscript. We gratefully acknowledge the use of TEMs within the LeRoy Eyring Center for Solid State Science at Arizona State University. This study was supported by NSF grant ATM-0531926.
References
Abel, S. J., Haywood, J. M., Highwood, E. J., Li, J., and Buseck, P. R.: Evolution of biomass
20
burning aerosol properties from an agricultural fire in southern Africa, Geophys. Res. Lett., 30, 1783, doi:10.1029/2003GL017342, 2003.
Adachi, K., Chung, S. H., Friedrich, H., and Buseck, P. R.: Fractal parameters of individual soot particles determined using electron tomography: Implications for optical properties, J. Geophys. Res.-Atmos., 112, D14202, doi:10.1029/2006JD8296, 2007.
25
Andreae, M. O.: Soot carbon and excess fine potassium: long-range transport of combustion-derived aerosols, Science, 220, 1148–1151, 1983.
ACPD
8, 9179–9207, 2008Internally mixed soot particles K. Adachi and P. R. Buseck Title Page Abstract Introduction Conclusions References Tables Figures ◭ ◮ ◭ ◮ Back Close
Full Screen / Esc
Printer-friendly Version Interactive Discussion
Maenhaut, W., Salma, I., Wienhold, F. G., and Zenker, T.: Airborne studies of aerosol emis-sions from savanna fires in southern Africa: 2. Aerosol chemical composition, J. Geophys. Res.-Atmos., 103, 32 119–32 128, 1998.
Barnard, J. C., Kassianov, E. I., Ackerman, T. P., Johnson, K., Zuberi, B., Molina, L. T., and Molina, M. J.: Estimation of a “radiatively correct” black carbon specific absorption during
5
the Mexico City Metropolitan Area (MCMA) 2003 field campaign, Atmos. Chem. Phys., 7, 1645–1655, 2007,http://www.atmos-chem-phys.net/7/1645/2007/.
Baumgardner, D., Kok, G. L., and Raga, G. B.: On the diurnal variability of particle properties related to light absorbing carbon in Mexico City, Atmos. Chem. Phys., 7, 2517–2526, 2007,
http://www.atmos-chem-phys.net/7/2517/2007/.
10
Bond, T. C. and Bergstrom, R. W.: Light absorption by carbonaceous particles: An investigative review, Aerosol Sci. Technol., 40, 27–67, 2006.
Bond, T. C., Habib, G., and Bergstrom, R. W.: Limitations in the enhancement of
visible light absorption due to mixing state, J. Geophys. Res.-Atmos., 111, D20211, doi:10.1029/2006JD007315, 2006.
15
Brasil, A. M., Farias, T. L., Carvalho, M. G., and Koylu, U. O.: Numerical characterization of the morphology of aggregated particles, J. Aerosol Sci., 32, 489–508, 2001.
Buseck, P. R. and P ´osfai, M.: Airborne minerals and related aerosol particles: Effects on climate and the environment, P. Natl. Acad. Sci. USA., 96, 3372–3379, 1999.
Buseck, P. R. and Schwartz, S. E.: Tropospheric aerosols, in: Treatise on Geochemistry, 4,
20
edited by: Turekian, K. K. and Holland, H.D., Elsevier Science Ltd., San Diego, 91–142, 2003.
Chen, Y. Z., Shah, N., Huggins, F. E., and Huffman, G. P.: Microanalysis of ambient particles from Lexington, KY, by electron microscopy, Atmos. Environ., 40, 651–663, 2006.
Chow, J. C., Watson, J. G., Edgerton, S. A., and Vega, E.: Chemical composition of PM2.5and
25
PM10in Mexico City during winter 1997, Sci. Total Environ., 287, 177–201, 2002.
Chung, S. H. and Seinfeld, J. H.: Global distribution and climate forcing of carbonaceous aerosols, J. Geophys. Res.-Atmos., 107, D19, 4407, doi:10.1029/2001JD001397, 2002. Chung, S. H. and Seinfeld, J. H.: Climate response of direct radiative forcing of anthropogenic
black carbon, J. Geophys. Res.-Atmos., 110, D11102, doi:10.1029/2004JD005441, 2005.
30
Ch´ylek, P., Videen, G., Ngo, D., Pinnick, R. G., and Klett, J. D.: Effect of black carbon on the optical properties and climate forcing of sulfate aerosols, J. Geophys. Res.-Atmos., 100, 16 325–16 332, 1995.
ACPD
8, 9179–9207, 2008Internally mixed soot particles K. Adachi and P. R. Buseck Title Page Abstract Introduction Conclusions References Tables Figures ◭ ◮ ◭ ◮ Back Close
Full Screen / Esc
Printer-friendly Version Interactive Discussion
Cooke, W. F., Liousse, C., Cachier, H., and Feichter, J.: Construction of a 1 degrees x 1 degrees fossil fuel emission data set for carbonaceous aerosol and implementation and radiative impact in the ECHAM4 model, J. Geophys. Res.-Atmos., 104, 22 137–22 162, 1999.
de Foy, B., Fast, J. D., Paech, S. J., Phillips, D., Walters, J. T., Coulter, R. L., Martin, T. J., Pekour, M. S., Shaw, W. J., Kastendeuch, P. P., Marley, N. A., Retama, A., and Molina,
5
L. T.: Basin-scale wind transport during the MILAGRO field campaign and comparison to climatology using cluster analysis, Atmos. Chem. Phys., 8, 1209–1224, 2008,
http://www.atmos-chem-phys.net/8/1209/2008/.
de Foy, B., Lei, W., Zavala, M., Volkamer, R., Samuelsson, J., Mellqvist, J., Galle, B., Mart´ınez, A. P., Grutter, M., Retama, A., and Molina, L. T.: Modelling constraints on the emission
10
inventory and on vertical dispersion for CO and SO2 in the Mexico City Metropolitan Area using Solar FTIR and zenith sky UV spectroscopy, Atmos. Chem. Phys., 7, 781–801, 2007,
http://www.atmos-chem-phys.net/7/781/2007/.
DeCarlo, P. F., Dunlea, E. J., Kimmel, J. R., Aiken, A. C., Sueper, D., Crounse, J., Wennberg, P. O., Emmons, L., Shinozuka, Y., Clarke, A., Zhou, J., Tomlinson, J., Collins, D. R., Knapp, D.,
15
Weinheimer, A. J., Montzka, D. D., Campos, T., and Jimenez, J. L.: Fast airborne aerosol size and chemistry measurements with the high resolution aerosol mass spectrometer during the MILAGRO Campaign, Atmos. Chem. Phys. Discuss., 7, 18 269–18 317, 2007.
Dockery, D. W., Pope, C. A., Xu, X. P., Spengler, J. D., Ware, J. H., Fay, M. E., Ferris, B. G., and Speizer, F. E.: An association between air pollution and mortality in 6 United States cities,
20
New Engl. J. Med., 329, 1753–1759, 1993.
Doran, J. C., Barnard, J. C., Arnott, W. P., Cary, R., Coulter, R., Fast, J. D., Kassianov, E. I., Kleinman, L., Laulainen, N. S., Martin, T., Paredes-Miranda, G., Pekour, M. S., Shaw, W. J., Smith, D. F., Springston, S. R., and Yu, X. Y.: The T1-T2 study: evolution of aerosol properties downwind of Mexico City, Atmos. Chem. Phys., 7, 1585–1598, 2007,
25
http://www.atmos-chem-phys.net/7/1585/2007/.
Doran, J. C., Fast, J. D., Barnard, J. C., Laskin, A., Desyaterik, Y., and Gilles, M. K.: Applications of lagrangian dispersion modeling to the analysis of changes in the specific absorption of elemental carbon, Atmos. Chem. Phys., 8, 1377–1389, 2008,
http://www.atmos-chem-phys.net/8/1377/2008/.
30
Draxler, R. R. and Rolph, G. D.: HYSPLIT (HYbrid Single-Particle
La-grangian Integrated Trajectory) Model access via NOAA ARL READY Website (http://www.arl.noaa.gov/ready/hysplit4.html), NOAA Air Resources Laboratory, Silver
ACPD
8, 9179–9207, 2008Internally mixed soot particles K. Adachi and P. R. Buseck Title Page Abstract Introduction Conclusions References Tables Figures ◭ ◮ ◭ ◮ Back Close
Full Screen / Esc
Printer-friendly Version Interactive Discussion
Spring, MD, 2003.
Fast, J. D., de Foy, B., Rosas, F. A., Caetano, E., Carmichael, G., Emmons, L., Mckenna, D., Mena, M., Skamarock, W., Tie, X., Coulter, R. L., Barnard, J. C., Wiedinmyer, C., and Madronich, S.: A meteorological overview of the MILAGRO field campaigns, Atmos. Chem. Phys., 7, 2233–2257, 2007,http://www.atmos-chem-phys.net/7/2233/2007/.
5
Fuller, K. A., Malm, W. C., and Kreidenweis, S. M.: Effects of mixing on extinction by carbona-ceous particles, J. Geophys. Res.-Atmos., 104, 15 941–15 954, 1999.
Gao, S., Hegg, D. A., Hobbs, P. V., Kirchstetter, T. W., Magi, B. I., and Sadilek, M.: Water-soluble organic components in aerosols associated with savanna fires in southern Africa: Identification, evolution, and distribution, J. Geophys. Res.-Atmos., 108, D13, 8491,
10
doi:10.1029/2002JD002324, 2003.
Gaudichet, A., Echalar, F., Chatenet, B., Quisefit, J. P., Malingre, G., Cachier, H., Buatmenard, P., Artaxo, P., and Maenhaut, W.: Trace elements in tropical African savanna biomass burning aerosols, J. Atmos. Chem., 22, 19–39, 1995.
Gwaze, P., Schmid, O., Annegarn, H. J., Andreae, M. O., Huth, J., and Helas, G.: Comparison
15
of three methods of fractal analysis applied to soot aggregates from wood combustion, J. Aerosol Sci., 37, 820–838, 2006.
Hand, J. L., Malm, W. C., Laskin, A., Day, D., Lee, T., Wang, C., Carrico, C., Carrillo, J., Cowin, J. P., Collett, J., and Iedema, M. J.: Optical, physical, and chemical properties of tar balls observed during the Yosemite Aerosol Characterization Study, J. Geophys. Res.-Atmos.,
20
110, D21210, doi:10.1029/2004JD005728, 2005.
Hara, K., Yamagata, S., Yamanouchi, T., Sato, K., Herber, A., Iwasaka, Y., Nagatani, M., and Nakata, H.: Mixing states of individual aerosol particles in spring Arctic tro-posphere during ASTAR 2000 campaign, J. Geophys. Res.-Atmos., 108, D7, 4209, doi:10.1029/2002JD002513, 2003.
25
Hasegawa, S. and Ohta, S.: Some measurements of the mixing state of soot-containing parti-cles at urban and non-urban sites, Atmos. Environ., 36, 3899–3908, 2002.
Haywood, J. M., Roberts, D. L., Slingo, A., Edwards, J. M., and Shine, K. P.: General circulation model calculations of the direct radiative forcing by anthropogenic sulfate and fossil-fuel soot aerosol, J. Climate, 10, 1562–1577, 1997.
30
Hudson, P. K., Murphy, D. M., Cziczo, D. J., Thomson, D. S., De Gouw, J. A., Warneke, C., Holloway, J., Jost, J. R., and H ¨ubler, G.: Biomass-burning particle measurements: Char-acteristic composition and chemical processing, J. Geophys. Res.-Atmos., 109, D23S27,
ACPD
8, 9179–9207, 2008Internally mixed soot particles K. Adachi and P. R. Buseck Title Page Abstract Introduction Conclusions References Tables Figures ◭ ◮ ◭ ◮ Back Close
Full Screen / Esc
Printer-friendly Version Interactive Discussion
doi:10.1029/2003JD004398, 2004.
IPCC: Climate Change 2007: The Physical Science Basis. Contribution of Working Group I to the Fourth Assessment Report of the Intergovernmental Panel on Climate Change, edited by: Solomon, S., Qin, D., Manning, M., Chen, Z., Marquis, M., Averyt, K. B., Tignor, M., and Miller, H. L. Cambridge University Press, Cambridge, United Kingdom and New York, NY,
5
USA, 996 pp., 2007.
Jacobson, M. Z.: Strong radiative heating due to the mixing state of black carbon in atmospheric aerosols, Nature, 409, 695–697, 2001.
Jiang, M., Marr, L. C., Dunlea, E. J., Herndon, S. C., Jayne, J. T., Kolb, C. E., Knighton, W. B., Rogers, T. M., Zavala, M., Molina, L. T., and Molina, M. J.: Vehicle fleet emissions of
10
black carbon, polycyclic aromatic hydrocarbons, and other pollutants measured by a mobile laboratory in Mexico City, Atmos. Chem. Phys., 5, 3377–3387, 2005,
http://www.atmos-chem-phys.net/5/3377/2005/.
Johnson, K. S., Zuberi, B., Molina, L. T., Molina, M. J., Iedema, M. J., Cowin, J. P., Gaspar, D. J., Wang, C., and Laskin, A.: Processing of soot in an urban environment: case study from
15
the Mexico City Metropolitan Area, Atmos. Chem. Phys., 5, 3033–3043, 2005,
http://www.atmos-chem-phys.net/5/3033/2005/.
Johnson, K. S., de Foy, B., Zuberi, B., Molina, L. T., Molina, M. J., Xie, Y., Laskin, A., and Shut-thanandan, V.: Aerosol composition and source apportionment in the Mexico City Metropoli-tan Area with PIXE/PESA/STIM and multivariate analysis, Atmos. Chem. Phys., 6, 4591–
20
4600, 2006,http://www.atmos-chem-phys.net/6/4591/2006/.
Jonsson, H. H., Wilson, J. C., Brock, C. A., Knollenberg, R. G., Newton, R., Dye, J. E., Baum-gardner, D., Borrmann, S., Ferry, G. V., Pueschel, R., Woods, D. C., and Pitts, M. C.: Per-formance of a focused cavity aerosol spectrometer for measurements in the stratosphere of particle size in the 0.06–2.0-µm-diameter range, J. Atmos. Ocean. Tech., 12, 115–129,
25
1995.
Katrinak, K. A., Rez, P., and Buseck, P. R.: Structural variations in individual carbonaceous particles from an urban aerosol, Environ. Sci. Technol., 26, 1967–1976, 1992.
King, S. M., Rosenoern, T., Shilling, J. E., Chen, Q., and Martin, S. T.: Cloud condensation nucleus activity of secondary organic aerosol particles mixed with sulfate, Geophys. Res.
30
Lett., 34, L24806, doi:10.1029/2007GL030390, 2007.
Kleinman, L. I., Springston, S. R., Daum, P. H., Lee, Y.-N., Nunnermacker, L. J., Senum, G. I., Wang, J., Weinstein-Lloyd, J., Alexander, M. L., Hubbe, J., Ortega, J., Canagaratna, M.
ACPD
8, 9179–9207, 2008Internally mixed soot particles K. Adachi and P. R. Buseck Title Page Abstract Introduction Conclusions References Tables Figures ◭ ◮ ◭ ◮ Back Close
Full Screen / Esc
Printer-friendly Version Interactive Discussion
R., and Jayne, J.: The time evolution of aerosol composition over the Mexico City plateau, Atmos. Chem. Phys., 8, 1559–1575, 2008,http://www.atmos-chem-phys.net/8/1559/2008/. Kojima, T., Buseck, P. R., Wilson, J. C., Reeves, J. M., and Mahoney, M. J.: Aerosol particles
from tropical convective systems: Cloud tops and cirrus anvils, J. Geophys. Res.-Atmos., 109, D12201, doi:10.1029/2003JD004504, 2004.
5
Kojima, T., Buseck, P. R., and Reeves, J. M.: Aerosol particles from tropical convective systems: 2. Cloud bases, J. Geophys. Res.-Atmos., 110, D09203, doi:10.1029/2004JD005173, 2005. Kojima, T., Buseck, P. R., Iwasaka, Y., Matsuki, A., and Trochkine, D.: Sulfate-coated dust
particles in the free troposphere over Japan, Atmos. Res., 82, 698–708, 2006.
K ¨oyl ¨u, ¨U. ¨O., Faeth, G. M., Farias, T. L., and Carvalho, M. G.: Fractal and projected structure
10
properties of soot aggregates, Combust. Flame, 100, 621–633, 1995.
Kreidenweis, S. M., Remer, L. A., Bruintjes, R., and Dubovik, O.: Smoke aerosol from biomass burning in Mexico: Hygroscopic smoke optical model, J. Geophys. Res.-Atmos., 106, 4831– 4844, 2001.
Li, J., P ´osfai, M., Hobbs, P. V., and Buseck, P. R.: Individual aerosol particles from biomass
15
burning in southern Africa: 2, Compositions and aging of inorganic particles, J. Geophys. Res.-Atmos., 108, D13, 8484, doi:10.1029/2002JD002310, 2003.
Liu, X. D., Van Espen, P., Adams, F., Cafmeyer, J., and Maenhaut, W.: Biomass burning in southern Africa: Individual particle characterization of atmospheric aerosols and savanna fire samples, J. Atmos. Chem., 36, 135–155, 2000.
20
Liu, L. and Mishchenko, M. I.: Effects of aggregation on scattering and radiative properties of soot aerosols, J. Geophys. Res.-Atmos., 110, D11211, doi:10.1029/2004JD005649, 2005.
Lohmann, U., Broekhuizen, K., Leaitch, R., Shantz, N., and Abbatt, J.: How efficient
is cloud droplet formation of organic aerosols?, Geophys. Res. Lett., 31, L05108, doi:10.1029/2003GL018999, 2004.
25
Lohmann, U. and Feichter, J.: Global indirect aerosol effects: a review, Atmos. Chem. Phys., 5, 715–737, 2005,http://www.atmos-chem-phys.net/5/715/2005/.
Mishchenko, M. I., Liu, L., Travis, L. D., and Lacis, A. A.: Scattering and radiative properties of semi-external versus external mixtures of different aerosol types, J. Quant. Spectrosc. Ra., 88, 139–147, 2004.
30
Moffet, R. C., de Foy, B., Molina, L. T., Molina, M. J., and Prather, A.: Measurement of ambient aerosols in northern Mexico City by single particle mass spectrometry, Atmos. Chem. Phys. Discuss., 7, 6413–6457, 2007,http://www.atmos-chem-phys-discuss.net/7/6413/2007/.
ACPD
8, 9179–9207, 2008Internally mixed soot particles K. Adachi and P. R. Buseck Title Page Abstract Introduction Conclusions References Tables Figures ◭ ◮ ◭ ◮ Back Close
Full Screen / Esc
Printer-friendly Version Interactive Discussion
Molina, L. T., Kolb, C. E., de Foy, B., Lamb, B. K., Brune, W. H., Jimenez, J. L., Ramos-Villegas, R., Sarmiento, J., Paramo-Figueroa, V. H., Cardenas, B., Gutierrez-Avedoy, V., and Molina, M. J.: Air quality in North America’s most populous city-overview of the MCMA-2003 campaign, Atmos. Chem. Phys., 7, 2447–2473, 2007,
http://www.atmos-chem-phys.net/7/2447/2007/.
5
Moya, M., Castro, T., Zepeda, M., and Baez, A.: Characterization of size-differentiated inorganic composition of aerosols in Mexico City, Atmos. Environ., 37, 3581–3591, 2003.
Murphy, D. M., Cziczo, D. J., Froyd, K. D., Hudson, P. K., Matthew, B. M., Middlebrook, A. M., Peltier, R. E., Sullivan, A., Thomson, D. S., and Weber, R. J.: Single-particle mass spectrometry of tropospheric aerosol particles, J. Geophys. Res.-Atmos., 111, D23S32,
10
doi:10.1029/2006JD007340, 2006.
Myhre, G., Stordal, F., Restad, K., and Isaksen, I. S. A.: Estimation of the direct radiative forcing due to sulfate and soot aerosols, Tellus B, 50, 463–477, 1998.
Niemi, J. V., Saarikoski, S., Tervahattu, H., M ¨aKel ¨a, T., Hillamo, R., Vehkam ¨aKi, H., Sogacheva, L., and Kulmala, M.: Changes in background aerosol composition in Finland during polluted
15
and clean periods studied by TEM/EDX individual particle analysis, Atmos. Chem. Phys., 6, 5049–5066, 2006,http://www.atmos-chem-phys.net/6/5049/2006/.
Okada, K., Ikegami, M., Zaizen, Y., Tsutsumi, Y., Makino, Y., Jensen, J. B., and Gras, J. L.: Soot particles in the free troposphere over Australia, Atmos. Environ., 39, 5079–5089, 2005. Penner, J. E., Chuang, C. C., and Grant, K.: Climate forcing by carbonaceous and sulfate
20
aerosols, Clim. Dynam., 14, 839–851, 1998.
P ´osfai, M., Xu, H. F., Anderson, J. R., and Buseck, P. R.: Wet and dry sizes of atmospheric aerosol particles: An AFM-TEM study, Geophys. Res. Lett., 25, 1907–1910, 1998.
P ´osfai, M., Anderson, J. R., Buseck, P. R., and Sievering, H.: Soot and sulfate aerosol particles in the remote marine troposphere, J. Geophys. Res.-Atmos., 104, 21 685–21 693, 1999.
25
P ´osfai, M., Simonics, R., Li, J., Hobbs, P. V., and Buseck, P. R.: Individual aerosol particles from biomass burning in southern Africa: 1. Compositions and size distributions of carbonaceous particles, J. Geophys. Res.-Atmos., 108, D13, 8483, doi:10.1029/2002JD002291, 2003. P ´osfai, M., Gelencs ´er, A., Simonics, R., Arat ´o, K., Li, J., Hobbs, P. V., and Buseck, P. R.:
Atmospheric tar balls: Particles from biomass and biofuel burning, J. Geophys. Res.-Atmos.,
30
109, D06213, doi:10.1029/2003JD004169, 2004.
Querol, X., Pey, J., Minguill ´oN, M. C., P ´eRez, N., Alastuey, A., Viana, M., Moreno, T., Bernab ´e, R. M., Blanco, S., C ´ardenas, B., Vega, E., Sosa, G., Escalona, S., Ruiz, H., and Art´ı˜nAno, B.:
ACPD
8, 9179–9207, 2008Internally mixed soot particles K. Adachi and P. R. Buseck Title Page Abstract Introduction Conclusions References Tables Figures ◭ ◮ ◭ ◮ Back Close
Full Screen / Esc
Printer-friendly Version Interactive Discussion
PM speciation and sources in Mexico during the MILAGRO-2006 Campaign, Atmos. Chem. Phys., 8, 111–128, 2008,http://www.atmos-chem-phys.net/8/111/2008/.
Ramanathan, V., Crutzen, P. J., Kiehl, J. T., and Rosenfeld, D.: Atmosphere-Aerosols, climate, and the hydrological cycle, Science, 294, 2119–2124, 2001.
Ramanathan, V. and Carmichael, G.: Global and regional climate changes due to black carbon,
5
Nature Geosci., 1, 221–227, 2008.
Salcedo, D., Onasch, T. B., Dzepina, K., Canagaratna, M. R., Zhang, Q., Huffman, J. A., De-Carlo, P. F., Jayne, J. T., Mortimer, P., Worsnop, D. R., Kolb, C. E., Johnson, K. S., Zuberi, B., Marr, L. C., Volkamer, R., Molina, L. T., Molina, M. J., Cardenas, B., Bernab ´e, R. M., M ´arquez, C., Gaffney, J. S., Marley, N. A., Laskin, A., Shutthanandan, V., Xie, Y., Brune, W.,
10
Lesher, R., Shirley, T., and Jimenez, J. L.: Characterization of ambient aerosols in Mexico City during the MCMA-2003 campaign with Aerosol Mass Spectrometry: results from the CENICA Supersite, Atmos. Chem. Phys., 6, 925–946, 2006,
http://www.atmos-chem-phys.net/6/925/2006/.
Stone, E. A., Snyder, D. C., Sheesley, R. J., Sullivan, A. P., Weber, R. J., and Schauer, J. J.:
15
Source apportionment of fine organic aerosol in Mexico City during the MILAGRO experi-ment 2006, Atmos. Chem. Phys., 8, 1249–1259, 2008,
http://www.atmos-chem-phys.net/8/1249/2008/.
Takahama, S., Gilardoni, S., Russell, L. M., and Kilcoyne, A. L. D.: Classification of multiple types of organic carbon composition in atmospheric particles by scanning transmission
X-20
ray microscopy analysis, Atmos. Environ., 41, 9435–9451, 2007.
Takemura, T., Nozawa, T., Emori, S., Nakajima, T. Y., and Nakajima, T.: Simulation of climate response to aerosol direct and indirect effects with aerosol transport-radiation model, J. Geo-phys. Res.-Atmos., 110, D02202, doi:10.1029/2004JD005029, 2005.
Utsunomiya, S., Jensen, K. A., Keeler, G. J., and Ewing, R. C.: Direct identification of trace
25
metals in fine and ultrafine particles in the Detroit urban atmosphere, Environ. Sci. Technol., 38, 2289–2297, 2004.
van Poppel, L. H., Friedrich, H., Spinsby, J., Chung, S. H., Seinfeld, J. H., and Buseck, P. R.: Electron tomography of nanoparticle clusters: Implications for atmospheric lifetimes and ra-diative forcing of soot, Geophys. Res. Lett., 32, L24811, doi:10.1029/2005GL024461, 2005.
30
Yamato, M. and Ono, A.: Chemical and physical properties of stratospheric aerosol particles in the vicinity of tropopause folding, J. Meteorol. Soc. Jpn., 67, 147–166, 1989.
ACPD
8, 9179–9207, 2008Internally mixed soot particles K. Adachi and P. R. Buseck Title Page Abstract Introduction Conclusions References Tables Figures ◭ ◮ ◭ ◮ Back Close
Full Screen / Esc
Printer-friendly Version Interactive Discussion
over the North Pacific Ocean: Particle chemistry in relation to air mass origin, J. Geophys. Res., 99, D3, 5353–5378, 1994.
Yokelson, R. J., Urbanski, S. P., Atlas, E. L., Toohey, D. W., Alvarado, E. C., Crounse, J. D., Wennberg, P. O., Fisher, M. E., Wold, C. E., Campos, T. L., Adachi, K., Buseck, P. R., and Hao, W. M.: Emissions from forest fires near Mexico City, Atmos. Chem. Phys., 7, 5569–
5
5584, 2007,http://www.atmos-chem-phys.net/7/5569/2007/.
Zavala, M., Herndon, S. C., Slott, R. S., Dunlea, E. J., Marr, L. C., Shorter, J. H., Zahniser, M., Knighton, W. B., Rogers, T. M., Kolb, C. E., Molina, L. T., and Molina, M. J.: Characterization of on-road vehicle emissions in the Mexico City Metropolitan Area using a mobile laboratory in chase and fleet average measurement modes during the MCMA-2003 field campaign,
10
ACPD
8, 9179–9207, 2008Internally mixed soot particles K. Adachi and P. R. Buseck Title Page Abstract Introduction Conclusions References Tables Figures ◭ ◮ ◭ ◮ Back Close
Full Screen / Esc
Printer-friendly Version Interactive Discussion
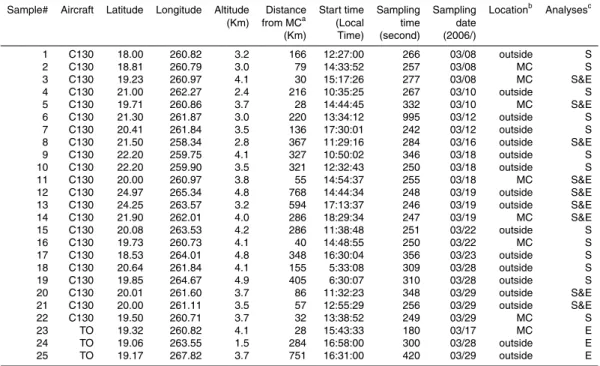
Table 1.Samples analyzed in this study.
Sample# Aircraft Latitude Longitude Altitude Distance Start time Sampling Sampling Locationb Analysesc (Km) from MCa (Local time date
(Km) Time) (second) (2006/) 1 C130 18.00 260.82 3.2 166 12:27:00 266 03/08 outside S 2 C130 18.81 260.79 3.0 79 14:33:52 257 03/08 MC S 3 C130 19.23 260.97 4.1 30 15:17:26 277 03/08 MC S&E 4 C130 21.00 262.27 2.4 216 10:35:25 267 03/10 outside S 5 C130 19.71 260.86 3.7 28 14:44:45 332 03/10 MC S&E 6 C130 21.30 261.87 3.0 220 13:34:12 995 03/12 outside S 7 C130 20.41 261.84 3.5 136 17:30:01 242 03/12 outside S 8 C130 21.50 258.34 2.8 367 11:29:16 284 03/16 outside S&E 9 C130 22.20 259.75 4.1 327 10:50:02 346 03/18 outside S 10 C130 22.20 259.90 3.5 321 12:32:43 250 03/18 outside S 11 C130 20.00 260.97 3.8 55 14:54:37 255 03/18 MC S&E 12 C130 24.97 265.34 4.8 768 14:44:34 248 03/19 outside S&E 13 C130 24.25 263.57 3.2 594 17:13:37 246 03/19 outside S&E 14 C130 21.90 262.01 4.0 286 18:29:34 247 03/19 MC S&E 15 C130 20.08 263.53 4.2 286 11:38:48 251 03/22 outside S 16 C130 19.73 260.73 4.1 40 14:48:55 250 03/22 MC S 17 C130 18.53 264.01 4.8 348 16:30:04 356 03/23 outside S 18 C130 20.64 261.84 4.1 155 5:33:08 309 03/28 outside S 19 C130 19.85 264.67 4.9 405 6:30:07 310 03/28 outside S 20 C130 20.01 261.60 3.7 86 11:32:23 348 03/29 outside S&E 21 C130 20.00 261.11 3.5 57 12:55:29 256 03/29 outside S&E 22 C130 19.50 260.71 3.7 32 13:38:52 249 03/29 MC S 23 TO 19.32 260.82 4.1 28 15:43:33 180 03/17 MC E 24 TO 19.06 263.55 1.5 284 16:58:00 300 03/28 outside E 25 TO 19.17 267.82 3.7 751 16:31:00 420 03/29 outside E a 19.5◦ N and 99◦
W are used for the center of MC.
b
Outside indicates samples collected from outside of the MC plume. MC indicates samples collected from the MC plume.
c
S indicates samples used for size measurements (Fig. 4) and number fraction analysis (Fig. 5), and E indicates samples used for EDS analysis. Samples marked S&E were used for both types of analyses. TO=Twin Otter.
ACPD
8, 9179–9207, 2008Internally mixed soot particles K. Adachi and P. R. Buseck Title Page Abstract Introduction Conclusions References Tables Figures ◭ ◮ ◭ ◮ Back Close
Full Screen / Esc
Printer-friendly Version Interactive Discussion 10 nm 200 nm a b c) d) soot ([K]) ([N, S,K,Sn]) (S,K) ([Zn]) (S,K,Zn,[N]) (Zn,[N,S,K]) (K,Zn,[N,S]) (Al,S,Zn) (Zn,[N,Al,S,K]) (S,K,Zn) (Zn,[S,K]) (S,K,Zn) ([S]) ([S]) (S,K,[N]) f ([N,S]) (S,K) (Na,S,K) (Al,S) (S,Zn, Sn, Pb,Bi,[N]) (Na,S,K,[N]) (Na,K,[N,S]) e (Na,[S]) ([N,S]) f e d c c d b soot soot filter OM soot OM soot soot soot soot OM OM OM residue residue residue residue Substrate 200 nm 200 nm 200 nm 200 nm Fig. 1.
ACPD
8, 9179–9207, 2008Internally mixed soot particles K. Adachi and P. R. Buseck Title Page Abstract Introduction Conclusions References Tables Figures ◭ ◮ ◭ ◮ Back Close
Full Screen / Esc
Printer-friendly Version Interactive Discussion
Fig. 1.Morphologies and compositions of internally mixed particles. Particles were deposited on lacy carbon filters. This sample was collected from MC (Sample #3 in Table 1). EDS analyses typically indicate minor to trace amounts of the elements in the other phases. (a) Low-magnification image of particles c to f. (b) High-resolution image of soot particles, OM, and filter. The lower-right illustration shows a sketch of the image. Soot particles have curved graphitic layers. OM and the filter, both of which consist of amorphous carbon, have disordered structures. (c–f) Typical images of internally mixed particles; their compositions were obtained using EDS and are given in parentheses, with the results shown in white. Elements in square brackets are in concentrations <1 wt%. C, O, and Si occur in all particles and are not shown in the figure. Soot, OM, and residue, which are indicated using black lines, were identified from their morphological properties.
ACPD
8, 9179–9207, 2008Internally mixed soot particles K. Adachi and P. R. Buseck Title Page Abstract Introduction Conclusions References Tables Figures ◭ ◮ ◭ ◮ Back Close
Full Screen / Esc
Printer-friendly Version Interactive Discussion ([K]) (K,[S]) (S,K) ([N,S,K]) ([N,S,K])
c
200 nm (K,[Na,Al,S]) (K,[N,Na,Al,S])d
200 nm (K,S,[Na]) (K,[N,Na,S]) (K,[N,Na,S,Zn]) (Al,K,[P,S])b
200 nma
200 nm b c d soot OM OM OMFig. 2. Morphologies and compositions of externally mixed OM-S and soot particles. Experi-mental conditions are the same as those in Fig. 1.
ACPD
8, 9179–9207, 2008Internally mixed soot particles K. Adachi and P. R. Buseck Title Page Abstract Introduction Conclusions References Tables Figures ◭ ◮ ◭ ◮ Back Close
Full Screen / Esc
Printer-friendly Version Interactive Discussion N O S K 100 nm R e la ti v e in te n si ty 0 1 1 2 3 * / * * / * (soot) 4 5 6 sulfate soot substrate OM EELS traversesese substrate K-rich
Fig. 3. Plot of composition vs. position in the internally mixed particle from the MC pollution plume (Sample #3). The sketch in the upper right shows the various species. Points 1-soot, 2-OM, 3-K-rich particle, 4-sulfate decomposition residue, 5-OM, 6-lacy-carbon filter. A total of 114 points were analyzed by using EELS at 10 nm intervals. The π* and σ* intensities were obtained by using the same method as Katrinak et al. (1992). We used intensities at 184.5, 294.5/σ*, and 402.5 eV in the EELS spectra for determining the relative abundances of S, K, and N, respectively. For O, total counts ranging from 531.5 to 536.5 eV were used. Exponential background extractions were applied.
ACPD
8, 9179–9207, 2008Internally mixed soot particles K. Adachi and P. R. Buseck Title Page Abstract Introduction Conclusions References Tables Figures ◭ ◮ ◭ ◮ Back Close
Full Screen / Esc
Printer-friendly Version Interactive Discussion 0 10 20 30 40 100 200 300 400 500 600 700 800 900 1000 >1000 Diameter (nm) F re q ue n cy %
Soot in internal mixture Coating in internal mixture
OM-S without soot Soot without coating
0 10 20 30 40 100 200 300 400 500 600 700 800 900 1000 >1000 Diameter (nm) F re q u e n cy %
Soot in internal mixture Coating in internal mixture
OM-S without soot Soot without coating Samples from MC plumes
Samples from outside of MC plumes
Fig. 4. Distributions of particle diameters. Total numbers of internally mixed particles, soot without coatings, and OM-S without soot are 1312, 176, and 789, respectively, and those of the samples from outside MC are 1492, 378, and 2989, respectively.
ACPD
8, 9179–9207, 2008Internally mixed soot particles K. Adachi and P. R. Buseck Title Page Abstract Introduction Conclusions References Tables Figures ◭ ◮ ◭ ◮ Back Close
Full Screen / Esc
Printer-friendly Version Interactive Discussion
OM-S without soot 55 % Soot without coating 7 % Tarball 5 % Other 5 % Soot with coating 28 % OM-S without soot 33 % Soot without coating 7 % Tarball 1 % Other 4 % Soot with coating 55 %
Samples from MC plumes 2412 particles from 7 samples
Samples from outside of MC plumes 5378 particles from15 samples
a) b)