HAL Id: hal-00329442
https://hal.archives-ouvertes.fr/hal-00329442
Submitted on 8 Nov 2005
HAL is a multi-disciplinary open access
archive for the deposit and dissemination of
sci-entific research documents, whether they are
pub-lished or not. The documents may come from
teaching and research institutions in France or
abroad, or from public or private research centers.
L’archive ouverte pluridisciplinaire HAL, est
destinée au dépôt et à la diffusion de documents
scientifiques de niveau recherche, publiés ou non,
émanant des établissements d’enseignement et de
recherche français ou étrangers, des laboratoires
publics ou privés.
equatorial spacecraft: description and first results
N. Cornilleau-Wehrlin, H. St. Alleyne, K. H. Yearby, B. de la Porte de Vaux,
A. Meyer, O. Santolik, Michel Parrot, G. Belmont, L. Rezeau, O. Le Contel,
et al.
To cite this version:
N. Cornilleau-Wehrlin, H. St. Alleyne, K. H. Yearby, B. de la Porte de Vaux, A. Meyer, et al..
The STAFF-DWP wave instrument on the DSP equatorial spacecraft: description and first results.
Annales Geophysicae, European Geosciences Union, 2005, 23 (8), pp.2785-2801. �hal-00329442�
SRef-ID: 1432-0576/ag/2005-23-2785 © European Geosciences Union 2005
Annales
Geophysicae
The STAFF-DWP wave instrument on the DSP equatorial
spacecraft: description and first results
N. Cornilleau-Wehrlin1, H. St. C. Alleyne2, K. H. Yearby2, B. de la Porte de Vaux1, A. Meyer1, O. Santol´ık3,
M. Parrot4, G. Belmont1, L. Rezeau5, O. Le Contel1, A. Roux1, D. Atti´e1, P. Robert1, V. Bouzid1, D. Herment1, and J. Cao6
1CETP/IPSL, 10-12 Ave de l’Europe, 78140 V´elizy, France
2University of Sheffield, Mappin Street, Sheffield, S1 3JD, UK
3Faculty of Mathematics and Physics, V Holesovickach 2, CZ-180 00 PRAHA 8, Czech Republic
4LPCE, 3A Av. de la Recherche Scientifique, 45071 Orl´eans Cedex 2, France
5CETP/IPSL/UPMC, 10-12 Av. de l’Europe, 78140 V´elizy, France
6CSSAR, Chinese Academy of Sciences, No 1, Nan Er Tiao, Zhong Guan Cun, Haidian District 100080, Beijing, People’s
Republic of China
Received: 17 February 2005 – Revised: 8 July 2005 – Accepted: 22 August 2005 – Published: 8 November 2005 Part of Special Issue “Double Star – First Results”
Abstract. The STAFF-DWP wave instrument on board the equatorial spacecraft (TC1) of the Double Star Project con-sists of a combination of 2 instruments which are a her-itage of the Cluster mission: the Spatio-Temporal Analysis of Field Fluctuations (STAFF) experiment and the Digital Wave-Processing experiment (DWP). On DSP-TC1 STAFF consists of a three-axis search coil magnetometer, used to measure magnetic fluctuations at frequencies up to 4 kHz and a waveform unit, up to 10 Hz, plus snapshots up to 180 Hz. DWP provides several onboard analysis tools: a complex FFT to fully characterise electromagnetic waves in the fre-quency range 10 Hz–4 kHz, a particle correlator linked to the PEACE electron experiment, and compression of the STAFF waveform data. The complementary Cluster and TC1 orbits, together with the similarity of the instruments, permits new multi-point studies. The first results show the capabilities of the experiment, with examples in the different regions of the magnetosphere-solar wind system that have been encoun-tered by DSP-TC1 at the beginning of its operational phase. An overview of the different kinds of electromagnetic waves observed on the dayside from perigee to apogee is given, in-cluding the different whistler mode waves (hiss, chorus, lion roars) and broad-band ULF emissions. The polarisation and propagation characteristics of intense waves in the vicinity of a bow shock crossing are analysed using the dedicated PRASSADCO tool, giving results compatible with previous studies: the broad-band ULF waves consist of a superimpo-sition of different wave modes, whereas the magnetosheath lion roars are right-handed and propagate close to the mag-netic field. An example of a combined Cluster DSP-TC1
Correspondence to: N. Cornilleau-Wehrlin
magnetopause crossing is given. This first case study shows that the ULF wave power intensity is higher at low latitude (DSP) than at high latitude (Cluster). On the nightside in the tail, a first wave event comparison – in a rather quiet time interval – is shown. It opens the doors to future studies, such as event timing during substorms, to possibly determine their onset location.
Keywords. Space Plasma Physics (Instruments and tech-niques; Waves and instabilities) – Magnetospheric Physics (Solar wind-magnetosphere interactions)
1 Introduction
Double Star is the first Chinese magnetospheric mission, which, in co-operation with the European Space Agency, comprises 2 spacecraft that house some of the spare scien-tific instrument models of the ESA Cluster project. The Dou-ble Star orbits are such that they are complementary to those of Cluster and permit comparisons between both missions, which are greatly facilitated by similar instruments being mounted on the different satellites. Such is the case of the wave experiment on board TC1, the equatorial spacecraft of the Double Star Project (DSP). The combined STAFF-DWP wave experiment mainly consists of the spares of the Clus-ter Spatio-Temporal Analysis of Field Fluctuations (STAFF) experiment and of the Cluster Digital Wave-Processing ex-periment (DWP).
The main scientific objectives are to study the thin lay-ers of the interaction regions between the solar wind and the Earth’s magnetosphere and to understand the trigger mech-anisms of magnetospheric substorms. Within these regions,
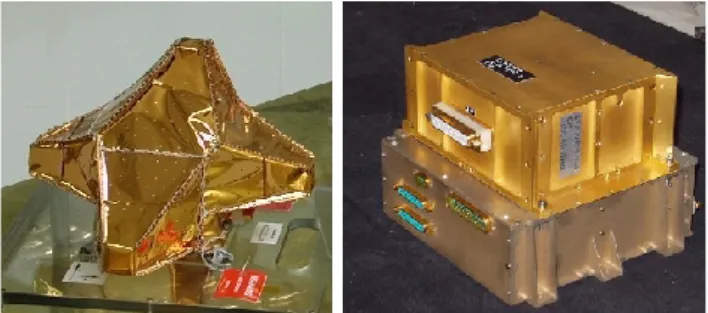
Fig. 1. Main elements of the STAFF-DWP experiment, at test. On
the left: picture of the three-axis search coil magnetometer with its thermal blanket. On the right, the electronic box: on the bottom is the DWP box, on top of which is the magnetic waveform unit (MWF).
waves are of particular importance because, in the absence of collisions, they provide the effective coupling between particles of the same and of different species, and give rise to the anomalous transport. The understanding of the basic physics of these regions is facilitated by a comprehension of the wave-particle interactions therein, and their conse-quences for the various particle populations present, as well as for the link between small-scale and large-scale physical processes.
Whereas the study of physical processes in 3-D is per-formed thanks to the four Cluster spacecraft, enabling one to separate spatial and temporal effects, the complementary orbits of Cluster and DSP permits other studies. The TC1
spacecraft has its apogee at 13.3 RE (Earth radii) and an
in-clination of 28.5◦, whereas Cluster has a polar orbit with
an apogee of 19.6 RE, both apogees being at the same local
time. This, for example, allows for the study of the influence of latitude on the rate of penetration of the solar wind plasma into the magnetosphere at the magnetopause or to study in the tail the location of the substorm triggering region.
After a description of the STAFF-DWP experiment, some examples of first results are given.
2 Instrument characteristics
The STAFF-DWP DSP TC1 wave experiment consists of the Search Coil antenna, pre-amplifier, Magnetic Wave Form unit (MWF), and power supply provided by CETP, and the Digital Wave Processor provided by the University of Sheffield. The three first elements are spares of the Cluster STAFF experiment (Cornilleau-Wehrlin et al., 1997, 2003), the power supply is a spare of the Cluster WEC experiment (Pedersen et al., 1997) and the Digital Wave Processor is based on the Cluster DWP experiment (Woolliscroft et al., 1997). The main elements of STAFF-DWP are visible in Fig. 1, while in a clean room before integrating on the space-craft. On the left is the three-axis search coil magnetometer with its thermal blanket, and on the right there is the electron-ics box. The electronelectron-ics box is comprised of the DWP box,
on top of which is the Magnetic Wave Form unit (MWF). The preamplifier and the power supply are not shown.
2.1 STAFF search coils and preamplifiers
The three-axis search coil magnetometer aims to measure magnetic fluctuations in the frequency range 0.1 Hz–4 kHz. The three mutually orthogonal sensors are mounted on a rigid boom that should have deployed away from the spacecraft body. Unfortunately, the STAFF antenna boom failed to de-ploy, which means interference from the spacecraft systems is very high. Even so, useful measurements can still be made, as will be shown later on.
Two sensors lie in the spin plane and the third one is par-allel to the spacecraft spin axis. Figure 2 shows the position of the STAFF search coil antennas in stowed configuration. It gives the relationship between the search coil electrical axis (B) and the spacecraft built axis (SC) in the spin plane (left-hand side of the figure) and in the spacecraft X, Z plane (right-hand side). In the stowed configuration the relations between the antenna (B) and spacecraft (SC) axes are: Bx=SCz, By=–SCy, Bz=SCx.
The asymmetry induced by the deployed FGM boom and
the undeployed STAFF boom, makes a 5◦angle between the
spin axis and the spacecraft SCz axis. Note that the name
of the electrical STAFF axes and spacecraft build axes are not the same, in order to keep the Cluster names for STAFF. When the data are further processed for scientific data anal-ysis and transformed into physical units, rotations are per-formed. Note that in particular, the axis parallel to the
space-craft axis z, SCz, is then named Bz.
The three sensors are identical. Each one consists of a high permeability core embedded inside two solenoids. The main winding has a very large number of turns mounted in separate sections. The frequency response of the sensor is flattened in the frequency range 40–4000 Hz by a secondary winding used to introduce flux feedback. The search coils are designed so as to minimise their sensitivity to electric fields. Three preamplifiers are mounted in an electrical unit, lo-cated on the spacecraft deck. These are the spare models from Cluster, using hybrid technology, which has the advan-tage of including protection against radiation and the possi-bility, although not used on DSP, of thermal control. The low-power-consumption preamplifiers have a low-noise in-put stage and high-inin-put impedance, since they are connected to the magnetic sensors which are characterised by a low DC resistance and very high impedance in the vicinity of the res-onant frequency. The dynamic range of the preamplifiers is about 100 dB, which allows weak signals to be measured in the presence of the large voltage induced by the rotation of the spacecraft in the DC magnetic field. With respect to Clus-ter, a slight modification has been applied to the DSP pream-plifiers, in order to minimise the saturation due to the spin signal, as the DSP perigee is much lower than that of Cluster. A filter has been added in front of the preamplifiers input. The signal is then reduced by 15 dB more at 0.25 Hz (the spin rate is 4 s), to keep a compromise between the part of
S C x S C y S C z B x B y B z S T A F F s e n s o r s i n s t o w e d c o n f i g u r a t i o n n o n d e p l o y e d b o o m S u n s e n s o r 1 5 ° S p i n S C x S C y S C z S p i n a x i s 5 ° S p a c e C r a f t B o d y B u i l d S y s t e m P r e c e s s i o n o f S C z a x i s B z B x - B y 4 5 °
Fig. 2. Relationship between STAFF search coil electrical axis (B), in the present stowed configuration, and the spacecraft built axis (SC).
At left: in the spin plane; at right: in the spacecraft X, Z plane, perpendicular to the spin plane.
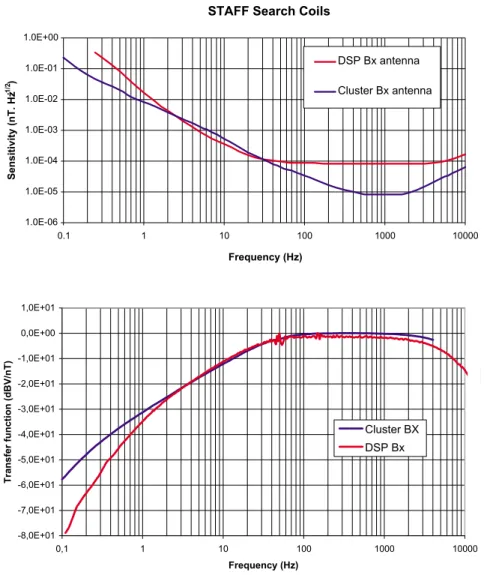
S T A F F S e a r c h C o i l s 1 . 0 E - 0 6 1 . 0 E - 0 5 1 . 0 E - 0 4 1 . 0 E - 0 3 1 . 0 E - 0 2 1 . 0 E - 0 1 1 . 0 E + 0 0 0 . 1 1 1 0 1 0 0 1 0 0 0 1 0 0 0 0 F r e q u e n c y ( H z ) S en si tiv ity (n T. H z -1 /2) D S P B x a n t e n n a C l u s t e r B x a n t e n n a - 8 , 0 E + 0 1 - 7 , 0 E + 0 1 - 6 , 0 E + 0 1 - 5 , 0 E + 0 1 - 4 , 0 E + 0 1 - 3 , 0 E + 0 1 - 2 , 0 E + 0 1 - 1 , 0 E + 0 1 0 , 0 E + 0 0 1 , 0 E + 0 1 0 , 1 1 1 0 1 0 0 1 0 0 0 1 0 0 0 0 F r e q u e n c y ( H z ) Tr an sf er fu nc tio n (d B V /n T) C l u s t e r B X D S P B x
Fig. 3. The DSP TC1 sensitivity and transfer function of the Bxcomponent of the triaxial search coils of the STAFF experiment in red. For
comparison the same for Cluster is drawn in blue. A filtering at the spin frequency has been added at the input of DSP preamplifiers, to take into account the strongest field at perigee, with respect to Cluster.
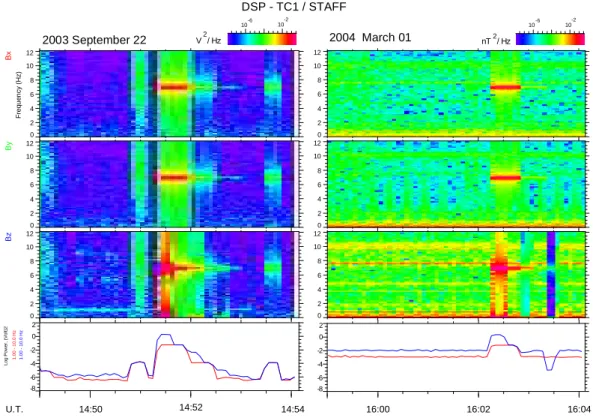
2003 September 22 14:50 14:52 14:54 U.T. 2004 March 01 0 2 4 6 8 10 12 0 2 4 6 8 10 12 0 2 4 6 8 10 12 16:00 16:02 16:04 -6 10 10-2 10-6 10-2 V / Hz2 nT / Hz2 -8 -6 -4 -2 0 2 DSP - TC1 / STAFF 0 2 4 6 8 10 12 F re q u e n c y ( H z ) B x 0 2 4 6 8 10 12 B y 0 2 4 6 8 10 12 B z -8 -6 -4 -2 0 2 L o g P o w e r, ( V o lt )2 1 .0 0 1 0 .0 H z 1 .0 0 1 0 .0 H z
Fig. 4. Dynamic spectra in the 0.1–12 Hz frequency range for the 3 components, in telemetry units during calibration sequences. The bottom
panel gives the integrated power of the signal in the 1–10 Hz frequency range for Bx(in red) an Bz(in blue) components for comparison,
on the left-hand side is the result of a calibration on the ground, the antennas being in a µ metal box, and on the right-hand side in flight on 1 March 2004. It shows that despite the interferences due to the nondeployment of the STAFF boom, the experiment functions properly and provides meaningful scientific results. On the bottom panels, one can see that the power corresponding to the strongest calibration signals are identical, when above the interference level. The minimum signal on the right side for the Bzcomponent just before 16:03:30 UT
corresponds to the direct access to the telemetry of the calibration signal, without going through the antennas, and its level is also identical in both cases (compare with data just after 14:52:30 UT on the left).
the orbit for which the search coil is not saturated and for the overall sensitivity of the experiment.
The experiment sensitivity and the transfer function are given in Fig. 3, together with Cluster STAFF sensitivity and transfer function for the sake of comparison. These mea-surements have been performed on the ground in a quiet site, Chambon la Forˆet. One can see the slight difference induced by the DSP additional filter. The measured
sensitiv-ity is 1.5×10⁻²nT Hz−1/2 at 1 Hz, 3.0×10⁻⁴nT Hz−1/2at
10 Hz and 10−4nT Hz−1/2between 30 Hz and 4 kHz.
The signal at the output of the preamplifiers goes to the Magnetic Wave Form analyser and to the Spectrum Analyser in the DWP box.
2.2 The Magnetic Wave Form unit
The Magnetic Wave Form unit (MWF) is comprised of two sets of low-pass filters, a waveform digitisation unit and a calibration unit.
The three magnetic components, Bx, By, Bz, at the output
of the search coil preamplifier are passed through the low-pass anti-aliasing filters with a –3 dB cut-off at 10 Hz for one set and at 180 Hz for the other set of filters. These filters are
of the 7th order, i.e. they have an attenuation of 42 dB per octave. They are stable to better than 1% in amplitude and
1◦in absolute phase.
The filtered signals are applied to three sample and hold devices, synchronised by the DWP experiment, then digi-tised and sent to the DWP experiment. The filtered signals are simultaneously sampled in a large dynamic range within a very short sampling time of about 10 µs, in order to guaran-tee a relative error of less than one degree at 180 Hz between the three components. The sampling rates are 25 and 450 Hz, respectively.
The 96 dB dynamic range allowed by the 16-bit digitisa-tion permits one to analyse simultaneously natural waves of
a few 10−4nT Hz1/2and the large signal induced by the
ro-tation of the spacecraft in the environmental DC field, up to
about 104nT at 0.25 Hz. Unlike Cluster, data going through
both sets of filters can be acquired simultaneously on DSP. Owing to telemetry limitations, a reduction of the dynamic data range from 16 to 12 bits is performed inside DWP. The principle is to transmit the full 16-bit word at the beginning of each telemetry packet, and later the difference between the successive samples is coded on 12 bits in such a way that the dynamics of the experiment are preserved even at boundary
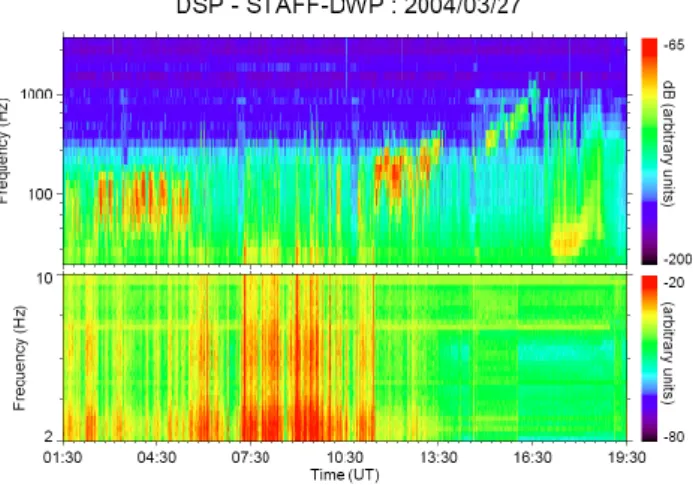
Fig. 5. Dynamic spectra of the less noisy component of the STAFF wave form data (from 2 to 10 Hz) on the bottom and of the DWP spectrum
analyzer (from 20 Hz to 4 kHz) on the top, for 27 March 2004, with a 1-min time resolution. Similar plots, for 3 h and for full orbit time periods, are available on DSDS web: http://edds02.iwf.oeaw.ac.at/dsdsweb-cgi/dsdsweb pick.
crossings. Normally the differences are small enough so that this process occurs without a loss. There are 2 compression modes, one being called “normal” and the other called “back-up”, which is more conservative. Unlike on Cluster, in addi-tion to the choice between either mode by telecommand, an option exists that automatically chooses the more appropri-ate compression mode. One can also choose by telecommand the “no compression” mode.
The MWF unit also generates an onboard calibration sig-nal. The calibration signal is transmitted through the sec-ondary winding of the antennas. Figure 4 gives a compari-son between dynamic spectra of two calibration sequences: one on the ground (left-hand side) during integration on the spacecraft, with the search coils being in a µ metal box, and one in flight (right-hand side). One can see that the experi-ment itself works; in particular, the strongest calibration sig-nal at 7 Hz is clearly visible, with the same intensity on the ground and in flight (see the bottom panels which give the
integrated power in the 1 to 10 Hz frequency range, for Bx
in red and Bzin blue). The comparison of the results of the
two calibration sequences shows that above the noise level induced by the interferences, the intensity of the signal is correct. Moreover, one can see on the bottom spectra on the
right side for the Bzcomponent, just before 16:03:30 UT, a
weak background level, together with a calibration signal at 7 Hz. This corresponds to a direct reception of the calibration signal, without going through the antenna, which allows ver-ification that the intensity of the injected calibration signal itself has not changed. It is further evidence that the experi-ment is working correctly.
2.3 Digital Wave Processor unit
The Digital Wave Processor of the DSP Wave experiment is derived from the Cluster DWP experiment (Woolliscroft et al., 1997). The absence of electric field measurements on board DSP permits the replacement of some functions of
the Cluster DWP, such as the data compression of Whisper data, by the functions of the Cluster Spectrum Analyser. DSP DWP has different functions: it performs on board spectrum analysis and MWF data compression, handles all telemetry and commanding for STAFF, and calculates the autocorrela-tions of electron counts received from PEACE (Fazakerley et al., 2005).
2.3.1 The spectral analysis
At higher frequencies, where the available telemetry does not permit acquisition of the waveform, an onboard Spectrum Analysis is performed by DWP. After the data pass through a low pass anti-alias filter, DWP digitises the 3 components of the analogue waveform at a 10-kHz sampling rate. The filter is a 6th order Chebyshev, which provides at least 40-dB rejection of aliases. There is also a simple 1st order high pass filter with a 10-Hz cut-off frequency to reduce the amplitude of the 0.25 Hz spin frequency signal. A complex FFT is then calculated to obtain a spectral matrix in a format that is sim-ilar to that of Cluster after appropriate averages. The spec-tral matrix (3 power spectra, plus the cross-specspec-tral phase between each component) is calculated at 27 frequencies be-tween 20 Hz and 4 kHz, with a 1 s time resolution. Each com-ponent is given to 8 bits, which provides an average of 3/8 dB amplitude resolution, and 1.4 deg in phase. This function of DWP differs from Cluster, where the STAFF experiment has its own dedicated spectrum analyser.
The spectrum analyser data may be processed on the ground to minimise the interference resulting from the non-deployment of the antenna boom. This is done by rejecting spectra acquired when large interference spikes occur, and by combining the signals from two axes of the antenna to synthesise a measurement in a direction where continuous interference is least. The optimum direction is adjusted as a function of frequency and spin phase. The data in Figs. 5 and 6 have been processed in this way.
STAFF/DWP 2004-03-27
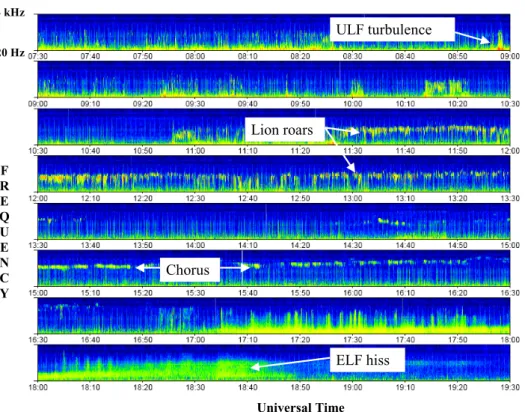
ULF turbulence Lion roars Chorus ELF hiss Universal Time 4 kHz 20 Hz F R E Q U E N C YFig. 6. Details of the spectrum analyser data for the same day as in Fig. 5, 27 March 2004, from 07:30 to 19:30 UT, with a 4-s time resolution,
and a logarithmic frequency scale. This is an example of the different kinds of waves that can be observed on a dayside orbit of DSP TC1, here from the solar wind to perigee. ULF turbulence is observed at bow shock crossings, lion roars inside the magnetosheath, chorus and hiss in the inner magnetosphere.
2.3.2 The electron autocorrelator
DWP also performs autocorrelations of electron counts re-ceived by PEACE, the low and medium energy electron mea-surement experiment (Johnstone et al., 1997). PEACE is comprised of two complementary sensors on Cluster, each sensor of the spare model being implemented on the TC1 and TC2 (polar orbiting spacecraft of the Double Star mission) of DSP, respectively. On TC1, it is the HEEA (High Energy Electron Analyser) sensor which has an inter-experiment link to DWP. Thus, the correlator function of DWP is very similar on DSP as on Cluster.
The correlation is performed at one fixed energy and one energy that is stepped over a pre-defined range, at one step per spin. The correlator allows for the study of the time structure of the electron counts, in the frequency range 1.3 to 40 kHz. The autocorrelation may occur at a rate between one and 8 times per spin. Normally 4 times per spin is used. The entire STAFF-DWP experiment is powered through the spare of the Cluster WEC power supply, which provides regulated power.
2.4 Modes of operations
On DSP there is only one telemetry rate. Nevertheless, differ-ent modes are possible and DWP may vary the combinations
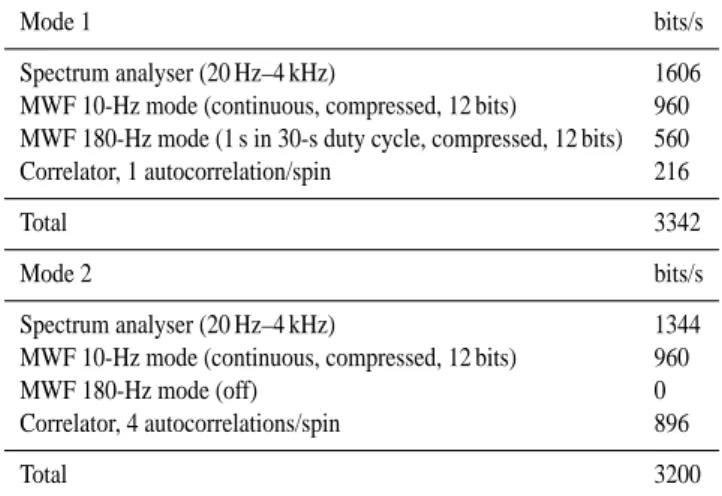
of the modes of the different parts of the STAFF-DWP exper-iment, in order to remain in the allocated telemetry. Exam-ples of such mode combinations, which are more often used, are given in Table 1.
A calibration is performed once a week. In spite of the nondeployment of the STAFF antennas’ boom, the calibra-tion examples provide the first evidence that the intensity of the measured wave events, when above the noise level, is sig-nificant. Before showing such results, let us comment on the interferences.
There are different sources of interferences. The first ob-vious ones come from the position of the antennas being stacked below the spacecraft. The interferences are payload and spacecraft mode of operation dependant, thus they vary often. This is why the search coils are usually housed on a
boom away from the spacecraft. The By component is the
cleanest one (see Fig. 2). There are also interferences due to the solar panels. These ones are solar aspect angle de-pendant, especially when the solar panels are intermittently shadowed by the FGM boom. That is why corrections to the attitude of the spin axis to make this axis perpendicular to the ecliptic plane, to the extent possible, have been performed to reduce this source of interference. Such corrections of at-titude have been done twice, on 17 February 2004 and on 13 July 2004. Just after the correction of attitude the data have much less interference and then data quality degrades
progressively until the next manoeuvre, due to the natural evolution of the spacecraft attitude. Unfortunately, the third correction of attitude manoeuvre foreseen for 15 November 2004 could not be performed, as the Attitude Control Com-puter failed after the big storm at the beginning of Novem-ber 2004. Nevertheless, the natural evolution of the position of the spin axis with time permits one to have the cleanest data during spring 2005. These interferences are mainly in the spin plane, at harmonics of the spin frequency (0.25 Hz). Globally, the interferences occur predominantly at low fre-quency, below 100 Hz.
Taking the above considerations into account, it is not sur-prising that STAFF data are clean during eclipses. Moreover, during long eclipses, only STAFF-DWP and the magnetome-ter experiment FGM (Carr et al., 2005) are powered-on due to a power limitation, and thus the STAFF-DWP data are very clean, as will be shown later on. These long eclipses (up to about four hours) occur when DSP TC1 apogee is in the tail.
3 First results
In what follows we show that despite the nondeployment of the STAFF boom and the induced level of interference, some useful measurements are performed, in mainly two sit-uations, either strong wave events, which is often the case on the dayside and in particular at boundary crossings, or dur-ing long eclipses in the tail. Unfortunately, durdur-ing the long eclipses in the 2004 summer period, very few events were observed, out of which two examples will be shown below.
Besides the wave studies with particle and magnetome-ter measurements on board DSP itself, the main scientific objectives rely on comparisons with simultaneous measure-ments on board Cluster. The apogees of both missions are at the same local time, but the different maximum distances from the Earth and different orbit planes make the compar-ison very exciting. DSP TC1 offers a 5th spacecraft to the resolution of the ambiguity of spatial and temporal effects. Among the scientific objectives to be fulfilled by the simulta-neous measurements performed by DSP and Cluster are the role of magnetic fluctuations at the magnetopause and the substorm studies in the tail.
3.1 Overview of wave events on the dayside
An overview of the different waves encountered by DSP TC1 during a large part of an orbit (19 h out of 27) is presented in Fig. 5 for 27 March 2004, when the orbit plane was at about 11:00 LT. In the top panel are plotted dynamic spectra calcu-lated from the onboard spectrum analyser data in the 20 Hz– 4 kHz frequency range. In the bottom panel of Fig. 5 are plotted the dynamic spectra of the wave component parallel to the spin axis in the 2–10-Hz frequency range, calculated from the wave form data. This kind of plot is similar to the one produced at the DSDS public web site (http://edds02. iwf.oeaw.ac.at/dsdsweb-cgi/dsdsweb pick). A strong wave activity can be seen, especially until 13:00 UT in both
fre-Table 1. The two main modes of operation of DSP-TC1
STAFF-DWP experiment.
Mode 1 bits/s
Spectrum analyser (20 Hz–4 kHz) 1606
MWF 10-Hz mode (continuous, compressed, 12 bits) 960
MWF 180-Hz mode (1 s in 30-s duty cycle, compressed, 12 bits) 560
Correlator, 1 autocorrelation/spin 216
Total 3342
Mode 2 bits/s
Spectrum analyser (20 Hz–4 kHz) 1344
MWF 10-Hz mode (continuous, compressed, 12 bits) 960
MWF 180-Hz mode (off) 0
Correlator, 4 autocorrelations/spin 896
Total 3200
quency ranges. By a visual inspection of the particle data on the DSDS web site, one can say that DSP was in the mag-netosheath until 08:50 UT, then went back and forth many times in the solar wind until 11:30 UT, remained in the mag-netosheath until about 14:00 UT, entering then the magne-tosphere. The strongest broad-band ULF waves, the fre-quency spectra of which are turbulent-like, occur at shock crossings, but also ULF activity is present throughout the magnetosheath. Let us call in what follows this ULF broad-band activity “ULF turbulence” (e.g. Saharaoui et al., 2004). At higher frequency there is also a lot of wave activity that changes in nature while DSP moves through the magneto-sphere. This is seen in more detail in Fig. 6 which presents spectrum analyser data from 07:30 until 19:30 UT, with a time resolution of 4 s instead of 1 min in Fig. 5. One can see the high frequency part of electromagnetic turbulence at the bow shock crossing just before 09:00 UT, then as the space-craft travels toward Earth in the magnetosheath, one can see quasi-monochromatic waves that are called lion roars (see, e.g. Smith and Tsurutani, 1976; Zhang et al., 1998;
Baumjo-hann et al., 1999; Maksimovic et al., 2001). These are
whistler mode waves known to occur in the magnetosheath, often in magnetic troughs but not always (Zang et al., 1998), usually linked to mirror modes (Tsurutani et al., 1982). More detailed analysis of lion roars seen by DSP is given in Yearby et al. (2005). After 14:30 UT, when DSP is in the magneto-sphere, one can see two other types of whistler mode waves; first, chorus waves, whose frequency increases as DSP ap-proaches the Earth and the magnetic field increases, as com-monly seen with Cluster (Parrot et al., 2003a, b) and also DSP (Santol´ık et al., 2005). Then close to perigee, there is ELF hiss or equatorial noise, also called subLHR hiss (see, e.g. Russell et al., 1970; Santol´ık et al., 2002). While the observation of such waves in those regions is not new, it per-mits one to provide evidence that the experiment is able to give useful measurements.
Fr eq ue nc y (H z) 1 2 : 0 0 2 4 6 8 1 0 1 2
B z
0 . 0 0 . 5 1 . 0 1 . 5 2 . 0 Lo g P ow er , ( nT )2 1 .0 0 - 1 0. 0 H z 1 2 : 0 0 1 2 : 1 0 1 2 : 2 0 U . T . 2 0 H z 4 k H zD S P - T C 1 S T A F F - D W P 2 0 0 4 A p r i l 0 5
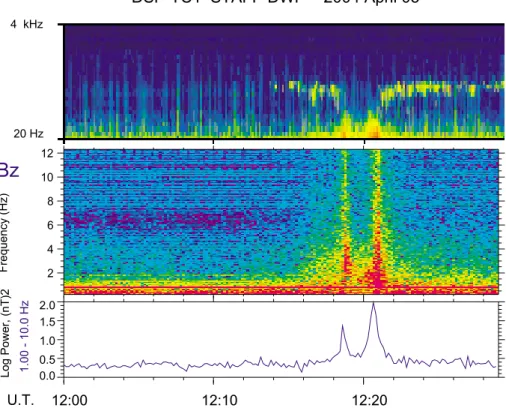
Fig. 7. Thirty minutes of STAFF data on 5 April 2004 when DSP was in the magnetosheath, at 09:30 LT, and went for a short excursion
into the solar wind around 12:20 UT. From top to bottom are the dynamic spectra of total power from the spectrum analyzer (20 Hz–4 kHz),
the dynamic spectra for the Bzcomponent of the waveform data in the 0.5–12 Hz frequency range and the integrated power of the same
component in the frequency range 1–10 Hz. The turbulence associated with the shock crossings is seen by both parts of the experiment, up to about 70 Hz, whereas on each side of the shock crossings, narrow band lion roars are clearly visible in the magnetosheath.
In what follows we give some examples of detailed mea-surements that open fields of future work.
3.2 Characterisation of the waves in the vicinity of the bow
shock – use of the PRASSADCO tool
The 13.3 RE apogee of the DSP equatorial spacecraft is
very interesting for Earth bow shock studies, as it permits skimming the shock around noon local time at low latitude, whereas previous missions, such as ISEE 1 and 2, crossed the shock rather quickly at those local times. Presently, Cluster crosses the bow shock at higher latitude, which is very in-teresting for further Cluster and DSP TC1 data comparisons and the understanding of the physics of the bow shock.
An example of a double bow shock crossing is given in Fig. 7, when DSP left the magnetosheath to enter the solar wind for just 2 min. The increase in the solar wind pressure, as observed at L1 by the ACE spacecraft during the preceding hour, explains that the shock crossed DSP. In the top panel is the dynamic spectrum of 30 min of Spectrum Analyser data, from 12:00 to 12:30 UT on 4 May 2004 when DSP was at about 10:00 LT. In the middle panel is the dynamic spectrum
for the same time interval of MWF data for the Bzcomponent
parallel to the spin axis, and in the bottom panel is given the ULF wave power integrated in the 1–10 Hz range. One can see that the ULF turbulence, which is characteristic of shock
crossings (see, e.g. Figs. 4 and 9 of Cornilleau-Wehrlin et al., 2003, which show typical shock crossings seen by Cluster), is seen in both dynamic spectra, up to at least 70 Hz. On each side of the shock, in the magnetosheath, a frequency band limited emission around 200 Hz, called lion roars, is clearly visible in the upper panel. Lion roars are intense emissions that are often emitted above 100 Hz and thus do not suffer much from DSP interferences. That is why, for the time interval shown in Fig. 7, it has been possible to use a specific tool called PRASSADCO to characterise the waves. PRASSADCO (PRopagation Analysis of STAFF-SA Data with COherency tests) is a computer program designed to analyse multi-component measurements of electromagnetic waves. It implements a number of methods used to estimate polarisation and propagation parameters, such as degree of polarisation, sense and axes of polarisation ellipse, wave vec-tor direction, Poynting vecvec-tor, and refractive index (Santol´ık, 2003). The main purpose of PRASSADCO was first to facil-itate scientific analysis of the spectral matrix obtained by the STAFF-SA (Spectrum Analyser) instruments on board the four Cluster satellites. Most of the results obtained with the Spectrum Analyser data of Cluster incorporate this tool (see, e.g. Parrot et al., 2003a; Santol´ık et al., 2002). PRASSADCO has been adapted to DSP data, in particular, it takes into ac-count the position of the antennas as defined in Fig. 2. The
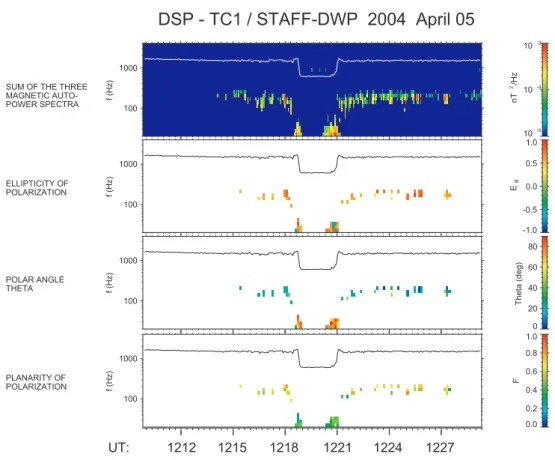
U T : 1 2 1 2 1 2 1 5 1 2 1 8 1 2 2 1 1 2 2 4 1 2 2 7 S U M O F T H E T H R E E M A G N E T I C A U T O -P O W E R S -P E C T R A 1 0 - 5 1 0 - 4 1 0 - 3 nT 2/H z 1 0 0 1 0 0 0 f ( Hz ) E L L I P T I C I T Y O F P O L A R I Z A T I O N - 1 . 0 - 0 . 5 0 . 0 0 . 5 1 . 0 EB 1 0 0 1 0 0 0 f ( Hz ) P O L A R A N G L E T H E T A 0 2 0 4 0 6 0 8 0 Th et a (d eg ) 1 0 0 1 0 0 0 f ( Hz ) P L A N A R I T Y O F P O L A R I Z A T I O N 0 . 0 0 . 2 0 . 4 0 . 6 0 . 8 1 . 0 F 1 0 0 1 0 0 0 f ( Hz )
D S P - T C 1 / S T A F F - D W P 2 0 0 4 A p r i l 0 5
Fig. 8. Results of the PRASSADCO analysis of the same event as in Fig. 7. From top to bottom are plotted, in frequency-time the total
power spectra, the ellipticity of polarization (+1=circular right-handed , 0=linear, –1=circular left-handed), the polar angle θ (0=k parallel to B0)and the planarity (1=plane waves). These wave polarization characteristics, color coded, are plotted only above a given wave power threshold. The electron gyrofrequency is over plotted on the dynamic spectra, showing clearly a reduced value in the solar wind. Whereas the polarization characteristics are confused for the turbulence at the shock, the lion roars are clearly right hand polarized, and propagate close to the magnetic field, θ <10◦.
inputs of this software are, in addition to the DSP STAFF-DWP raw data, the DSDS Prime Parameters of FGM, and the DSDS Summary Parameters of auxiliary data. The results can be represented in different visual and numerical formats. A similar program was used to analyse data of previous satel-lites (Santol´ık and Parrot, 1998, 1999; Santol´ık et al., 2001). The results of the wave characterisation for 20 min of data that appear in the top panel of Fig. 7, around 12:20 UT, are presented in Fig. 8. The different panels, from top to bottom, give the total magnetic wave power dynamic spectra, then at the same frequency time scale, the ellipticity of polarisa-tion, the polar angle theta and the planarity of polarisation. Those last three quantities are given only for frequency-time points corresponding to a magnetic power that is above some threshold to give only significant results. We can consider 2 different parts, first the ULF turbulence, then the lion roars. The planarity gives the significance of the results. Values close to zero mean that there is a mixture of different waves, whereas close to 1 it means that there is a plane wave. Then we see that the turbulence cannot be characterised, while it is closer to 1 for the lion roars. In the same way, there are different values of ellipticity for the turbulence and it is close to one, especially after 12:20 UT for the lion roars, which
means that they are right-hand polarised waves, consistent
with previous studies. Theta is small, between zero and 10◦
for the lion roars, which is not inconsistent with previous studies, telling either that those waves propagate parallel to the main magnetic field (Baumjohan et al., 1999), or not always close to it (Zhang et al., 1998; Maksimovic et al., 2001). The study of this event shows the capabilities of the experiment, as long as the waves are intense enough. For a more detailed study of lion roars as seen by DSP, together with a first comparison between DSP and Cluster, see Yearby et al. (2005).
3.3 An example of coordinated crossing of the
magne-topause by DSP and Cluster
The investigation of a the physical processes by which mass and momentum are transferred through the magnetopause, from the solar wind to the magnetosphere, is one of the prime goals of both the Cluster and DSP missions. Differ-ent models have been proposed, such as the reconnection model (Sonnerup, 1980) or the Kelvin-Helmholtz instabil-ity (Pu and Kivelson, 1983; Belmont and Chanteur, 1989). Also, there is evidence for localised flux tubes, known as
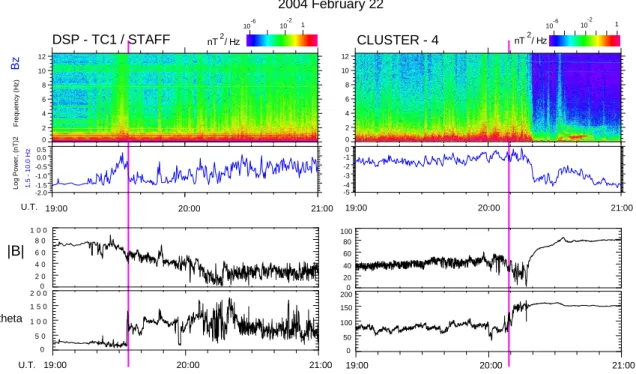
2794 N. Cornilleau-Wehrlin et al.: The Double Star STAFF-DWP wave instrument 0 2 4 6 8 10 12 -5 -4 -3 -2 -10 19:00 20:00 21:00 CLUSTER - 4 -6 -2 10 10 1 0 2 4 6 8 10 12 -2.0 -1.5 -1.0 -0.5 0.0 0.5 19:00 20:00 21:00 U.T. F re q u e n c y ( H z ) B z L o g P o w e r, ( n T )2 1 .5 1 0 .0 H z DSP - TC1 / STAFF -6 -2 10 10 1 0 2 0 4 0 6 0 8 0 1 0 0 |B| 0 5 0 1 0 0 1 5 0 2 0 0 B theta 19:00 20:00 21:00 U.T. 0 20 40 60 80 100 19:00 0 50 100 150 200 20:00 21:00 2004 February 22 nT / Hz2 nT / Hz2
Fig. 9. Magnetopause crossing by DSP and Cluster during their outbound and inbound pass, respectively, on 22 February 2004, indicated by
a violet line. STAFF dynamic spectra data are shown in the top panel, below which are plotted the integrated spectra. At the bottom, in order to evidence the crossings, the modulus and elevation of the magnetic field from the FGM PPD are plotted (see Fig. 10 for the orbits).
T C 1 C L U S T E R
T C 1
C L U S T E R
Fig. 10. Orbits of DSP TCI and Cluster for 22 February 2004 from 18:00 to 24:00 UT, including the period shown in Fig. 9. Asterisks
correspond to 18:00 UT and the bars to 21:00 UT. Their orbits are in the same meridian plane, but the latitude is different at the time of the magnetopause crossing.
Flux Transfer Events (FTEs), connecting the magnetosheath to the magnetosphere (Russell and Elphic, 1979; Farrugia et al., 1987). These FTEs are viewed as remnants of recon-nection events, but whether they are consequences of tearing (Bhattacharjee et al., 1999), KelvHelmholtz or another in-stability, is still an open question. Different experimental studies have given the indication that the small-scale elec-tromagnetic fluctuations, the amplitude of which is maxi-mum at the magnetopause (Perraut et al., 1979; Rezeau et al., 1989; Tsurutani et al., 1989), were likely to play a sig-nificant role in these transfers, taking the place of collisions which do not exist in the medium. After some preliminary
studies (Belmont et al., 1995; De Keyser et al., 1999), Bel-mont and Rezeau (2001) have proposed a theoretical model, which shows how the electromagnetic turbulence present in the magnetosheath can couple with the boundary. Accord-ing to this paper, when incident waves, assumed to propa-gate on the fast magnetosonic mode, impinge on the magne-topause, they first convert to Alfv´en waves. In the presence of a magnetic field rotation, these Alfv´en waves can then be trapped in the boundary, thereby producing a local enhance-ment of the fluctuation level. The major consequence of this trapped, small-scale turbulence should be to allow micro-reconnection through the magnetopause, possibly distributed
over the entire boundary (Rezeau and Belmont, 2001). The role of the waves that are observed at the magnetopause and in its vicinity is one of the prime objectives of the STAFF experiment, both on Cluster and on Double Star.
Cluster observations up to now do not permit one to choose between the different scenarios, but in fact show that the dif-ferent processes are at work. Some observations by Vaivads et al. (2004) are consistent with fast, collisonless reconnec-tion, whereas Owen et al. (2001) and Robert et al. (2002) report on Cluster observations of FTEs. Different Cluster studies gave evidence of the presence of a Kelvin-Helmholtz instability, as reported by Gustafson et al. (2001), Owen et al. (2004) and Hasegawa et al. (2004). A first Cluster mag-netopause crossing case study by Rezeau et al. (2001) also shows that the magnetopause is the seat of surface waves, possibly due to this Kelvin-Helmholtz instability. Superim-posed on this large-scale instability are ULF/ELF fluctua-tions (0.1–∼100 Hz) that, as previously observed, maximise at the magnetopause crossing, but are also present both in the boundary layer and the magnetosheath.
Thanks to the 4 Cluster spacecraft and to the use of the k-filtering method, it has been shown that the turbulence that is observed close to the magnetopause is at each frequency the superimposition of different modes at different k, due to the Doppler effect. But contrary to the prediction, the mirror mode has been shown to be dominant, while other ULF/ELF waves are also present (Sahraoui et al., 2003; 2004; Walker et al., 2004). The first Cluster data analysis with this method, in the very close vicinity of the magnetopause, show that there is some reflection of the waves at the magnetopause (Atti´e, private communication). One of the questions concerning the role of the ULF turbulence on mass and momentum trans-fer, is to evaluate in which region this is the most efficient. The comparison between DSP and Cluster data should say whether the low latitude and the noon or subsolar region are more favourable than the high latitude, and/or morning and evening local times.
A first analysis of simultaneous Cluster and DSP data sets shows that in the time period between 21 February 2004 and 22 May 2004, there are 21 coordinated magnetopause cross-ings, i.e. within less than 3 h, out of which 16 are within a 1-h time delay. The detailed comparison of this data set is left for further studies. One example is given in Fig. 9 for the magnetopause crossings of 22 February 2004 between 19:00 and 21:00 UT. DSP data are on the left and Cluster data are on the right. Only data of Cluster 4 are shown, since the STAFF data from all Cluster spacecraft are very simi-lar, as the separation between the four Cluster spacecraft is about 200 km for this time period. DSP crosses the mag-netopause at 19:33 UT during an outbound pass, whereas Cluster crosses it at 20:10 UT during an inbound part of its orbit. In the two top panels are plotted the STAFF MWF
dy-namic spectra of the Bzcomponent (parallel to the spin axis)
from 0.1 to 12.5 Hz and the integrated power spectra for this component from 1.5 to 10 Hz. The suppression of the low frequencies, eliminating strong interferences, makes the in-tegrated powers more comparable. In the bottom two panels
are plotted the magnetic field and the elevation theta angle from the FGM magnetometer Prime Parameter Data (PPD), for DSP (Carr et al., 2005) and Cluster (Balogh et al., 1997). The time of the estimated magnetopause crossing is given by a pink line. Cluster probably travels through the boundary layer between 20:10 and 20:20 UT. Figure 10 gives the orbit of Cluster and DSP TC1 in the Y, X and Z, X GSE planes from 18:00 to 24:00 UT. The asterisk is for 18:00 UT and the bar is for 21:00 UT. Whereas the spacecraft are close in local time, they are separated in latitude by 54 deg (see Table 2). We have used the Sibeck model (Sibeck et al., 1991) to eval-uate the magnetopause sub-solar point, i.e. its position in the Earth–Sun direction, using the spacecraft coordinates given in Table 2. The result is very similar for both crossings, 9.7
and 9.4 RE, consistent with a stable interplanetary medium
for the preceding time interval. This stability of the mag-netopause during the 40 min that separate the two crossings permits the comparison of the wave observations for these two crossings by DSP and Cluster, respectively.
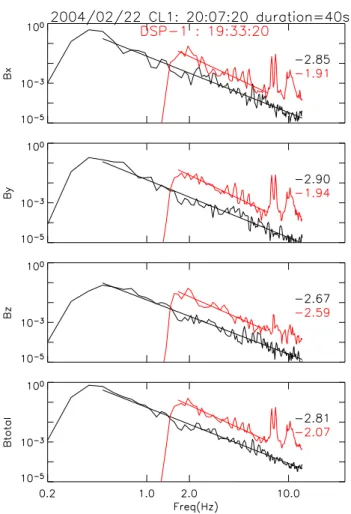
Figure 11 gives the power spectra for both Cluster 1 and DSP in the magnetosheath, the closest possible to the magne-topause crossing, in order to integrate over 40 s. The 3 com-ponents are given, in the spacecraft reference frame, which is not far from GSE, plus the total magnetic power. Cluster spectra are in black and DSP spectra are in red. On DSP, to eliminate the strongest interferences, frequencies below 2 Hz
have been filtered. In the Bx and By components,
interfer-ences around 8 and 10 Hz are clearly visible, whereas on Bz
it is clean. From these data, one can see that a comparison
of DSP and Cluster Bzcomponents is meaningful: the
spec-tra follow a power law, with a similar exponent of ∼–2.6 at both places, whereas the intensity is higher on DSP, at low latitude, by an order of magnitude.
This first result remains to be confirmed by a more system-atic study of the 21 events identified and compared to a more complete study with Cluster alone.
3.4 Examples of wave events recorded in the tail region
From DSP-Cluster comparisons some answers may be found to the question not yet resolved concerning the processes that trigger substorms in the tail. In the 2 main groups of mod-els, it is either the X-line formation that triggers the substorm (see, e.g. Baker et al., 1996) or the current disruption closer to the Earth that is the triggering factor (see, e.g. Lui et al., 1991; Roux et al., 1991). Timing studies should help decide between the two scenarios, with the similarity of the instru-ments on board Cluster and DSP, together with their
respec-tive orbits, giving a 6 RE separation at apogee, making this
comparison a priori quite suited for substorm studies. Most of the low frequency wave events observed in the tail with DSP during summer 2004 occur during long eclipse periods. This is very favourable for the quality of the STAFF-DWP wave data and the FGM magnetic field data, but no particle data are recorded during those long eclipses, thus limiting the scientific studies that can be performed during those periods.
Table 2. Positions of Cluster and DSP TC1 on 22 February 2004 at the time they cross the magnetopause. The 4 Cluster spacecraft were
separated by only 200 km. D Sibeck is the location of the magnetopause sub-solar point estimated with the Sibeck et al. (1991) model.
Magnetopause X(RE) Y(RE) Z(RE) R/RE D Sibeck (RE) * Latitude (deg)
crossing time (UT)
DSP TC1 19:30 8.6 4.3 1.4 9.8 9.7 8
CLUSTER 20:10 3.7 3.2 9.4 10.6 9.4 62
* Sibeck et al., 1991
Fig. 11. Integrated power over 40 s of ULF waves in the
magne-tosheath, the closest possible to the magnetopause, for both DSP (in red) and Cluster (in black) for the 3 components in GSE. To avoid the interferences, DSP data are filtered below 2 Hz. The power fit to a power law (nearly straight lines) is stopped at 6 Hz, to avoid higher frequency interferences in the spin plane. Nevertheless, we
will only consider the Bzcomponents. The exponents of the power
law are shown at the right-hand side of each panel. The power law is similar for both spacecraft, but the power is stronger for DSP, at low latitude, than observed by Cluster which crosses the magnetopause at 62 deg of latitiude (see Table 2).
3.4.1 A strong ULF wave event recorded by DSP
On 14 September 2004, while DSP TC1 was in the tail around perigee, an example of strong ULF activity is seen that starts just at the time of a change in the magnetic field. This event occurred during a long eclipse, when only FGM and STAFF-DWP are powered-on. Thus, the 3 components of the waveform data are not noisy. From top to bottom, Fig. 12 gives the dynamic spectra of the three magnetic com-ponents of the waves in the frequency range 0.1–9 Hz in the
satellite reference frame: Bxand Byare in the spin plane, Bx
being in the Sun direction, and Bzis parallel to the spin axis.
Below the dynamic spectra the integrated power is plotted in
the 1–10 Hz frequency range for the Bxand Bzcomponents
and at the very bottom the modulus of Bperpis drawn, where
the magnetic field component that is in the spin plane, is cal-culated from the STAFF spin signal. At the moment it is the only information that we have on the DC magnetic field, as the processing of FGM data without Sun reference pulse (we are in long eclipse) is far from being straightforward. The sudden onset of the wave activity at 15:24 UT is similar to the correlation between the ion cyclotron wave occurrence and the B field reconfigurations evidenced by Le Contel et
al. (2002) and Perraut et al. (2003). The Aeindex increases
at that time and Cluster sees AKR (Auroral Kilometric Radi-ation) around 15:30 UT, supporting that interpretation which cannot be verified with DSP, due to the lack of other mea-surements. It can be due also only to the penetration into the plasma sheet. Both possibilities, not exclusive, are supported
by the variation of BperpDC.
3.4.2 Simultaneous measurements on board Cluster and
DSP
Among possible periods for which DSP TC1 and Cluster were simultaneously in the tail during summer 2004, on 29 August, during an eclipse period for TC1 (from 05:40 to 10:00 UT), ULF wave activity was observed by both space-craft. Data for the time interval 07:20–08:30 UT are dis-played in Fig. 13, a time interval for which ULF activity was observed at both locations. The top 3 panels present DSP data and the bottom 3 panels represent Cluster 4 data. The 4 Cluster spacecraft registered similar data. The two sets of plots are similar and comprise ULF dynamic spectra in the
14:50 2 4 6 8 F re q u e n c y ( H z ) Bx 14:50 2 4 6 8 By 2 4 6 8 Bz -4 -3 -2 -1 0 1 L o g P o w e r, ( n T )2 1 .0 0 1 0 .0 H z 1 .0 0 1 0 .0 H z 14:50 15:00 15:10 15:20 15:30 15:40 15:50 0 10 20 30 B p e rp D C , n T U.T. -6 10 10-4 10-2 1 nT / Hz2 DSP - TC1 / STAFF 2004 September 14
Fig. 12. DSP STAFF wave form data for an event in the tail on 14 September 2004. The start of ULF turbulence corresponds to a substorm.
From top to bottom are plotted the 3 components of the dynamic spectra, the integrated power for Bx(in red) and Bz(in blue) and below the
modulus of the magnetic field in the spin plane as inferred from the STAFF spin signal. The data are very clean, as DSP is in an eclipse for that time interval.
the spin axis, the integrated power in the 1–10 Hz range and at the bottom the modulus of the magnetic field in the spin plane, similar to the bottom panel of Fig. 12. From the value
of Bperp DC, one can say that for this time interval, DSP
is in the plasma sheet, whereas Cluster 4 enters it at about
07:45 UT, when BperpDC diminishes, which is confirmed by
visual inspection of the whole set of Cluster data available on the CSDS web. For DSP TC1, STAFF data are the only data available now, as explained above. It seems that for this event the ULF wave activity is rather linked to the plasma
sheet encounter, but not to substorm activity, with the Ae
in-dex being quite low and flat for the whole day. This may be consistent with the low power level of the ULF waves, more than one order of magnitude below the level of the previously
reported event. Nevertheless, an event such as that on 29 Au-gust opens the door to future work on a comparison between DSP and Cluster data in view of a better understanding of substorm related and triggering processes.
4 Summary and conclusions
We have shown that despite the fact that the STAFF axial boom didn’t deploy on DSP TC1, the STAFF-DWP exper-iment described in this paper works well in itself and can give scientifically significant results in mainly two different conditions: either the natural wave events are intense and stronger than the interferences, or the spacecraft is in eclipse, which happens near apogee in the tail.
0 2 4 6 8 10 12 -5 -4 -3 -2 -1 07:20 07:30 07:40 07:50 08:00 08:10 08:20 08:30 0 5 10 15 20 U.T. F re q u e n c y ( H z )
B
z
L o g P o w e r, ( n T )2 1 .0 0 1 0 .0 H z B p e rp D C , n T -6 10 -8 10 10-4 0 2 4 6 8 10 12 -3.5 -3.0 -2.5 -2.0 -1.5 1 .0 0 1 0 .0 H z 07:20 07:30 07:40 07:50 08:00 08:10 08:20 08:30 1 2 3 4 5 6 7 U.T. F re q u e n c y ( H z )B
z
L o g P o w e r, ( n T )2 B p e rp D C , n T -6 10 -2 10 1 -4 10 nT / Hz2 DSP - TC1 / STAFF nT / Hz2 CLUSTER - 4 / STAFF 2004 August 29Fig. 13. Simultaneous wave observations by Cluster and DSP in the tail for 29 August 2004. For both spacecraft are given the Bzdynamic
spectra, integrated power and Bperp(see Fig. 12). DSP was in the plasma sheet whereas Cluster enters it, coming from the lobes, at about 07:45 UT. This is a quiet day, with no substorm activity.
Generally the search coil component that is along the y
spacecraft axis SCy is less perturbed, and interferences are
less numerous and intense above 100 Hz. The global level of interferences varies with time, depending, on the one hand, on the spacecraft and the payload operation modes and, on the other hand, on the spacecraft solar aspect angle. When the wave events are strong, all three components can be used to determine all wave properties such as polarisation,
oth-erwise the best one (less noisy) component is used. There is less interference and thus less background noise in the eclipses, when only STAFF-DWP and FGM are powered-on. Putting all this together, it means that one can make use of STAFF-DSP data for most of the wave events above 100 Hz, for chorus and strong lion roar events in the magnetosheath, and in the case of ULF waves, those that are generally broad-band and particularly intense at boundary crossings
(magnetopause and bow shock), and are often above the noise level in the magnetosheath. For the night-side, the up-to-now observed waves are less intense, but TC1 experiences long eclipses in the tail during which STAFF-DWP data are quite clean; unfortunately, these periods scientifically suffer from the absence of particle measurements.
The preliminary results presented here, besides providing an overview of the different kinds of waves that are present on the dayside orbit of DSP TC1, give the first steps of future work on items that are of primary interest for DSP and for comparison between DSP and Cluster.
The possibility of comparing intensity and power law of ULF waves in the vicinity of the magnetopause, at different latitudes, should help to identify the role of this strong ULF turbulence in the transfer of mass and momentum from the solar wind to the magnetosphere. In the first case study pre-sented here, the power law is the same, while the intensity is stronger on DSP at low latitude. This result needs to be explored further in light of other magnetopause crossings be-fore drawing final conclusions as to whether it is a unique or general result. Correlation of DSP and Cluster data in the tail, due to the similarity of the instruments and the separa-tion of some 5 Earth radii at their apogees also opens doors to possible improvement in the understanding of the physi-cal processes responsible for substorm onset. The first ex-ample found of simultaneous wave measurements in the tail and given here, shows that such a comparison is possible; unfortunately, this event is not substorm associated. Further analysis of other events is to be carried out.
Acknowledgements. The refurbishment, modifications, tests and
in-tegrations on TC1 of the Cluster spare models of STAFF and DWP was funded by the European Space Agency. The operations and data analysis are supported in France by a CNES grant and in the UK by a PPARC grant. ESA/ESTEC, Astrium, Magson, CSSAR and CAST teams are thanked for their invaluable help. Cluster and DSP FGM teams are thanked for providing Prime Parameter Data that are used in this study. Both referees are thanked for their con-structive comments.
Topical Editor T. Pulkkinen thanks J. S. Pickett and another ref-eree for their help in evaluating this paper.
References
Baker, D. N., Pulkinen, T. I., Angelopoulos, V., Baumjohann, W., and McPherron, R. L.: Neutral line model of substorms: Past results and present view, J. Geophys. Res., 101, 12 975–13 010, 1996.
Balogh, A., Dunlop, M. W., Cowley, S. W. H, Southwood, D. J., Thomlinson, J. G., Glassmeier, K.-H., Musmann, G., L¨uhr, H., Buchert, S., Acu˜na, M. H., Fairfield, D. H., Slavin, J. A., Riedler, W., Schwingenschuh, K., and Kivelson, M. G.: The Cluster Mag-netic field Investigation, Space Science Reviews, 79 (1-2), 107– 136, 1997.
Baumjohann, W., Treumann, R.A., Georgescu, E., Haerendel, G., Fornacon, K.-H., and Auster, U.: Waveform and packet structure of lion roars, Ann. Geophys., 17, 1528–1534, 1999.
Belmont, G. and Chanteur, G.: Advances in magnetopause Kelvin-Helmholtz instability studies, Physica Scripta, 40, 124–128, 1989.
Belmont, G. and Rezeau, L.: Magnetopause reconnection induced by magnetosheath Hall-MHD fluctuations, J. Geophys. Res., 106, 10 751–10 760, 2001.
Belmont, G., Rezeau, L., and Reberac, F.: Resonant amplification of magnetosheath MHD fluctuations at the magnetopause, Geo-phys. Res. Lett., 22, 295–298, 1995.
Bhattacharjee, A., Ma, Z. W., and Wang, X.: Impulsive reconnec-tion dynamics in collisionless laboratory and space plasmas, J. Geophys. Res., 104, 14 543–14 555, 1999.
Carr, C., Brown, P., Zhang, T. L., Gloag, J., Horbury, T.,Lucek, E., Magnes, W., O’Brien, H., Oddy, T., Auster, U., Austin, P., Ay-dogar, O., Balogh, A., Baumjohann, W., Beek, T., Eichelberger, H., Fornacon, K.-H., Georgescu, E., Glassmeier, K.-H., Lud-lam, M., Nakamura, R., and Richter, I.: The Double Star mag-netic field investigation: instrumentation design, performance and highlights of the first year’s observations, Ann. Geophys., 23, 2713–2732, 2005.
Cornilleau-Wehrlin, N., Chauveau, P., Louis, S., Meyer, A., Nappa, J. M., Perraut, S., Rezeau, L., Robert, P., Roux, A., de Villedary, C., de Conchy Y., Friel, L., Harvey, C. C., Hubert, D., Lacombe, C., Manning, R., Wouters, F., Lefeuvre, F., Parrot, M., Pinc¸on, J. L., Poirier, B., Kofman, W., and Louarn, Ph.: The CLUSTER Spatio-Temporal Analysis of Field Fluctuations (STAFF) Exper-iment, Space Sci. Rev., 79, 107–136, 1997.
Cornilleau-Wehrlin, N., Chanteur, G., Perraut, S., Rezeau, L., Robert, P., Roux, A., de Villedary, C., Canu, P., Maksimovic, M., de Conchy, Y., Hubert, D., Lacombe, C., Lefeuvre, F., Par-rot, M., Pinc¸on, J. L., D´ecr´eau, P. M. E., Harvey, C. C., Louarn, Ph., Santol´ık, O., Alleyne, H. St. C., Roth, M., and STAFF team: First results obtained by the Cluster STAFF experiment, Ann. Geophys., 21, 437–456, 2003.
De Keyser, J., Roth, M., Reberac, F., Rezeau, L., and Belmont, G.: Resonant amplification of MHD waves in realistic subso-lar magnetopause configurations, J. Geophys. Res., 104, 2399– 2409, 1999.
Fazakerley, A. N., Carter, P. J., Watson, G., Spencer, A., Sun, Y. Q., Coker, J., Coker, P., Kataria, D. O., Fontaine, D., Liu, Z. X., Gilbert, L., He, L., Lahiff, A. D., Mihaljˇci´c, B., Szita, S., Taylor, M. G. G. T., Wilson, R. J., Dedieu, M., and Schwartz, S. J.: The Double Star plasma electron and current experiment, Ann. Geophys., 23, 2733–2756, 2005.
Farrugia, C. J., Elphic, R. C., Southwood, D. J., and Cowley, S. W. H.: Field and flow perturbations outside the reconnection field line region in flux transfer events: theory, Planet. Space. Sci., 35, 227–240, 1987.
Gustafsson, G., Andr´e, M., Carozzi, T., Eriksson, A. I., F¨althammar, C.-G., Grard, R., Holmgren, G., Holtet, J. A., Ivchenko, N., Karlsson, T., Khotyaintsev, Y., Klimov, S., Laakso, H., Lindqvist, P.-A., Lybekk, B., Marklund, G., Mozer, F., Mur-sula, K., Pedersen, A., Popielawska, B., Savin, S., Stasiewicz, K., Tanskanen, P., Vaivads, A., and Wahlund, J.-E.: First results of electric field and density observations by Cluster EFW based on initial months of operation, Ann. Geophys., 19, 1219–1240, 2001.
Hasegawa, H., Fujimoto, M., Phan, T. D., R`eme, H., Balogh, A., Dunlop, M. W., Hashimoto, C., and TanDokoro, R.: Transport of solar wind into Earth’s magnetosphere through rolled-up Kelvin-Helmholtz vortices, Nature, 430, 755–758, 2004.
Johnstone, A. D., Alsop, C., Burge, S., Carter, P. J., Coates, A. J., Coker, A. J., Fazakerley, A. N., Grande, M., Gowen, R. A., Gurgiolo, C., Hancock, B. K., Narheim, B., Preece, A., Sheather, P. H., Winningham, J. D., and Woodliffe, R. D.: Peace: A Plasma Electron and Current Experiment, Space Sci. Rev., 79, 351–398, 1997.
Le Contel, O., Roux, A., Perraut, S., Pellat, R., Robert, P., Chanteur G., Fontaine, D., Cornilleau-Wehrlin, N., Sauvaud, J.-A., Cully, C., Parks, G., Chua, D., Andr´e, M., Balogh, A., Fazakerley, A., R`eme, H., Nagai, T., Mukai, T., Hayakawa, H., Matsuoka, A., Andserson, R., and Matsumoto, H.: Role of the Parallel Current Instability during Substorms: Theory and Observations, 6th In-ternational Conference on Substorm (ICS-6), 25–29 mars 2002, University of Washington, Seattle, USA, 326–333, 2002. Lui, A. T. Y., Chang, C.-L., Mankofsky, A., Wong, H.-K., and
Winske, D.: A cross-field current instability for substorm expan-sions, J. Geophys. Res., 96, 11 389–11 407, 1991.
Maksimovic, M., Harvey, C. C., Santol´ık, O., Lacombe, C., de Conchy, Y., Hubert, D., Pantellini, F., Cornilleau-Werhlin, N., Dandouras, I., Lucek, E. A., and Balogh, A.: Polarisation and propagation of lion roars in the dusk sidemagnetosheath, Ann. Geophys., 19, 1429–1438, 2001.
Owen, C. J., Fazakerley, A. N., Carter, P. J., Coates, A. J., Krauk-lis, I. C., Szita, S., Taylor, M. G. G. T., Travnicek, P., Wat-son, G., WilWat-son, R. J., Balogh, A., and Dunlop, M. W.: Clus-ter PEACE observations of electrons during magnetospheric flux transfer events, Ann. Geophys., 19, 1509–1522, 2001.
Owen, C. J., Taylor, M. G. G. T., Krauklis, I. C., Fazakerley, A. N., Dunlop, M. W., and Bosqued, J.-M.: Cluster observations of surface waves on the dawn flank magnetopause, Ann. Geophys., 22, 971–983, 2004.
Parrot, M., Santol´ık, O., Cornilleau-Wehrlin, N., Maksimovic, M., and Harvey, C. C: Source location of chorus emissions observed by Cluster, Ann. Geophys., 21, 473–480, 2003a.
Parrot, M., Santol´ık, O., Cornilleau-Wehrlin, N., Maksimovic, M., and Harvey, C. C.: Magnetospherically reflected chorus waves revealed by ray tracing with Cluster data, Ann. Geophys., 21, 1111–1120, 2003b.
Pedersen, A., Cornilleau-Wehrlin, N., de la Porte, B., Roux, A., Bouabdellah, A., D´ecr´eau, P. M. E., Lefeuvre, F., Sen´e, F. X., Gurnett, D., Huff, R., Gustafsson, G., Holmgren, G., Woollis-croft, L. J. C., Thompson, J. A., and Davies, P. H. N.: The Wave Experiment Consortium (WEC), Space Sci. Rev., 79, 93–106, 1997.
Perraut, S., Gendrin, R., Robert, P., and Roux, A.: Magnetic pulsa-tions observed onboard GEOS 2 in the ULF range during multi-ple magnetopause crossings, in: Proceedings of Magnetospheric Boundary Layer Conference, Alpbach, June 1979, ESA/SP-148, 113–122, 1979.
Perraut, S., Le Contel, O., Roux, A., Parks, G., Chua, D., Hoshino, M., Mukai, T., and Nagai, T.: Substorm expansion phase: Ob-servations from Geotail, Polar and IMAGE network, J. Geophys. Res., 108, doi:10.1029/2002JA009376, 2003.
Pu, Z. Y. and Kivelson, M. G.: Kelvin-Helmholtz instability at the magnetopause: solution for compressible plasmas, J. Geo-phys.Res., 88, 841–852, 1983.
Rezeau, L., Morane, A., Perraut, S., Roux, A., and Schmidt, R.: Characterization of Alfvenic fluctuations in the magnetopause boundary layer, J. Geophys. Res., 94, 101–110, 1989.
Rezeau, L. and Belmont, G.: Magnetic turbulence at the topause, a key problem for understanding the solar wind/ magne-tosphere exchanges, Space Sci. Rev, 95, 427–441, 2001.
Rezeau, L., Sahraoui, F., d’Humi`eres, E., Belmont, G., Cornilleau-Wehrlin, N., Mellul, L., Lucek, E., Robert, P., D´ecr´eau, P., and Canu, P.: A case study of low-frequency waves at the magne-topause, Ann. Geophys., 19, 1463–1470, 2001.
Robert, P., Roux, A., Fontaine, D., Canu, P., Le Contel, O., Perraut S., Cornilleau-Wehrlin, N., Dunlop, M. W., Balogh, A., Glass-meier, K.-H., Bosqued, J.-M., Fazakerley, A., Behlke, R., and D´ecr´eau, P.: Cluster observations of a flux transfer event (FTE), in: Cospar, Plenary Meeting, 2002cosp.meetE2676R, 2002. Roux, A., Perraut, S., Robert, P., Morane, A., Pedersen, A.,
Ko-rth, A., Kremser, G., Aparicio, B., Rogers, D., and Pellinen, R.: Plasmasheet instability related to the westward travelling surge, J. Geophys.Res., 96, 17 697–17 714, 1991.
Russell, C. T. and Elphic, R. C.: ISEE observations of flux transfer events at the dayside magnetopause, Geophys. Res. Lett., 6, 33– 36, 1979.
Russell, C. T., Holzer, R. E., and Smith, E. J.: OGO 3 observations of ELF noise in the magnetosphere, 2, The nature of the equato-rial noise, J. Geophys. Res., 73, 755–768, 1970.
Sahraoui, F., Pinc¸on, J. L., Belmont, G., Rezeau, L., Cornilleau-Wehrlin, N., Robert, P., Mellul, L., Bosqued, J.-M., Balogh, A., Canu, P., and Chanteur, G.: ULF wave identification in the mag-netosheath: k-filtering technique applied to Cluster II data, J. Geophys. Res., 108, 1335–1352, 2003.
Sahraoui, F., Belmont, G., Pinc¸on, J.-L., Rezeau, L., Balogh, A., Robert, P., and Cornilleau-Wehrlin, N.: Magnetic turbulent spec-tra in the magnetosheath: new insights, Ann. Geophys., 22, 2283–2288, 2004.
Santol´ık, O.: Propagation Analysis of STAFF-SA Data with
Coherency Tests (A User’s Guide to PRASSADCO),
LPCE/NTS/073.D, Lab. Phys. Chimie Environ./CNRS, Orl´eans, France, 2003.
Santol´ık, O. and Parrot, M.: Propagation analysis of electromag-netic waves between the helium and proton gyro-frequencies in the low-altitude auroral zone, J. Geophys. Res., 103, 20 469– 20 480, 1998.
Santol´ık O. and Parrot, M.: Case studies on wave propagation and polarization of ELF emissions observed by Freja around the local proton gyro-frequency, J. Geophys. Res., 104, 2459–2476, 1999. Santol´ık, O., Lefeuvre, F., Parrot, M., and Rauch, J. L.: Complete wave-vector directions of electromagnetic emissions: Applica-tions to INTERBALL-2 measurements in the night-side auroral zone, J. Geophys. Res., 106, 13 191–13 201, 2001.
Santol´ık, O., Pickett, J. S., Gurnett, D. A., Maksimovic, M., and Cornilleau-Wehrlin, N.: Spatio-temporal variability and propa-gation of equatorial noise observed by Cluster, J. Geophys. Res., 107, No. A12, 1495, doi:10.1029/2001JA009159, 2002. Santol´ık, O., Macusova, E., Yearby, K., Cornilleau-Wehrlin, N., and
Alleyne, H. St. C.: Radial variation of whistler-mode chorus: first results from the STAFF instrument on board the Double Star TC-1, Ann. Geophys., 23, 2937–2942, 2005.
Sibeck, D. G. , Lopez, R. E., and Roelof, E. C.: Solar wind control of the magnetopause shape, location and motion, J. Geophys. Res., 96, 5489–5495, 1991.
Smith, E. J. and Tsurutani, B. T.: Magnetosheath lion roars, J. Geo-phys. Res., 81, 2261–2266, 1976.
Sonnerup, B. U. ¨O.: Theory of low latitude boundary layer, J. Geo-phys. Res., 85, 2017–2026, 1980.
Tsurutani, B. T., Smith, E. J., Anderson, R. R., Ogilvie, K. W., Scudder, J. D., Baker, D. N., and Bame, S. J.: Lion roars and non-oscillatory drift mirror waves in the magnetosheath, J. Geophys. Res., 87, 6060–6072, 1982.
Tsurutani, B. T., Brinca, A. L., Smith, E. J., Okida, R. T., Anderson, R. R., and Eastman, T. E.: A statistical study of ELF/VLF plasma waves at the magnetopause, J. Geophys. Res., 94, 1270–1280, 1989.
Vaivads, A., Khotyaintsev, Y., Andr´e, M., Retino, A., Buchert, S. C., Rogers, B. N., D´ecr´eau, P., Paschmann, G., and Phan, T.: Struc-ture of the magnetic reconnection diffusion region from four-spacecraft observations, Phys. Rev. Lett., 93, 105001-1–105001-4, 2004.
Walker, S. N., Sahraoui, F., Balikhin, M. A., Belmont, G., Pinc¸on, J. L., Rezeau, L., Alleyne H. St. C., Cornilleau-Wehrlin, N., and Andr´e, M.: A comparison of wave mode identification tech-niques, Ann. Geophys., 22, 3021–3032, 2004.
Woolliscroft, L. J. C., Alleyne, H. St. C., Dunford, C. M., Sumner, A., Thompson, J. A., Walker, S. N., Yearby, K. H., Buckley, A., Chapman, S., Gough, M. P., and the DWP co-investigators: The digital wave processing experiment on Cluster, Space Sci. Rev., 79, 209–231, 1997.
Yearby, K. H., Alleyne, H. St C., Cornilleau-Wehrlin, N., San-tol´ık, O., Balikhin, M. A., Walker, S. N., Fazakerley, A., and Lahiff, A.: Observations of lion roars in the magnetosheath by the STAFF/DWP experiment on the Double Star TC1 spacecraft, Ann. Geophys., 23, 2861–2866, 2005.
Zhang, Y., Matsumoto, H., and Kojima, H.: Lion roars in the mag-netosheath: The Geotail observations, J. Geophys. Res., 103, 4615–4626, 1998.