The Developmental Strategy for the Airport Projects:
A case Study of Rinku Town, Osaka, Japan by
Yoshitaka Matsuda B.S., Architecture Tokyo University, 1988
Submitted to the Department of Urban Studies and Planning and the Department of Architecture
in Partial Fulfillment of the Requirements for the Degrees of
Master in City Planning, and Master of Science in Real Estate Development at the Massachusetts Institute of Technology, December 1994
@ Yoshitaka Matsuda, 1994. All Rights Reserved
The author hereby grants to MIT permission to reproduce and to distribute publicly copies of this thesis document in whole or in part.
Signature of Author
Yoshitaka Matsuda Departet of Urban Studies and Planning, and Center for Real Estate
Certified by
Gary Hack, Professor of Urban Design Department of Urban Studies and Planning Thesis Advisor
Langley C. Keyes, Chairman, MCP Program Department of Urban Studies and Planning
Accepted by
Accepted by
W am C. Wheaton, Chairman,
MITLibraries
Document Services
Room 14-0551 77 Massachusetts Avenue Cambridge, MA 02139 Ph: 617.253.2800 Email: docs@mit.edu http://libraries.mit.edu/docsDISCLAIMER OF QUALITY
Due to the condition of the original material, there are unavoidable
flaws in this reproduction. We have made every effort possible to
provide you with the best copy available. If you are dissatisfied with
this product and find it unusable, please contact Document Services as
soon as possible.
Thank you.
Both the Library and Archives copies of this
thesis contain poor grayscale image
reprod-uctions. This is the best version available.
The Developmental Strategy for the Airport Projects: A Case Study of Rinku Town, Osaka, Japan
By
Yoshitaka Matsuda
Submitted to the Department of Urban Studies and Planning and the Department of Architecture
in Partial Fulfillment of the Requirements for the Degrees of Master in City Planning,
and Master of Science in Real Estate Development
ABSTRACT
As the topic of globalization has propounded and corporations seek after international markets, the importance of the airplane as a form of mass transit has been increasing. Proximity to a hub airport has become an important locational factor for a number of businesses, and the airport-related projects would become the core of the regional developments. The airports are expected to give economic impacts as the ignition of the regional economy, as well as to induce the demands for commercial space. Rinku Town, a new city adjacent to Kansai International Airport, Osaka, Japan, was one with such an expectation, intended to achieve the regional internationalization and improvement with its ambitious urban development plan; however, this plan has not been successful, and is currently being restructured.
This thesis examines the collapse of Rinku Town in detail in order to further explore the development strategy of the airport projects. This thesis first outlines airport projects, and provides an overview of urban developments in Japan with background information. Chapter 3 and 4 analyze Rinku Town from three aspects: economic fluctuation, physical planning, and project management. Conclusions from these analysis are also drawn. The final chapter suggests the development strategy for the future airport-related projects. The collapse of Rinku Town was not only due to the market crash and credit crunch of developers as was generally believed; it was also due to its physical planning, the planning process, and project management caused from Osaka's inexperienced leadership and traditional organization for implementing such projects in Japanese context. These problems were rooted in the structure of the Japanese central governing system. Based on these findings, developmental strategies for airport projects were drawn with key determinants including marketing, land use portfolio or optimal use combination, development schedule, and organization.
Thesis Supervisor: Gary Hack
Table of Contents
Page
1. Introduction / The Outline of Airport-Related Projects
1. 1. Introduction
1. 2. The Outline of Airport Projects 1. 3. Summary
2. Information to Better Understand Rinku Town
2. 1. Land Myth and Urban Developments
2. 2. The Outline of Japanese Urban Development Projects 2. 3. The Backgrounds of Rinku Town
3. The Outline of Rinku Town
3. 1. The Outline of Physical Planning 3. 2. History
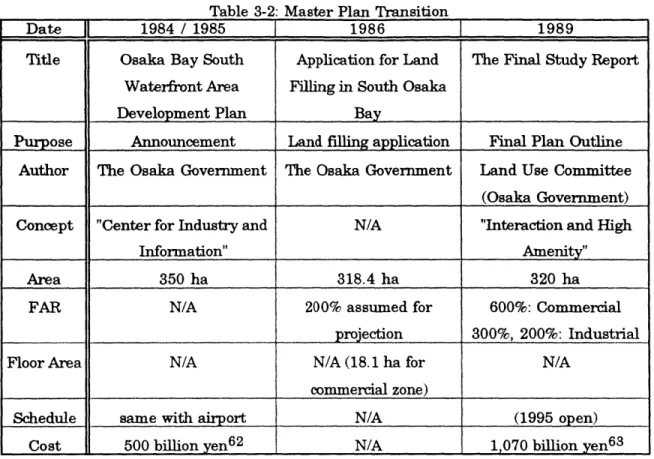
3. 3. The Outline and Transition of the Master Plans
4. Analysis of Rinku Town
4. 1. Introduction
4. 2. Summary of interviews 4. 3. Analysis of the Market Crash 4. 4. Analysis of the Physical Planning 4. 5. Analysis of the Project Management 4. 6. Conclusions of the Analysis
59 60 63 77 88 100 5. Conclusion
Introduction: What is learned from Rinku Town 102 Suggestions for Rinku Town (with Hindsight) 102 Suggestions for the Developmental Strategy of Airport Projects
Acknowledgments
This thesis was supported by many people and organization. Especially, I must be obliged to two professors at M.I.T.: Dr. Gary Hack, my thesis adviser, and Pf Shun Kanda, my thesis reader. Dr. Gary Hack guided me through a long tough way with providing insightful advises, critique, information, and cheer-ups. I must appreciate him, too, because now I can have a dear goal to become an urban planner like him in my future career. Pf. Shun Kanda assisted me from the beginning of this thesis both in the US and Japan; his early suggestion about this project and case research shaped the basis of my thesis. He also opened the door for me to the interviews in Osaka, Japan. I enjoyed visiting his friendly design atelier in Cambridge.
I am also thankful to Mr. Youichi Ohshima, an alumni of M.I.T., who suggested me the concept of this case study together with Pf. Kanda. He also provided me numerous data, advice, and critique through phone, fax, and in person. In addition, I appreciate these people in writing center at M.I.T., those who accepted my interviews, and those who provided me lots of useful information.
The person I am really obliged to most is Miss Linda Eastley. She helped me a lot in editing, revising, organizing numerous drafts, and correcting my poor English, in spite of her busy days. She shaped the final format of my thesis as a tough editor. If this thesis were to be complimented for its sophisticated organization, such a compliment would be given to her, not me. If she has a chance to visit Tokyo, I have to treat her a lot.
Now, I can graduate from M.I.T. at last without being sick. In this sense, I am thankful to my parents for giving me a sound body and their spiritual assistance.
Conversion Tables
Area and Length:
1 hectare (ha) (1 acre
= 2.47 acres
= 0.4046 ha)
1 square mile = 2.5889 square kilo meters
= 640 acre (1 km2 = 0.3863 simile) 1 square foot (sqft) (1 m2 1 mile 1 feet = 0.093 square meters (m2) = 10.75 sqft) = 1.609 kilo meters (km) = 0.3048 meter Projects ha acre Rinku Town 318 786 TokyoTeleport_ _ 448 1_07 MM21 186 460 Makuhari 438 1,082
Canary Wharf (Docklands) 2,200 5,437
Las Colinas 4,856 12,000
Disney World 11,088 27,400
Foreign Exchange Rate (Japanese yen/ US dollars):
Year yen/US$ 1985 221.09 '86 159.83 '87 138.33
'88
128.27
'89 142.82 '90 141.30 '91 133.18 '92 124.80Interbank Median Price (Monthly)
Same Scale Map
Rinku Town MM2 1
La Defense
Makuhari
1 :50,000
ls
/ CD al 1j4.. giveChapter 1. Introduction / The Outline of Airport-Related Projects 1. 1. Introduction
Recently, as globalization has propounded and corporations seek after international markets, the importance of the airplane or a form of mass transit has been increasing. Proximity to a hub airport has become an important locational factor for an increasing number of businesses. Actually, some companies have built research, engineering, and production facilities, and
regional offices adjacent to the airports.1 Some Asian countries, such as Korea,
Thailand, and Hong Kong, are planning to create their own international airports. As the ignition of the regional economy, the airports are expected to give large impacts, and people tend to believe the hypothesis that if the airports are successful, international cash-cow cities adjacent to airports, such as Las Vegas or Disney World, can be attainable. This hypothesis has not been tested, because of the young history and limited examples of airport-related projects; however, these projects would become important as the core projects of the regional developments in the future.
In September 1994, Kansai International Airport, Osaka, Japan opened, as the second major international airport in Japan. Its opening was eighteen months behind the original schedule, because of technical and political problems; the falling elevation of the reclaimed land, and the unsettled political negotiation with the fishermen. Concurrently, the Osaka Government (Osaka), the local government of this airport, planned to create a new city just next to
this airport -- a symbolic gate way city: Rinku Town. Rinku Town was intended
to stimulate not only the local cities, but also the whole Kansai area by capitalizing on the economic impacts of the airport. If it were completed, Rinku
Town would be one of the few large airport projects in the world. However, this attempt was in vain; the drastic change of the economic environment halted the project.
This thesis will analyze Rinku Town, examining the following questions, and further suggest the development strategy of the airport-related projects;
1. Why was Rinku Town unsuccessful? Was the economic fluctuation the only reason? Or are there any other reasons?
2. Are the reasons for failure unique to Rinku Town, or are they common to other airport-related projects? What were the key factors for failure? 3. What lessons can be learned from Rinku Town? What should planners
have done? What is the optimal strategy for the airport projects?
This thesis is structured into five chapters. The first chapter outlines airport-related projects. The second chapter provides background information for better understanding Rinku Town: the economic change in mid 1980s and in 1990s with its impact on real estate developments. This chapter will also show the comparative character of Rinku Town in terms of history of the urban developments in Japan. Chapter 3 and 4 will describe and analyze Rinku Town in detail, and summarize the analysis. The last chapter will conclude with the suggestions of strategy for airport-related projects.
1. 2. The Outline of Airport-Related Projects2 1. 2. 1. Definition of Airport Projects
An exact definition of airport projects does not seem to exist. This is because this type of project is still new, and is often rare. At this point, several
distinctions are possible:
1. planned projects proximal to airports,
2. planned projects, whose main access is the airplane,
3. planned projects that draw the majority of business from outside markets rather than from the local markets.
The date of completion of the airports also determines the character; two different features are observed between those projects with existing airports, and those only with plans for new airports. The first type would b e conservative and similar to suburban projects; the second type would be riskier, because it will plan to create a new airport and to develop regional areas together, even though it is still unknown how much impact the airport will have on the region and the scheduled completion is not guaranteed.
This thesis defines the airport projects, with the combination of these definitions; those projects proximal to the airports, and those that will target existing markets, as well as establish new markets outside of the cities, while expecting that the airport will produce the economic impacts and the demand for commercial spaces.
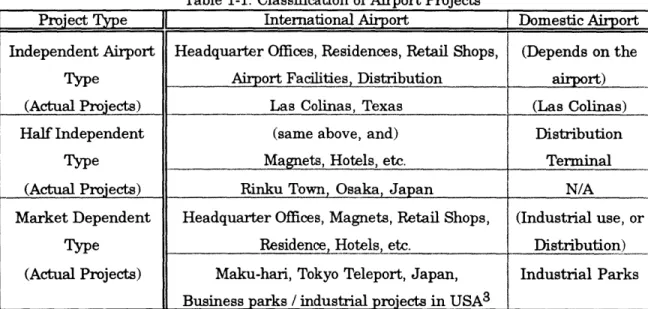
Table 1-1 shows three types of airport projects; 1) the independent airport type, 2) the half independent type, and 3) the market dependent type. The independent type does not have a strong tie with the existing market. It is economically and geographically distant from the city center, and intends to
2. Hereafter, airport related projects are abbreviated to airport projects. "Skyfront Projects"@ may be a better description of these projects.
create an independent economy. The half independent type will support the functions for the airport, and attempt to capture both the new and existing markets. The market dependent type mostly targets the existing market, even though it is located near the airport area. This type does not primarily target the new market from other cities, and in this sense, it would often be for industrial use. Rinku Town is classified into the hybrid of the market dependent and half independent type, which will support the airport function and satisfy the demands from the existing market of Osaka, while creating new markets.
Table 1-1: Classification of Airport Projects
Project Type International Airport 1 Domestic Airport Independent Airport Headquarter Offices, Residences, Retail Shops, (Depends on the
Type Airport Facilities, Distribution airport)
(Actual Projects) Las Colinas, Texas (Las Colinas)
Half Independent (same above, and) Distribution
Type Magnets, Hotels, etc. Terminal
(Actual Projects) Rinku Town, Osaka, Japan N/A
Market Dependent Headquarter Offices, Magnets, Retail Shops, (Industrial use, or Type Residence Hotels, etc. Distribution) (Actual Projects) Maku-hari, Tokyo Teleport, Japan, Industrial Parks
Business parks / industrial projects in USA3 , _I
Source: Author
1. 2. 2. Major Airport Projects
Table 1-2 shows the major projects adjacent to the airport. Only a few airport projects exist; Las Colinas, Texas, Young Jong Island, Korea, and Rinku Town, would be in this category. Adjacency to the airports does not always formulates airport projects, because of the weak connection with the airports. In this sense, most Japanese projects can not be airport projects, because of
3. For example, Centex Industrials Park (O'Hare International Airport), Dulles Business
Park (Washington-Dulles Airport), Airport Business Center (Orlando International Airport), etc.
their independence from airports. Their markets were rather domestic, and their inconvenient accessibility made them remote far from the airport: poor connection of railway and congested highways. In the US, airplane transportation as one form of a mass transit is the most advanced with various examples; being located in the suburbs, most of such projects can be categorized as either industrial or business parks.
Table 1-2: Major Urban Developments Proximal to the Aiport Examples Airport Scale Distance Access Use Makuhari, Tokyo 438 ha 35 km railroad, Business Tokyo, Japan International (30 min. highway Convention
by car) Residential
Tokyo Teleport, Haneda 448 ha 10 km highway, Business Tokyo, Japan International monorail Convention
Residential
Retail
MM21, Haneda 186 ha 18 km railroad, Business Yokohama, International (30 min. highway Residential
Japan by car) Retail
Rinku Town, Kansai 320 ha 4 km railroad Business Osaka, Japan International highway Commercial
(planig)
Las Colinas, Dallas 4,856 ha 4 km highway Business
Texas, Fortworth Residential
USA International
Mall of America, Minneapolis 39ha* 5 km highway Commercial Minneapolis, International
Minn., USA
Orlando, FL Orlando 11,088 ha 7 km highway Commercial
USA International (Resort)
Canary Wharf, London City 2,200 ha 8 km highway, Business
London, UK monorail Residential
Young Jong New Seoul 204.4 ha next to the highway, Business Island, Korea Metropolitan (3,000 ha) airport railroad Commercial
(planning) Residential
*total floor area, Source: Author
1. 2. 3. Uniqueness of Airport Projects
Because of their location with poor accessibility, airport projects show several similarities to and distinctions from waterfront projects. Waterfront projects were rooted in the port activity of the nineteen century with historic
are entirely different. Their origins are rooted in adjacent airports, which are reciprocally dependent on the growth of the city or often the nation. Airports have been created rather recently and have been functioning as terminal stations alone, where people and cargo simply pass through; thus, airport projects have little historical basis. The location of the airports and airport projects depends on the political situation. The place with the weakest political opposition and strongest cooperation from the local economy will be chosen; for example, in the US, the airports are typically located about 20~30 miles away from the city center, either in the suburbs or on the waterfront. The airports in Asian countries tend to have their sites on the waterfront or on islands, reflecting their lack of land. Necessary locational conditions are; 1) easy land assembly, 2) low land cost (purchase or creation), and 3) a potential for mass
transit between the airport and the project.4 Lack of these conditions will often
terminate the projects; the difficulty of land assembly caused the cancellation
of one airport project in Japan.5
The optimal size and scale of the airport projects are dependent upon individual location and the features. Such projects should at least prepare for future expansion, for the additional demand when the airport will reach its
maximum capacity;6 otherwise, they will be less competitive, being unable to
provide the sufficient facilities to invite more markets. Table 1-3 shows the deference of these project types.
Airport projects have specific problems. If an airport project is isolated from major cities, the problem of accessibility becomes primary: while the transportation to, from, and throughout the airport project must be completed first, it is very costly. Second, an airport project located adjacent to cities and 4. For example, railway systems in Japan, and the highways in US.
5. A theme park project, named Narita Japan Village, canceled in 1992.
6. For example, the Kansai International Airport takes seven years, according to the
communities exposes adjacent areas to noise pollution. Noise pollution usually causes strong opposition from the current residents, and turns out to become a political issue, again making land assembly difficult. Third, there exist complex governmental jurisdictions in the airport; it is usually under the jurisdiction of
several competing authorities in the central government.7 This political
complexity will produce internal bureaucratic problems, which the local governments and private sectors have to deal with, and which will often cause a delay of the schedule.
Table 1-3: Comparson of Airport / Waterfront Projects
Criteria Airport Projects
I
Waterfront ProjectsLocation Far from existing markets Proximal to existing market
Origi Recent (20th Century) 19th century
Scale Huge Various (Smaller)
Market None Exist
Use in the past Nothi Port Activity
Problems Far, Noise Pollution, Mass Transit Many regulations, Slum clearance, (to the airport and city center) Accessibility,
Source: Urban Land Institute, Author
However, some advantages do exist; (1) unlike the inner cities, unique planning should be possible without the oppositions from residents and the political restrictions, (2) the financial risk is controllable by adjusting the supply of commercial spaces, (3) these projects can contribute to the local area by creating jobs, inviting corporations, and increasing taxes, (4) such projects have potential for changing the character of the region to become international with the successful magnets that would become the catalysts for attracting the markets from all over the world. This potential of airport projects is the most unique distinction from other projects. Disney World,
7. Ministry of transportation, construction, commerce and trade, finance, self-government,
Orlando, FL, may be a good example; it has been very successful with inviting huge markets from all over the world, using air. Table 1-4 shows the advantages and weaknesses of the airport projects.
Table 1-4: Advantages and Weaknesses of Airport Projects
Advantages Weaknesses
Freedom in Physical Planning Poor Accessibility Control of the Supply Demand Markets Noise Pollution
World Wide Markets for Magnets Land Assembly
Contribution to the Region Complex Jurisdiction
Source: Author
1. 3. Summary
In this chapter, the outline of the airport projects has been discussed. This gives some insight / information for a better understanding of the case study of Rinku Town. The next chapter will discuss the background information of Rinku Town.
Chapter 2. Information to Better Understand Rinku Town 2. 1. Land Myth and Urban Development
2. 1. 1. Land Myth
In April 1990, in order to halt overly intense land speculation, the chief competent authority of the Japanese economy, the Ministry of Finance, suddenly ordered a restriction on loans; it prohibited the financial institutions from providing more capital to the real estate industries than in the prior year, and also restricted life insurance companies from investing in real estate
equities.8 Chart 2-A shows the impact of this financial policy and the surges of
capital into land speculation. During the bubble periods, loans for developers increased five times faster than the increase of the total loan amount, and this capital was poured into land speculation; the increase of land price index was closely proportional to the increase in loans for developers from 1983~1987.9 However, after this policy, the situation changed drastically; the annual increase of loans for developers became zero in 1991, which would lead the
developers running out of cash and eventually going into bankruptcy.10 This
financial policy caused the credit crunch of the industry, and made it impossible to continue the projects; these projects lost their main actors that would finance and organize them. It became more than a mere restriction, a violent poison to the Japanese economy, making the overheated economy cool down rapidly, and triggered the halt of real estate projects.
8. Actually, its attempt was to prevent life insurance companies from heavily investing on
real estate in their total portfolio. Therefore, maximum increase for investing real estate (%) was advised to be no more than the increase of total asset (%).
9. In 1987, another regulation: a surveillance of land price, was ordered, and ceased land speculation to some extent. Developers must get approval of the land price from the local government, before they make agreement of sale of land.
10. For example, the first half of 1991 showed the worst record of total bankruptcy: 5,244
Chart 2-A: Loan Amount & Land Price
- --- Increase (%) of loan for --- -- ---developers - --- Increase (%) of total loan amount --- c-s--- --- ---- --- ---+---Increase (% of land price index - --- -1980 1981 1982 1983 1984 1985 1986 1987 -10 ---Bn p ' --- - -E--- -Sai
Source: Bank of Japan 'Monthly Report of Economic Statistics'
1988 1989 1990
- - -- -- - -- --
--Chart 2-B: Land Price and Rent
o - c' co e u-a O
e-Co Co Co Co Co Co Co Co
Year Source: National Land Agency,
60.0 50.0 40.0 30.0 20.0 10.0 0.0 - ,"w-M -10.0
and Nihon Building Kyokai
60 60 40 30 20 1991 70 60 50 40 30 20 10 0
Land Price Index Rent Index
-U--- Increase of Land Index
Concurrently, the Tokyo stock market fell suddenly on October 1, 1990:
Black Monday in Japan.11 This crash dropped stock down to 48% less than its
highest point, and was the worst decrease ever recorded in Tokyo market. Since then, the Japanese economy entered a long recession. It is estimated
that 270 trillion yen of unrealized gain ($1.89 trillion)12 had disappeared just a
single day.13 The new biggest problem for Japanese corporation was the
unavailability of their equity finance; the crash made it impossible to raise capital by issuing new stocks or convertible bonds, which was the major financing method in the bubble period. These companies could not enjoy low cost finance any more, and need to find other financing methods. Moreover, they were in need of cash to settle their current debts financed in the past; they had expected that they would be able to refinance new capital to repay these debts. Therefore, this crash forced almost all corporations to restructure urgently; one way of their restructuring was to shrink the leasing spaces, making the demands of office spaces smaller than any periods ever.
Until the crash, development for office use was believed to be the safest and most profitable, backed by the strong tenant market; demands for the office spaces were tight, and the rent was higher than other use. However, this crash made the tenant market loose, and the vacancy rate jumped to 4.6% in 1992.14 Table 2-1 shows the change of markets before the crash; all of these data show the negative impact by the crash. The gap between the oversupply and shrinking demand pushed the rent downwards, and resulted in the lower profitability of real estate projects, discouraging the developers to invest.
11. The crash pushed the Tokyo Price Index down to 20,881.86 yen from 38,915 yen.
12. The difference between the market value and the purchased price.
13. Miyazaki, Yoshikazu, 'Fukugo Fukyo', 1992
Table 2-1: The Change of the Tenants Markets
Criteria Peak 1993
Vacancy of Tokyo Area 0.6% (1990. 5) 7.0% (1993. 3) Rent in Tokyo Area (yen/m2/month)15 17,393 (1992) 15,480 (1993) Total Floor Area Started Construction (ha) 907 (1990) 686 (1992)
From: IDSS, Mitsui Real Estate, Ministry of Construction
The depression in 1990s caused the halt of real estate projects in two ways; 1) the governmental restriction triggered the credit crunch of the developers, which resulted in the suspension of the projects, 2) the crash urged all companies to restructure, resulting in the oversupply and squeezing demand for office spaces. This falling market deteriorated the revenue of developers, and further discouraged them to invest.
Before this crash, so called "land myth" had been alive in Japan. People believed the appreciation of land price in a long run, although it may fluctuate in the short run. Chart 2-B shows the impact by land myth; the increase of the land index was almost double the increase of rent index. That is, holding land was a better investment method than developing and leasing the land. Thus, everybody rushed to purchase pieces of land for investment, especially in the Tokyo area, resulting in the continuous increase of land price.
Low interest rates,16 surplus of money, and strong demand for office
space,17 were the key factors that supported this land speculation. The surplus
of money financed with low cost poured into the land market, resulting in the
skyrocketing of land price.18 In addition to the economic environment, the tax
15. In Japan, rent is shown by yen per square meters per month traditionally. Hereafter, it is shown as yen/m2/month.
16. Long term prime interest rate, the standard interest rate in Japan, was 4.9%-6.9%
during 1986-1989, which showed the lowest ever.
17. Average increase of 10.0% during this period: the Nihon Building Kyokai Research.
Average vacancy rate during this period from 1985-1991 was 1.5%: IDSS Data Research.
18. The land index in Tokyo and the Osaka area had been increasing, especially, after 1985,
this speed accelerated. The average rate increase was 6.0-6.5% in 1980-1985, and 21.3-24.4% in 1986-1990 per annum, the National Land Agency 'Official Land Price'.
system encouraged this myth. Relatively low taxes on properties, less than 1%
of market value,19 enabled landowners to keep their land under-developed, and
they could finally enjoy capital gain without any risk; landowners didn't have to hurry for their development, but had better wait until land would appreciate.
Nonetheless, land myth wasn't always bad for the Japanese economy; it has been the basis of Japanese corporate financing, called the "land standard system". Land myth was especially favorable for those companies that owned land from long ago with low book value, and enabled them to develop their land by themselves. The typical Japanese corporate financing using land had three possibilities:
1. A company can offer its land as security for a loan; if a company owns land,
financial institutions would usually lend 60%~70% of the market value.20
However, during this period, they would lend more than 70% by expecting the appreciation of land value, taking risks to lend more money in order to expand their business ground.
2. A company could realize capital gain by its sale of land. The sale for the market price would enable such a company to enjoy huge capital gain,
because of the low book value and the substantially higher market price.21
3. A company could equity finance from then capital market; they could raise money easily by issuing new stocks, backed by high stock prices. Land was not used for realizing capital gain, however, it was regarded as a prospective asset on the balance sheet, which would produce huge gain. The Japanese stock prices reflected this unrealized value at that time. One phenomenon
The US appreciated constantly during two decades (average 9.9%), Japan increased
drastically after 1985 (average 13.2%), and total value of Japan was $14,846 billion, which is four times more than in the USA; $3,856 billion. (US dollars in 1989)
19. Property tax was 1.7% of the taxable value of land estimated by the local governments,
about 30%~40% of the actual market value, and then the effective property tax rate, was less than 1% of market value (0.51%-0.68%).
20. Nihon Keizai Shinbun-sha, 'Seminar Gendai Kigyo Nyumon', 1992
in late 1980s' represented this land myth; when waterfront developments were first introduced and actual plans were presented, the stock prices of
the industries, which owned lands in the waterfront area,2 2 jumped
suddenly, even though their main business had been declining. That's because, they had a large amount of land in the waterfront area in Tokyo, and that the investors overestimated future potential of their land, not their businesses.
Land myth also helped the landowner companies to start developments of their land; for example, heavy industry manufactures attempted to develop their old factory sites in the waterfront area, in order to realize the maximum use of their land instead of selling them, although sale for unnecessary sites was the traditional strategy of the asset disposal for such industries. Chain hotels and chain department stores also sought after the possibility to enjoy capital gain by acquiring their properties, even though their traditional strategy was to be less capital intensive and to concentrate on their major businesses; it was to borrow the spaces in order to use their capital more into the service operation or expansion of their businesses instead. Their change of
strategy for taking risks to enter into the real estate developments might accelerate the skyrocketing land price.
Overall, the financing system based on land myth worked very well in the Japanese economy, and gave the landowner companies the opportunity to become developers; however, the crash terminated this system, and forced the Japanese corporation restructure, afterwards.
2. 1. 2. Impacts on the Urban Developments
This crash, called "the breakdown of the bubble economy",23 destroyed
land myth, and real estate investment turned out from a risk free to be a risky investment vehicle. In addition, the crash transformed the typology of the developments; a single office use couldn't be the best investment any more. Developers had to change their strategy for their projects, the traditional method of developing and leasing office spaces while waiting for the capital gain, became outmoded, especially for large scale projects. They must differentiate their projects from competitors by utilizing their land more effectively and inducing synergy effects by creating something attractive with other facilities for different use, otherwise they will have to confront with the crisis of projects. They must also reorganize their investment structure; to shift from volatile capital gain to the stable cash flow became important, even though they once had put more importance on capital gain. For developers and the Japanese economy, it is a revolutionary idea to seek after stable cash inflow more than to expect the capital gain; they were facing with the paradigm shift, the transition from a balance sheet to an income statement economy, or from the land for speculation to the land for effective use.
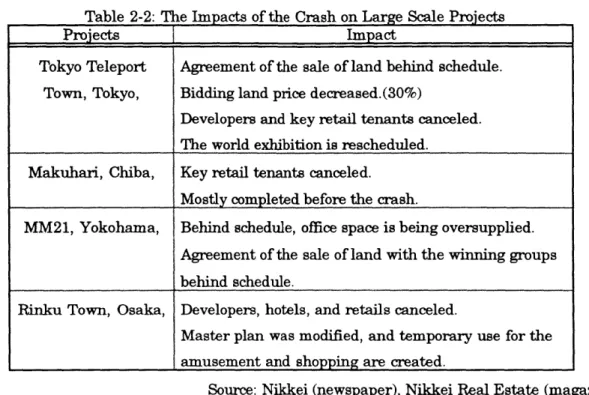
Table 2-2 shows the impacts of this crash of large scale projects. During this period, most projects were halted, and all parties have been restructuring their projects. Rinku Town was no exception; developers are negotiating with the Osaka government about their cancellation. Its original plan was modified, and Osaka decided to use the sites temporary for the amusement and retail. The impacts from the crash are observed from these projects, and their restructure seemingly took time.
23. "Bubble" describes the Japanese economy as a fragile entity which can disappear easily
as it lacks strong economical fundamentals such as interest rate, GNP (gross national product), inflation, and inventories.
Table 2-2: The Impacts of the Crash on Large Scale Projects
Projects Impact
Tokyo Teleport Agreement of the sale of land behind schedule. Town, Tokyo, Bidding land price decreased.(30%)
Developers and key retail tenants canceled. The world exhibition is rescheduled.
Makuhari, Chiba, Key retail tenants canceled.
Mostly completed before the crash.
MM21, Yokohama, Behind schedule, office space is being oversupplied. Agreement of the sale of land with the winning groups
behind schedule.
Rinku Town, Osaka, Developers, hotels, and retails canceled.
Master plan was modified, and temporary use for the I amusement and shopping are created.
Source: Nikkei (newspaper), Nikkei Real Estate (magazine)
2. 2. The Outline of Japanese Urban Development Projects
Table 2-3 shows the chronological overview of development typology: Sub Center, Supplemental Development, and Unit Development; classified by scale, use, and location, shown in Table 2-4.24
Table 2-4: Typology of Developments
Typology Area (ha) Use Location (km)
Sub Center 30ha- mixed, complex, suburbs (about 30km from the city center) or waterfront
Supplemental 110 ha office, and retail, or within 20km from city centers
Development _ _ hotel,
Unit Development -2 ha mostly office I downtown
Source: Author
As advanced technology was introduced and legal modification was in force, in almost every decade, the typology evolved from single to complex or to subcenter from 1960s to 1990s. The comparative characteristics is observed in these periods; the transitions from the horizontal to vertical use in the first
Table 2-3 : Maor Events of Urban Developments in Japan
Periods ~_1980 1981 ~ 1990 1991 - 1995
Character from Low Rise to Skyscrapers from Single Use to Mixed Use Larger Scale and More Complex Use,
Sub Center '65 Tama New Town Port Island (436 ha) MM21, Makuhari, Tokyo Teleport,
Rinku Town,
Supplemental '74- Shinjuku Area Skyscrapers '86 Ark Hills (Mixed Use Buildings) '93 Osaka Business Park (Osaka)
Development '88 Omiya Sonic City
(First Public Private Partnership)
Unit '68 Kasumi-Ga-Seki Building '91 Landmark Tower (MM21)
Development (first skyscraper in Japan) '91 World Business Garden (Makuhari)
Major Event '63 FAR was introduced. '85 Exhibition in Tsukuba '91 Tokyo Government Office Open
'68 Urban Planning Law enacted. '86 PPP law enacted.
'70 World Exhibition in Osaka '87 Land Dealing law enacted
'90.4.-'91.12. Restriction of Loans (*site area)
Economic '64 Tokyo Olympic '87.10. Black Monday (NY market) Makuhari: 438 ha*
Change '73 Oil Shock '87- '88 Lowest Interest Rate MM21: 186 ha*
'89.12. Tokyo Stock Market Highest Tokyo Teleport : 448 ha*
_'90.10. Tokyo Crash Rinku Town: 318 ha*
References Tama New Town: 7,000 ha* Ark Hills: 280,372 m2 OBP: 510,269 m2
Kasumi-Ga-Seki: 165,692 m2 Omiya Sonic City: 131,256 m2 Landmark: 392,284 m2
Shinjuku Mitsui: 179,956 m2 WBG: 228,728 m2
Sumitomo: 177,467 m2 Tokyo Gov. Office: 380,503 m2
decades (1960s~1980s), and those from the single use to complex use in the last decades (1980s~1990s).
2. 2. 1. 1960s to 1980s
During the first half of 1960s, all Japan enjoyed prosperous days, and most cities, including Tokyo and Osaka, were growing. In 1963, the
Architectural Standard Law deleted the height limitation,25 and introduced
Floor Area Ratio (FAR) to Japan for the first time, with the support of the advanced structural technology for the earthquakes. This modification released developers from the horizontal use, and provided the opportunity for the vertical use. After this modification, high-rise buildings became popular, and the new era of skyscrapers arrived. In 1968, the first skyscraper,
"Kasumi-Ga-Seki Building" was completed,2 6 and from 1970s to 1980s, the skyscrapers in
the Shinjuku area were completed one by one. Stimulated by the peers, developers, corporations, and the local governments were eager to create single high rise buildings that could become their prestigious symbols. In this way,
skyscrapers gained popularity for office buildings in 1970s~1980s.27
The first period from 1960s to 1980s is described as the transitional stage from horizontal use to vertical use; low-rise buildings in small parcels to high-rise skyscrapers in large sites.
2. 2. 2. 1980s~1990s
The transition during this decade is well characterized by the economic prosperity from the mid 1980s. There was the ups and downs of the economic
25. Maximum height used to be 31 meters
26. 165,692 square meters (m2), 36 Floors, owned by Mitsui Real Estate
27. During this period, there existed another form of large scale development: the New Town
projects, sometimes described "bedroom communities". New Towns were about 1 hour from the city centers, and became the typical suburban housing in Japan. Tama New Town in the east suburb of Tokyo, provides housing for 300,000 residents in a 7,000 ha area.
cycles with the surge into real estate and the market crash, when non-professional bodies rushed to real estate investment.
A legal factor also stimulated the boom as strongly as the economic factors did. In 1986, a law of public-private partnership was enacted, and joint venture by the public and private sectors was officially approved. Thereafter, both sectors could develop the public land, while pursuing common profit. Before the enactment, the public sectors could not participate in the project, and they had to wait until the developers were selected by the official selection (bidding) and started the project. Several proposal bidding were held by the local governments; the first was in 1986 in suburb of Tokyo. In this selection, only the winners were granted the exclusive right to develop the sites. In such joint ventures, the roles and the responsibility of each party were clearly separated; roles of the public sectors were planning, management, and construction of infrastructures, and those of the private sectors were development and operation of the properties. In the beginning, the introduction of public private partnership seemed promising, and most of the large scale projects in Japan are planned in this scheme, shown in Table 2-5.
These projects have several characters in common: a) all public private partnership, b) formerly under-developed or reclaimed land, c) large scale (more than 100 ha), d) proximity to the major cities, e) poor accessibility, f) publicly
owned land, and g) complex uses.2 8 These characters indicate the limitations of
urban developments in Japan; there is no large developable land left except public reclaimed land, and large scale projects are achievable only on such land, providing the potential to the regional economy.
28. (f) is the most important point in Japan. If the site isn't owned 100% publicly, it will
often take many years to get agreements from former landowners, because the owners' property right is well protected legally, and the government can't force landowners to give up their property, even though the government may offer proper compensation.
Table 2-5: Major Large Scale Projects in Japan
Criteria Land / Scale (ha) Distance Accessibility Use
Owner J I I _
Tokyo reclaimed highway, Business
Teleport 100% public 448 ha 6 km monorail Commercial
Tokyo, railroad Convention
MM21 reclaimed 30 km* railroad, Business
Yokohama, private, and 186 ha 2 km** highway Commercial
public, Convention
Makuhari, reclaimed 30 km* railroad, Business
Chiba, 100% public 438 ha 8 km*** highway Convention
Rokko reclaimed 20 km**** highway, Residential
Island, Kobe 100% public 580 ha 7 km***** monorail Business
Port Island, reclaimed 25 km**** highway, Residential
Kobe 100% public 436 ha (I) 5 km***** monorail Business
390 ha (II)
Rinku Town, reclaimed 40 km**** railroad Business
Osaka 100% public 320 ha Commercial
*from Tokyo, **from Yokohama, ***from Chiba, ****from Osaka, *****frm Kobe, Source: various
As the scale of projects became larger, the single use, such as office use alone in a skyscraper, could not satisfy the demands of the era; the developers were forced to create something new. In order to satisfy the various demands, and to coexist with the surrounding area, they diversified the uses from the horizontal single office use to the vertical complexes: mixed uses with offices, retail shops, residences, hotels, cultural facilities, and amenities of greenery
and open spaces. They expected the synergy effect -- the interactions caused
from several different uses. Even in a single skyscraper, developers attempted to use it with several uses in order to enhance its competitiveness. Rinku Town was planned along this trend.
The second period is described as the physical transitional stage from the horizontal single use to the vertical mixed use. There also existed the economic transitional stage from the expansion to restructure. In addition, the
organizational transition from the individual developers to the public private partnership was observed.
2.3. The Backgrounds of Rinku Town
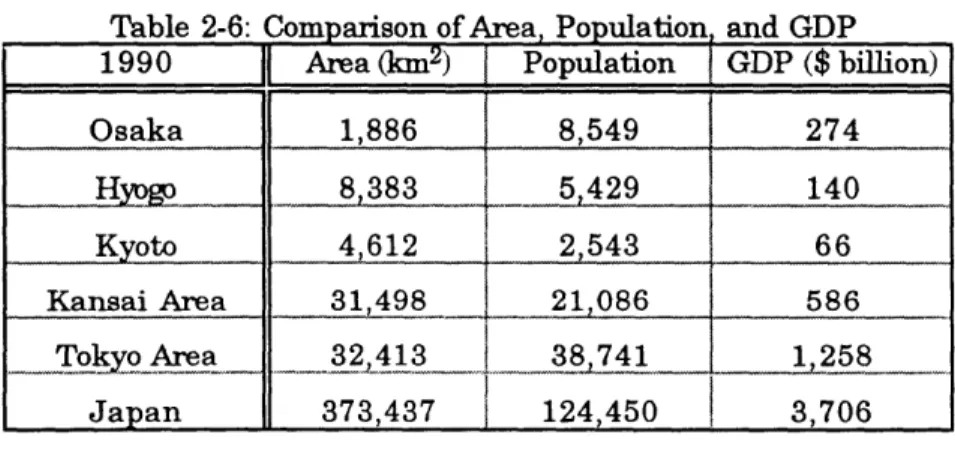
This section is to provide information for better understanding of Rinku Town; the Kansai area (Kansai) or Osaka, and Kansai International Airport. The Kansai area is located in the western part of Japan, 400 km away from Tokyo with the central city of Osaka: the second largest city in Japan. Osaka has its population of 8.5 million out of 21.1 million in the Kansai area, and with Gross Domestic Products (GDP) of $274 billion out of $586 billion.29
2. 3. 1. The Kansai Area (Osaka metropolitan Area)
i) History
Kansai means "the western part of the border", the western part of the former capital, Kyoto. This area has been prosperous since the 700s, when the first capital was set in this area. It was always the center of both politics and culture, before the capital was moved to Edo (Tokyo) in the 1600s. Kyoto and Nara became the centers of politics and culture in the 700s, as the capital cities. The Kansai area prospered as a supplemental city near the capital, especially in the areas of commerce and trading, and Osaka became the center since the 1700s. Even after the capital was moved to Tokyo, Kansai remained prosperous due to its businesses. After World War II, as Tokyo became heavily concentrated, Osaka became the second city as well as the center of the western Japan.
ii) Government system
Nowadays, the Kansai area is composed of seven prefectural units with
the total area of 31,492 km2 (7.8 million acre), and the population in 1991 of
20,981 thousand people; 17.0% of Japan. Table 2-6 shows the population, total area, and GDP of this area in 1990.
Table 2-6: Comparison of Area, Population and GDP 1990 Area (km2) Population GDP ($ billion)
Osaka 1,886 8,549 274 H ~yo_ 8,383 5 429 140 Kyoto 4,612 2,543 66 Kansai Area 31,498 21,086 586 TokyoArea 32,413 38j41 1,258 Japan 373,437 124,450 3,706
Source: Toshi Data Pack Table 2-7: Comparison of Area, Population, and GDP
1990 Area (km2) Population GDP ($ billion)
USA __ 9_,1 j 24710 __5950
Germany_- 352,768 81,100 1,643
UK 241,272 58,000 916
Canada 9,976,186 28,100 522
Source: Toshi Data Pack, Information Almanac 1994
iii) Economy
GDP in 1990 was $586 billion (17.9% of Japan),3 0 the second after the
Tokyo area. Within the Kansai area, Osaka dominates it with 45% of total GDP shares, the second after Tokyo, too. However, domestically, the share of Kansai in GDP has been decreasing, (from 20.1% in 1970 to 17.4% in 1987) and is estimated to fall to 14.1% in 2000.31 Especially, manufacturing has declined. Kansai was successful with heavy industries in the 1960s~1970s,
30. 67,113.9 billion yen, National Land Agency, 'Annual Report of Each Prefecture' 31. Kansai Sangyo Kasseika Center 'Kansai Renaissance' 1991
however unsuccessful with inviting growing industries, such as computer and service industries; it was also poor with internationalization. Therefore, it has been turning to a manufacturing base, not a managerial headquarters.
Table 2-7 shows the international comparisons of GDP between the Kansai area and foreign countries. It shows the scale of the Kansai economy:
as large as a Group of Seven (G7) country,32 almost equal to Canada's $521.5
billion.33
iv) Development Projects
To activate its domestic economy by seeking after internationalization, Kansai is heavily investing in urban development projects. In 1990, it had
$201.70 billion3 4 with 450 budgeted projects.35 Chart 2-C shows the increase of
these development projects in this area; it indicates an extraordinary rush from 1989 to 1990, when the economy reached its peak. Table 2-8 below shows six major projects with more than 1 trillion yen budget.
Among these projects, Kansai International Airport has a vital role, because the ripple projects related to the airport were summed into $57 billion (26.7% of total): out of $57 billion, $34 billion are for the airport infrastructure projects, facility buildings, and access highways, and $23 billion are for the
airport-related projects, urban developments, including Rinku Town.3 6
These projects have unique distinctions; (1) most projects are for business and leisure uses, not for industrial use, suggesting that the industrial production would drop in the future. Moreover, those leisure projects are not
32. USA, UK, Germany, France, Italy, Canada, and Japan 33. Houghton Mifflin 'The 1994 Information Please Almanac'
34. Projects are defined as those projects that use more than 1 ha site and cost of 1 billion yen, excluding land cost. Budgeted projects are those whose total cost are estimated, and disclosed publicly. These definitions are done by Kansai Sangyo Kasseika Center.
35. 28,500 billion yen, Kansai Sangyo Kassei-ka Center 'Kansai Renaissance', 1991 36. Kansai Sangyo Kasseika Center, 'Kansai Renaissance', 1991
always promising because of many competing projects, (2) $19 billion are for research and development business uses, (3) 41% are planned under public private partnership, and (4) 70% are located in the Osaka metropolitan area or near major cities, especially, $86 billion (or 42%) are in the waterfront in the Osaka Bay, including Rinku Town.
Table 2-8: Six Major Projects in the Kansai Area ($ billion)
Name Budget Outline
Osaka Techno Port $15.6 775 ha / 200,000 workers,
R&D, international trading, information & communication business
Rokko Island $8.8 558 ha / Office, Residences, Theme park etc. International Cultural Park City $7.1 740 ha / residences & research center
Akashi Channel Bridge $7.1 The longest bridge in the world (3910 m)
Hanshin Bay Express Highway $8.6
Kansai International Airport $10.6 Opened September, 1994
Airport related projects $57 billion.
Source: Toyo Keizai
Chart 2-C: Increase of Projects and Costs in the Kansai area
r-4 N CO
4 r-4 r- -4
year Source: Kansai 450 400 350 300 250 200 150 100 50 0
San-gyo Kassei-ka Center
1000 900 800 700 600 500 400 300 200 100 0 Total Projects Budgeted projects Amount ELM
2. 3. 2. Kansai International Airport
Kansai International Airport is positioned as the core project in the Kansai economy, and Rinku Town was one of its related projects. To know the outline of this airport would be helpful for its understanding.
i) History
The origin of Kansai International Airport is traced back to the report from the United Nations. In 1962, Earnest Wiseman, the vice president of Social Council of United Nations, pointed out the necessity for a new airport to support the existing airport, because it was too small to satisfy future demand. He also pointed out that the Kansai economy and local government should make every effort to invite international airlines in order to connect the Kansai area with abroad by the direct flights. Wiseman's proposal became the origin of this airport. Concurrently, the surrounding eight local cities required urgent completion of a new airport, because in 1964, jet airplanes were approved to use this airport, causing tremendous noise pollution in the surrounding area. These cities were cooperative forming a political pressure to urge the Osaka government (Osaka) to create a new airport. It took almost 10 years to have the final decision in 1974 to select the current area for this airport.
In 1981, the Ministry of Transport, the central government presented the three basic guidelines: planning, environmental assessment, and regional developments, which became principal rules for this airport. Then, based on
such guidelines, Osaka created a proposal for regional development, which presented the idea of the waterfront city for the first time, as a supplemental development for the airport. The original land use of this development was for airport-related uses: hotel, convention, international market place, exhibition,
and for those facilities that would enhance living standard for people in the surrounding area.
Even though New Tokyo International Airport (Narita) opened in 1978, it became overcrowded before long, and couldn't cope with the increasing demands from both the passengers and foreign countries to have direct airline accesses. Demand for an additional airport was growing stronger. In 1979, because of the deficit, this airport was decided to be completed by five phases, and the first goal was to construct a smaller portion (600 ha) with one runway.
In 1984, the Law for Kansai International Airport was legislated by the Diet, determining that this airport would be operated by a corporation, which the country financed 66.7% (in 1984) and the local government and private sectors must invest 16.7%, respectively. In 1987, reclaiming was started, and design competition for the terminal building was held, in which an Italian architect Renzo Piano won the first prize. In 1991, the construction of the terminal building was started, and the airport was open on September 4, 1994, 18 months later from its original schedule.
ii) Outline
Table 2-9 shows detail data of this airport.
Table 2-9: Physical Planning of Kansai International Airport Location Reclaimed land, 40 km south from the center of downtown Osaka
Access Railway (40 min.), Highway (50 min.) from downtown Osaka Operation Kansai Kokusai Kuko Corporation
Site Area 511 ha
Floor Area 296,000 m2 (terminal building)
Capacity 1 Runway, maximum 25 million passengers / year
(international; 12 million, domestic 13 million) Cost 1,430 Billion Japanese Yen
Schedule Opened on September, 1994
iii) Operation and management
Kansai International Airport Corporation was established in 1984 for the purpose of constructing, operating, and managing the new airport. It was jointly financed by the country, local governments, and the local economy; its
capital of 510 billion yen was raised with the ratio of 4:1:1, respectively, used for 30% of the initial construction cost. The remaining 70% (about 840 billion yen) would be financed from Japan Development Bank, and by issuing bonds.
iv) Cost and finance
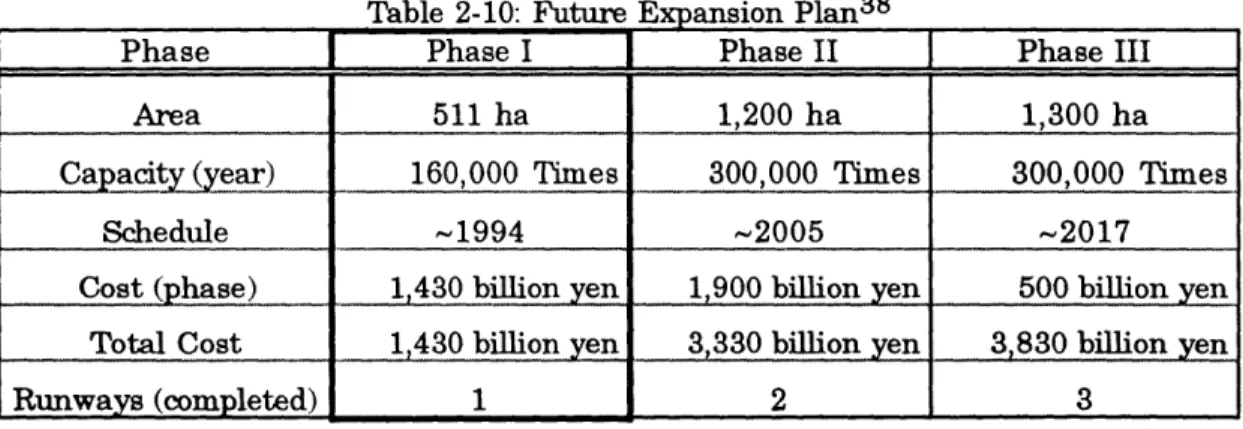
The original cost in 1984 was 1,000 billion yen, which was increased to
1,430 billion yen later in 1990 ($10.69 billion).37 (please refer to Table 2-10)
That was because: 1) the elevation of the filled land was still falling down, and delayed the construction schedule, compounding the interest expense, 2) the terminal building was expanded, and 3) the Aero Plaza, a shopping center with a hotel in the terminal, was newly added to the original plan.
Table 2-10: Future Expansion Plan38
Phase Phase I Phase II Phase III
Area 511 ha 1,200 ha 1,300 ha
Capacity (year) 160,000 Times 300,000 Times 300,000 Times
Schedule -1994 -2005 -2017
Cost (phase) 1,430 billion yen 1,900 billion yen 500 billion yen
Total Cost 1,430 billion yen 3,330 billion yen 3,830 billion yen
Runways (completed) 1 2 3
Source: Kansai International Airport Corporation
As for profitability, this airport project would need long years to cover the initial cost, and at least $24 billion extra capital is necessary to complete the expansion with an additional runway and buildings. It needs 30~35 years to
37. Nikkan Shobo, 'Kansai Shin Kuko', 1993
be profitable annually, and 45-50 years (or 60-65 years in a worst case) to pay off all cumulated loss from 1990,39 with the whole completion date in 2017.
vi) Economic Impact on Kansai area (Table 2-11)
There is a simulation study of economic impacts on the Kansai area by
the airport,40 noting that: a) the investment impact from construction of this
airport would be 2,500 billion yen, b) the economic impact caused by the consumption of airport passengers would be 460 billion yen, c) the increase of the employment in Kansai area would be 33,000 jobs, and d) the impact from the increase of cargo transportation, which would stimulate the production in
this area, would be 1,884 billion yen.41
Table 2-11: Economic Impacts from the Airport
Economic impacts Effect
Investment impact of construction 2,500 billion yen
Consumption of passengers 460 billion yen Increase of the Cargo transportation 1,884 billion yen
Employment 33,000 jobs
Source: Kansai International Airport Corporation
vii) Comparison
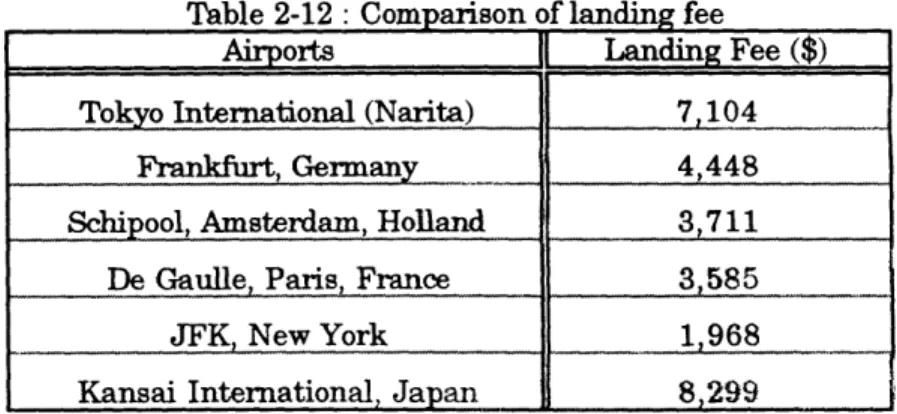
This airport will have the largest cargo transportation, with the most expensive landing fee shown in Table 2-12.42 If compared with existing airports, this airport would be one of the busiest with the highest landing fee for a flight:
$8,299 for B747- 300 (372 ton) and $4,192 for DC10- 40 (252 ton), which exceeds Narita that has been notorious for its highest fee. If compared by the congestion of passengers or cargo; passengers or cargo carried in one flight, this
39. Kansai Kuko Chosa-Kai, 'Kansai Kokusai Kuko Guide Book', 1994
40. Sumitomo Trust Bank Research Institute 'infii', 1994, number 4, volume 3 41. All numbers here are valued in 1985.
airport shows the heaviest densities with the average of 89.24 person/ flight, and 2.24 meter*ton/flight. It will be the busiest and the most congested airport in the world, similar to the Tokyo International Airport. (Refer to Table 2-13)
Table 2-12: Comparison of landing fee
Airports Landing Fee ($)
Tokyo International (Narita) 7,104
Frankfurt, Germany 4,448
Schipool, Amsterdam, Holland 3,711
De Gaulle, Paris, France 3,585
JFK, New York 1,968
Kansai International, Japan 8,299
Source: Kansai International Airport Guide Book
viii) Summary
These data show the expectation of this airport from the Kansai economy, as well as its problematic planning, finance structure, and invitation of airlines. If the planning and construction of the airport could be managed successfully, it would enable the Kansai area to expand the markets internationally by inviting the direct airlines worldwide. This expansion would contribute to the success of the airport in turn, and to the prosperity of the region, including Rinku Town. In this sense, Rinku Town was disadvantageous for its actualization from the beginning.
Table 2-13 International Comparisons of the airports
Source: ACI DATA 1992, Kansai Kokusai Kuko Guide Book 1994
Airport City Area (ha) Passenger Cargo Flight
1 O' hare Chicago 2,835 64,441,087 1,115,116 841,013 2 Dallas/Fortworth Dallas 7,082 51,943,567 577,318 764,242
3 Los Angeles Int'l Los Angeles 46,964,555 1,238,198 680,489
4 Heathrow London 1,141 45,234,993 834,916 406,433
5 Haneda Tokyo 586 42,638,852 489,743 191,750 6 Atlanta Atlanta 42,032,988 649,294 621,365 7 San Francisco San Francisco 31,789,021 602,741 409,352
8 Denver Denver 30,877,180 327,264 503,546 9 Frankfurt Frankfurt 1,700 30,746,463 1,339,802 340,468
10 Kansai Int'l Osaka 511 30,700,000 1,390,000 165,710 11 JFK New York 2,052 27,760,912 1,317,961 321,498
12 De Goulle Paris 3,104 25,198,420 658,325 296,194
13 Orley Paris 25,170,204 306,991 214,543
14 Newark New York 24,286,986 587,753 410,996
15 Osaka Osaka 317 23,516,231 482,439 132,070
Hong Kong Hong Kong 1,248? 22,663,388 956,908 140,791 Honolulu Hawaii 22,608,188 380,852 403,630 Narita Tokyo 680 22,030,102 1,335,871 122,580 Soeul Korea 21,231,468 743,397 145,731 Schipool Holland 1,750 19,145,064 723,839 274,608 Singapole Singapole 18,100,155 720,677 143,700 Bangkok Thailand 16,656,658 438,416 153,446 AVERAGE 31,169,840 782,628 349,280 Asian Airports 24,692,107 819,681 149,472 EU Airports 29,099,029 772,775 306,449 US Airports 38,078,276 755,166 550,681
Chapter 3. Outline of Rinku Town
3. 1. Outline of Physical Planning (Final Report, March, 1989)
1. Official Name 2. Public Sectors 3. Location 4. Site Area 5. Floor Area 6. FAR / Zoning 7. Land Use 8. Schedule (Original) 9. Cost 10. Land Price 11. Access 12. Population
South Osaka Bay Waterfront Area Development
Osaka Government, City of Izumi-Sano, Tajiri, and Sen-Nan Sen-Shu waterfront area, 40km south from center of Osaka 318.4 ha
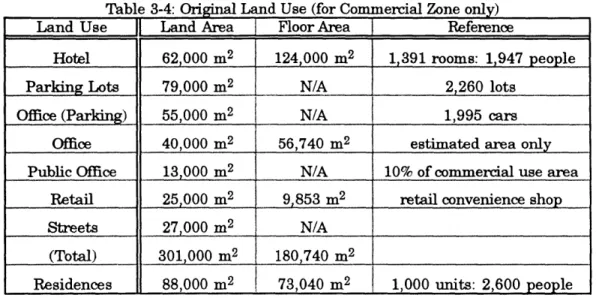
163 ha4 3 (Commercial zone only)
600%: Commercial Zone, 300%: Mixed Industrial Zone
200%: Residential & Industrial Zone
Officially Approved Rinku Planning District (1989)
Business, Retail, Culture, Hotel, Factory, Park, Storage, Distribution, Airport Related Facilities ( Maintenance Base, Residences, etc.)
1991 Developers selected 1992 Start construction 1995 Partially Open.
1,400 billion yen (US$ 10.51 billion)4 4 (estimated in 1991) (infrastructure 550 billion yen & developers' construction cost)
@/m2 1,130,000~1,530,000 yen, (@/m2 8,450~11,442 US$) Waterfront Highway, Railway, Cruise Service
200,000
43. Asahi Shinbun Newspaper, December 7, 1990, Floor area and construction cost of each
proposal wasn't disclosed. (FAR 600%)
MAJOR TRANSPORT NETWORK
Prefectural Boundary JR Lines. Bullet Train JR Lines
Private Railways Expressway
National Highway Route No.
Expressway & Railway under construction
LEGEND
-The Rinku Gate Tower Building, the heart of Kansal's international and domestic transportation network
Rising into the sky across from the Kansai international Airport. the Rinku Gate Tower Building will be a mere five minutes from the airport and about 30 minutes from the center of Osaka by train, gaining maximum benefit from the 24-hour airport facilities The fastest access
ti internatironal and domestic flights and convnrient rail-wav and highway networks provide easy acress to all of Kansai s major cities
Travel time by type of transportation
sini 105 min. approx.
Kyoto Kansai
0 m n approx international
Osaka 0y nmi. appmx. Airport 'ty 30min. apx Smin
Namba Rinku
65 min. approx. Gate Tower
Ko 65 m. approx. Building
iaie 8 30 min. approx.
- - :( p85 min. approx.
Nara_ 70 mn approx.
- 35 min, approx.
WakayamaA
* 30 min. approx.
Access from major Kansai cities
Kyoto
-Cht--u rr
Kobe
-Rinku Town Area
RinkuOGateTowerudinrg ierntional Arpor Acces arkfge Airport T_ i_ Shin-Osaka Station --{Eidtet [yaln) - Osaka Namba, Nara 40km 30km s, 20km t0km r,
Kansei international Airport
Expressways
JR lines
---- Shinkansen ia.,isi rw.In wakayam, ---- Nankal Railway
Sea Routes
MitAll, r/- a IOLs: ft *i I( -t, M -,"s : H Jitaft o 4i t
Kbl I, W~ k - L ~±L00
'e I1(10 L L L: I1141 /) 0) F- -> - 11 1_ Vi* L, L UIW) - IVR fAt t I : 157
a 0 a Oqirrtl r30 Vito ki1i SRKdIR rNcMiS itWWWtr , t 6 F--
2)--7 49
inans erinlber W T 0 M V9 r70 *tPEiFe R ri Itr.T4 ._.I ...OLS IA17 11141FAMMs Ite,
IA, i T*mlIEmftS s .:.4. 6 0 0 840 200 60 10 h 3 0 6 1 0 a , 6 0 to(, 60 2 100 10 ?200 6 0
Conceptual Model (1986)
Conceptual Model (1990)
-49 'I
-Nippon Life Insurance Group .~ (~* - --- - Y. e-- -N-t lit eemas
ILIs
.OOMitsui Real Estate Group