HAL Id: hal-00330212
https://hal.archives-ouvertes.fr/hal-00330212
Submitted on 9 May 2005HAL is a multi-disciplinary open access
archive for the deposit and dissemination of sci-entific research documents, whether they are pub-lished or not. The documents may come from teaching and research institutions in France or abroad, or from public or private research centers.
L’archive ouverte pluridisciplinaire HAL, est destinée au dépôt et à la diffusion de documents scientifiques de niveau recherche, publiés ou non, émanant des établissements d’enseignement et de recherche français ou étrangers, des laboratoires publics ou privés.
Efficiency of the silicate pump at a coastal oligotrophic
site in the Mediterranean Sea
K. Leblanc, Bernard Queguiner, Patrick Raimbault, N. Garcia
To cite this version:
K. Leblanc, Bernard Queguiner, Patrick Raimbault, N. Garcia. Efficiency of the silicate pump at a coastal oligotrophic site in the Mediterranean Sea. Biogeosciences Discussions, European Geosciences Union, 2005, 2 (3), pp.551-580. �hal-00330212�
BGD
2, 551–580, 2005 Efficiency of the silicate pump at a coastal site K. Leblanc et al. Title Page Abstract Introduction Conclusions References Tables Figures J I J I Back CloseFull Screen / Esc
Print Version Interactive Discussion EGU Biogeosciences Discussions, 2, 551–580, 2005 www.biogeosciences.net/bgd/2/551/ SRef-ID: 1810-6285/bgd/2005-2-551 European Geosciences Union
Biogeosciences Discussions
Biogeosciences Discussions is the access reviewed discussion forum of Biogeosciences
E
fficiency of the silicate pump at a coastal
oligotrophic site in the Mediterranean Sea
K. Leblanc1, B. Qu ´eguiner2, P. Raimbault2, and N. Garcia2
1
College of Marine Studies, University of Delaware, 700 Pilottown Road, Lewes, DE 19958, USA
2
Laboratoire d’Oc ´eanographie et de Biog ´eochimie, CNRS, University of Aix-Marseille II, Campus de Luminy, 13288 Marseille Cedex 9, France
Received: 31 March 2005 – Accepted: 11 April 2005 – Published: 9 May 2005 Correspondence to: K. Leblanc ([email protected])
BGD
2, 551–580, 2005 Efficiency of the silicate pump at a coastal site K. Leblanc et al. Title Page Abstract Introduction Conclusions References Tables Figures J I J I Back CloseFull Screen / Esc
Print Version Interactive Discussion
EGU Abstract
A one-year survey of the sedimenting particulate material was conducted at the SOFi site located on the edge of the continental slope in the Gulf of Lions (Northwestern Mediterranean) between September 1999 and December 2000. The main focus of this paper was to investigate the seasonal pattern of particulate biogenic silica (BSi)
sedi-5
mentation fluxes in comparison with the particulate carbon fluxes and establish annual budgets of Si and C export. The pattern of the downward flux of BSi was partly typ-ical with increased daily sedimentation rates during spring followed by smaller peaks during summer. However, an unusual sedimentation event was recorded in the bottom trap in February before the spring thermal stratification occurred, and represented 37%
10
of the annual BSi mass flux. The total annual BSi flux at the SOFi site was estimated from the bottom trap and amounted to 86.8 mmol Si m−2y−1, while the organic carbon flux amounted to 154.9 mmol C m−2 y−1. The overall efficiency of C export to depth compared to surface primary production budgets was low (3%) and similar to values found for oligotrophic regions of the Eastern Mediterranean. On the other hand, we
15
documented a very high efficiency of the Si export at the SOFi site, with 62% of the Si produced in the surface layer exported to the bottom trap. The excellent correlation between BSi and particulate organic C (POC) in the bottom trap further indicates that the bulk of the organic matter is transferred to depth in association with diatoms. How-ever, the main fraction of the C produced by phytoplankton is lost in the water column
20
through oxidation or metabolisation, while biogenic silica is more efficiently transferred to depth. This strong Si/C decoupling with depth is likely to be the cause of the spring depletion of silicic acid over the entire water column which was observed by mid-April in a companion study (Leblanc et al., 2003) and may cause a severe Si limitation of the diatom spring bloom in this oligotrophic region of the Gulf of Lions.
BGD
2, 551–580, 2005 Efficiency of the silicate pump at a coastal site K. Leblanc et al. Title Page Abstract Introduction Conclusions References Tables Figures J I J I Back CloseFull Screen / Esc
Print Version Interactive Discussion
EGU 1. Introduction
Even though continental margins represent only 8% of the ocean surface, they are the sites of high marine organic productivity and contribute to between 18 and 33% of total oceanic C production (Wollast, 1991). Due to their shallow depths, they are also the sites of enhanced C burial in the sediments with a burial rate 10 to 100 times higher
5
than the oceanic domain (Berger et al., 1989). Liu et al. (2001) estimated the total C burial rate in the continental margins to be 0.15×10¹⁵g C y−1, which would represent two-thirds of the total oceanic burial. Understanding the biological and physical pro-cesses driving the export of organic material in the coastal zones is thus crucial to a better characterization of these areas as sinks or sources of C.
10
A number of studies have focused on the C, N, P budgets of these coastal zones while much fewer have addressed the Si cycle. Diatoms are known to dominate in nutrient rich and strongly hydrodynamic areas and are therefore largely represented in coastal environments (Margalef, 1978). They are often associated with massive spring blooms followed by subsequent rapid sedimentation, resulting in stronger C export to
15
depth as compared to the development of a microbial loop, which favors C recycling within the photic layer (Legendre and Lef `evre, 1989). The opal burial was first thought to occur primarily in the Southern Ocean, below the Polar Front belt, where sediments are almost entirely composed of diatomaceous opal, and led to a previous estimates that 2/3 of the global burial of biogenic silica took place in this region (DeMaster, 1981;
20
Tr ´eguer et al., 1995). Recent studies evidenced that the opal burial rate in the Southern Ocean has been largely overestimated due to sediment focusing, and re-established the budget of this region to a 17 to 37% contribution to the global opal burial (Pondaven et al., 2000; Ragueneau et al., 2000). The “lost” Si burial in the Southern Ocean is thought to be balanced by the a higher export rate on continental margins. New
25
estimates indicate that the Si burial for the continental margins amounts to 32 to 39% of the total burial, leading to a reasonable balance of the global Si budget (Ragueneau et al., 2000).
BGD
2, 551–580, 2005 Efficiency of the silicate pump at a coastal site K. Leblanc et al. Title Page Abstract Introduction Conclusions References Tables Figures J I J I Back CloseFull Screen / Esc
Print Version Interactive Discussion
EGU
In the Mediterranean Sea, the Si cycle is overall poorly documented compared to the available studies on C, N and P. In the present study, we have focused on the Si cycle and on opal fluxes throughout a yearly survey in the Gulf of Lions, located on the French Mediterranean coast. The long-term observation site SOFi (Site d’Observation FIxe) has been the object of a seasonal study since 1997. From September 1999 to
5
November 2000, we conducted additional measurements describing the silicon cycle. A companion paper published in a special issue dedicated to the Gulf of Lions de-scribes the seasonal pattern of diatom distribution and biogenic silica production in the water column (Leblanc et al., 2003). In the present paper, complementary data char-acterizing the downward fluxes of particulate matter and biogenic silica in sediment
10
traps are further presented. The aim of this study was to establish an annual budget of biogenic silica export at the SOFi site and in particular: to describe the annual Si flux patterns, to compare them with the other constituents of the downward flux such as particulate organic and inorganic carbon (POC and calcium carbonate, CaCO3) and finally to address the Si/C decoupling processes during particle sedimentation.
15
2. Material and methods
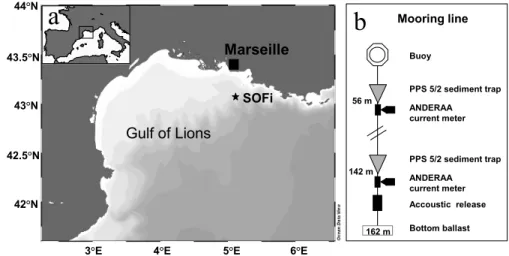
The study site was located in the Gulf of Lions in the North Western Mediterranean Sea (5◦07060 E ; 43◦04000 N) on the edge of the continental slope 20 miles off Marseille (Fig. 1a). The sedimenting particulate matter was collected between September 1999 and November 2000 by a mooring line equipped with two sediment traps (Technicap®
20
PPS 5/2, collection area 1 m2, 24 receiving cups), located at 56 m and 142 m depth, 20 m above bottom (Fig. 1b). The cups were filled before deployment with filtered seawater (0.45 µm) containing 5% (v/v) buffered formaldehyde for sample preservation. The sediment trap sampling interval was set at 3–4 days in order to catch any short scale sedimentation pulse, while trap contents were retrieved every three months. The
25
samples were stored in the dark at 4◦C and were processed at the laboratory a day after recovery for total mass flux and particulate carbon.
BGD
2, 551–580, 2005 Efficiency of the silicate pump at a coastal site K. Leblanc et al. Title Page Abstract Introduction Conclusions References Tables Figures J I J I Back CloseFull Screen / Esc
Print Version Interactive Discussion
EGU
Large swimmers were removed using a 200 µm mesh, and any remaining ones were removed manually. Sub-samples were then filtered onto GF/F Whatman filters (0.2 µm), rinsed with DIW and oven-dried at 60◦C. Total carbon was analyzed by com-bustion on a CHN carbon analyzer (LECO 800) according to Raimbault et al. (1999). A replicate sample was then calcinated to remove the organic C content and analyzed
5
for particulate mineral carbon (CaCO3) on the CHN. Particulate organic carbon (POC) was calculated by substraction of the two measurements (POC= total C – mineral C). Calcium carbonate was calculated by using the inorganic carbon (CaCO3= inorganic carbon × 100/12).
A known volume was sub-sampled for biogenic silica (BSi) determination, and the
10
sediment material was freeze-dried after centrifugation and removal of the supernatant. An optimal quantity of 5 mg dry sediment was determined for the BSi measurement. Pre-treatment assays showed a better extraction efficiency when samples were treated with 10% H2O2 for 30 min. followed by an exposition to concentrated HCl fumes for 24 h. The acid-treated dry sediment was placed in a 50 mL centrifuge tube and BSi was
15
extracted in 40 mL NaOH (0.2 N) at 95◦C for 2 h according to Kamatani and Oku (2000). At T0+ 20, 40, 60, 90 and 120 min. during the extraction, two sub-samples of 200 µL were respectively analyzed for dissolved silica and aluminum (Al). Al measurements were used to discriminate between biogenic and lithogenic silica, since lithogenic min-erals usually have a mean Si/Al ratio of 2, while Al incorporation in diatom frustules
20
is negligible (Kamatani, 1974). Dissolved Al was measured on an ICP-AES in Brest (courtesy of Jo Cotten, IUEM, Brest) but concentrations remained under the detec-tion limit (2 ppb), indicating the absence of contaminating LSi. Biogenic silica was therefore estimated following DeMaster (1981), by plotting dissolved silica vs. time and calculating the intercept on the y-axis of the tangent to the linear part of the extraction
25
curve. When there was no consistent increasing trend in extracted Si with time, BSi was calculated as the mean concentration of the 3 last measurements (Conley, 1998). Corrections were made to include the amount of BSi that had dissolved in the cups dur-ing sampldur-ing and storage by measurdur-ing Si(OH)4in the supernatant immediately before
BGD
2, 551–580, 2005 Efficiency of the silicate pump at a coastal site K. Leblanc et al. Title Page Abstract Introduction Conclusions References Tables Figures J I J I Back CloseFull Screen / Esc
Print Version Interactive Discussion
EGU
freeze-drying the sediment trap material. Si dissolution in the cups decreased expo-nentially with the amount of biogenic silica present in each sample (Fig. 2). Considering Si dissolution in the collection cups resulted in a correction of the annual BSi flux at the SOFi site of+ 9.5% and should therefore systematically be taken into account.
Sediment cores were sampled between April and September 2000 during the
5
monthly survey of the SOFi site (Leblanc et al., 2003) and the BSi content of the 0– 0.5 cm surface layer of the sediment was measured following the protocol for sediment traps described above. Si fluxes are expressed as opal as described in Mortlock and Froelich (1989) for better comparison with other studies (opal= biogenic silica × 2.4).
3. Results
10
Sediment traps were deployed and recovered on average every ten weeks, but due to a technical failure of the motors rotating the sampling cups, both the surface and deep series were interrupted. The mooring line was furthermore not deployed between November 1999 and February 2000, due to ship immobilization. Bottom and surface trap results will be compared when feasible, but we will mainly focus on the lower trap
15
data, which provides the longest continuous series. 3.1. Mass fluxes
Mass fluxes were recorded at 56 m and 142 m between September 1999 and Decem-ber 2000 (Fig. 3). During the sampling period, the mass fluxes at the SOFi site re-mained low most of the time, exceeding 1000 mg m−2 d−1 only on three occasions.
20
Throughout the survey, the mean total mass fluxes were 239 and 350 mg m−2 d−1 in the surface and bottom traps respectively. Higher variability in the daily mass fluxes was observed in the deeper trap (standard deviation between all samples ± 600 mg m−2d−1) as compared to the upper one (± 437 mg m−2 d−1). At 56 m depth, fluxes varied from 1 to 3249 mg m−2d−1while fluxes recorded at 142 m ranged between
BGD
2, 551–580, 2005 Efficiency of the silicate pump at a coastal site K. Leblanc et al. Title Page Abstract Introduction Conclusions References Tables Figures J I J I Back CloseFull Screen / Esc
Print Version Interactive Discussion
EGU
28 and 3617 mg m−2 d−1. The highest mass flux was recorded in mid-February 2000 at 142 m, while the flux at 56 m was approximately 3 times lower. The most important sedimentation event sampled in the surface trap occurred in the beginning of October 1999. As a general trend, surface and deep mass fluxes appeared uncorrelated. 3.2. Opal fluxes
5
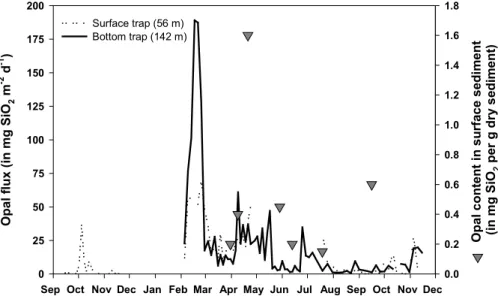
Similarly to the mass fluxes, biogenic silica or opal fluxes were generally higher in the lower trap (mean: 21.6 ± 36.1 mg opal m−2 d−1) than in the surface trap (mean: 12.8 ± 17.0 mg opal m−2 d−1) (Fig. 4). Opal fluxes presented one major in-crease in mid-February 2000 in the deeper trap (189.1 mg opal m−2d−1) while smaller sedimentation peaks were recorded between April and mid-May. In the surface trap, the
10
highest opal flux was observed towards the end of February (69.1 mg opal m−2 d−1). Opal fluxes and mass fluxes appeared significantly correlated in both traps (upper trap: r2=0.73, ν=69; lower trap: r2=0.94, ν=71).
The biogenic silica content was measured in surface sediments (0–0.5 cm layer) on 7 occasions during the monthly survey of the SOFi site (Fig. 4). The sediment silica
15
content increased significantly at the end of April with 3.8 mg opal g−1 dry sediment, whereas the average value for the 6 other measurements was 0.8 ± 0.4 mg opal g−1 dry sediment.
3.3. Particulate organic carbon (POC) fluxes
Particulate carbon fluxes patterns showed strong similarities with the precedent
pa-20
rameters, with peaks of sedimentation occurring at the same periods, but of varying intensity (Fig. 5). The average POC fluxes over the sampling period were very similar in both traps, with 26.3 ± 30.5 mg C m−2 d−1 at 56 m and 24.3 ± 35.3 mg C m−2 d−1 at 142 m. The largest sedimentation events were recorded in the beginning of October 1999 in the surface trap (169.9 mg C m−2d−1) and in mid-February 2000 in the bottom
25
BGD
2, 551–580, 2005 Efficiency of the silicate pump at a coastal site K. Leblanc et al. Title Page Abstract Introduction Conclusions References Tables Figures J I J I Back CloseFull Screen / Esc
Print Version Interactive Discussion
EGU
3.3.1. Calcium carbonate flux
The surface trap recorded several calcium carbonate sedimentation events occurring mainly during the fall season and the end of summer (August to December months), ranging from 95.0 to 575.4 mg CaCO3 m−2 d−1 (Fig. 6). By comparison the early spring flux of carbonate recorded in February 2000 was slightly lower and ranged from
5
180.4 to 195.1 mg CaCO3m−2 d−1. In the bottom trap, the highest flux was observed in February 2000 (746.7 mg CaCO3 m−2 d−1), coinciding with the increase described for all other parameters. The average carbonate flux over the entire survey was fairly similar in both traps, with an average of 65.0 ± 97.7 mg CaCO3m−2d−1 in the surface trap and of 73.7 ± 126.7 mg CaCO3m−2d−1in the bottom trap.
10
3.4. Si/C ratio of sedimenting particles
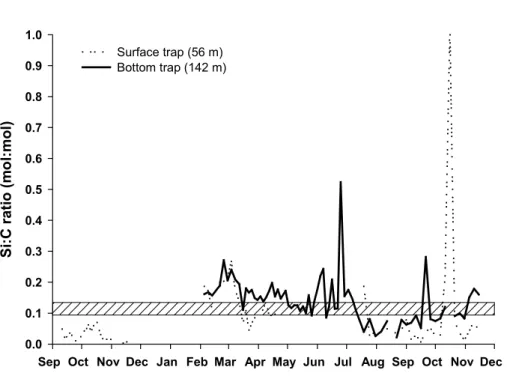
The Si:C molar ratios of sedimented particulate matter were calculated for both trap samples and compared to Brzezinski’s ratio for living diatoms of 0.09–0.13 (Brzezinski, 1985) (Fig. 7). Si:C ratios were generally lower in the surface trap (average BSi:POC=0.09) and increased substantially in the bottom trap (average
15
BSi/POC=0.14). A sharp increase of the Si:C molar ratio was observed in mid-October 2000 at 56 m, with a peak value of 1.03. In the bottom trap samples, the highest ratio was recorded at the end of June, when the Si:C ratio reached 0.52.
The opal and POC fluxes appeared significantly correlated at both depth (at 56 m r2=0.51, α=0.001, ν=68 and at 142 m r2=0.95, α=0.001, ν=70) as shown in Fig. 8.
20
The slope of the regression line, representing the average BSi:POC ratio, was again lower at 56 m than at 142 m (0.07 vs. 0.18).
3.5. Si and C export budgets
The annual Si export budget for the year 2000 was derived from the bottom trap, which provided the longest continuous data set. The surface trap was furthermore not
BGD
2, 551–580, 2005 Efficiency of the silicate pump at a coastal site K. Leblanc et al. Title Page Abstract Introduction Conclusions References Tables Figures J I J I Back CloseFull Screen / Esc
Print Version Interactive Discussion
EGU
tioned deeply enough to take into account all biological processes occurring over the entire photic zone. Two main sampling gaps were observed for the bottom trap (from 1 January to 5 February and from 15 November to 31 December) corresponding to winter periods when the biogenic Si flux is negligible. The Si flux for these periods has therefore been extrapolated from the average Si flux obtained from 1 September
5
to 15 November period, when downward Si fluxes were homogeneous and low. The annual opal flux amounted to 5831 mg m−2y−1, corresponding to an average daily flux of 16 mg m−2 d−1. The same calculation was applied to the POC flux and resulted in an annual organic C flux of 2082 mg m−2y−1(5.7 mg m−2 d−1).
4. Discussion
10
4.1. Total sedimentation fluxes
The total mass flux was overall low (<1000 mg m−2d−1) throughout the survey, except for two sedimentation events exceeding 3000 mg m−2d−1. These fluxes were similar to values recorded in the Cretan Sea (Stavrakakis et al., 2000) and reflect the oligotrophic nature of the North Mediterranean Current (NMC) which flows along the slope during
15
most of the year. A similar range of mass fluxes was observed by Monaco et al. (1999) in the Grand Rhone Canyon, situated just west of the SOFi site, with fluxes comprised between 80 and 3410 mg m−2 d−1. As a general trend, one could also note an aver-age increase of 30% of the mass flux from the surface trap to the bottom trap, which is the reverse of what is commonly observed in the open ocean, where the
sediment-20
ing flux rapidly decreases with depth. This phenomenon has already been described for the Gulf of Lions (Monaco et al., 1990; Kerherv ´e et al., 2001) and several other locations on the continental margins and has been attributed to sediment resuspen-sion events (Gardner et al., 1983; Auffret et al., 1994), lateral transport (Heussner et al., 1999; Stavrakakis et al., 2000) or the presence of bottom nepheloid layers
carry-25
BGD
2, 551–580, 2005 Efficiency of the silicate pump at a coastal site K. Leblanc et al. Title Page Abstract Introduction Conclusions References Tables Figures J I J I Back CloseFull Screen / Esc
Print Version Interactive Discussion
EGU
al., 1999). Although bottom nepheloid layers and lateral advection of material seem a likely explanation, it must be noted that our mooring line was not as deep as in most of these studies, and that the upper trap, located only at 56 m below surface, is probably not receiving all of the produced material throughout the photic layer. The bottom trap was placed at 20 m above bottom to avoid major resuspension events, but was more
5
likely to catch the largest fraction of the sedimenting material at the SOFi site.
Furthermore, the correlation coefficients between the biogenic components and the total mass fluxes increased between the surface and bottom traps, confirming that more biogenic material was collected by the deeper trap than by the surface one. At 56 m, the correlation coefficients between the daily mass flux and daily fluxes of POC, opal
10
and CaCO3 were respectively 0.77, 0.37 and 0.73. At 142 m, these same coefficients increased to 0.97, 0.95 and 0.96 respectively. It follows that the biogenic components varied concomitantly with the total mass flux throughout the survey.
4.2. Temporal variability and seasonality
The seasonal pattern was partly typical, with an increase of the mass flux during the
15
productive spring season, followed by several other sedimentation peaks scattered in the summer and autumn. However, a highly atypical event also occurred towards the end of winter, before the thermal spring stratification of the surface layer (Leblanc et al., 2003). Indeed, an important sedimentation peak was recorded at both depths in mid-February, with a total mass flux more than 3 times higher than the spring peak value,
20
which was reflected similarly by the strongest annual increase in organic carbon, opal and calcium carbonate fluxes. Likely explanations for this increased flux could have been the occurrence of a large sediment resuspension event due to the strong hydron-amic forcing observed in the winter season in the Gulf of Lions or to the capture of a nepheloid bottom layer originating from the plateau. Both explanations were ruled
25
out for several reasons. Firstly, this large downward flux was also seen in the surface trap, which is not likely to receive any inputs from resuspended sediments. Secon-darily the microscopic examination of preserved trap samples evidenced the presence
BGD
2, 551–580, 2005 Efficiency of the silicate pump at a coastal site K. Leblanc et al. Title Page Abstract Introduction Conclusions References Tables Figures J I J I Back CloseFull Screen / Esc
Print Version Interactive Discussion
EGU
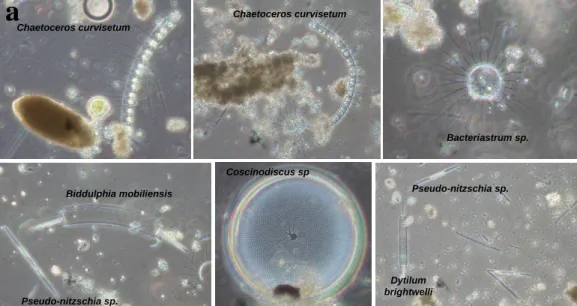
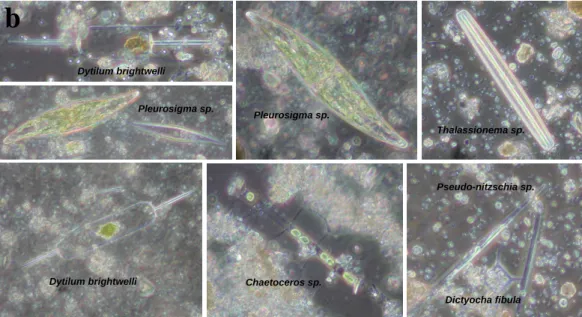
of large quantities of fresh pelagic material, constituted primarily of very large solitary diatoms, such as Dytilum brightwelli (500 µm), Thalassionema sp. (500 µm), Bidulphia mobiliensis (100 µm), Coscinodiscus sp. (>100 µm), as well as of chain forming di-atoms such as Chaetoceros sp., together with an important amount of organic debris and fecal pellets (Fig. 9), ruling out a benthic origin for this material. The opal flux in
5
mid-February constituted as much as 36% of the annual flux of biogenic opal at the SOFi site in the bottom trap. We hypothesize that this event was either the result of strong lateral advection of pelagic material originating from the plateau and exported towards the slope under strong NW winds recorded in early February, or the result of a brief but intense precocious bloom event on the continental margin slope.
Unfortu-10
nately, the monthly cruises conducted to survey the biological production at the SOFi site for that period were carried before and after the event (5 February and 30 March) and did not detect this early diatom bloom in the water column (Leblanc et al., 2003). This type of transient and intense phytoplankton growth is expected to occur frequently in the Gulf of Lions, where highly turbulent periods resulting in an entirely
homoge-15
neous and nutrient replenished water column can be followed by periods of calm winds and strong solar radiation.
The spring bloom was reflected in both traps from mid-February to mid-May, when the largest biological signal was observed and trap data showed a significant increase of the downward flux of all components during that period. The diatom spring bloom
20
was also recorded in the sediment, with an increase of the opal content of the surface sediment by a factor 4 on 21 April. The Si flux in April represented 17% of the total annual flux estimated from the bottom trap.
By comparison with the monthly water column survey, it appears that the monthly and even bi-monthly sampling intervals during spring was not adequate to cover the
25
full extent of the productive season. The present sediment trap data indicate that the water column biogenic silica as well as the Si production rates measured in situ are likely to be underestimated for the SOFi site (Leblanc et al., 2003) and that the down-ward material flux occurs with a high temporal variability, which can be seen as short
BGD
2, 551–580, 2005 Efficiency of the silicate pump at a coastal site K. Leblanc et al. Title Page Abstract Introduction Conclusions References Tables Figures J I J I Back CloseFull Screen / Esc
Print Version Interactive Discussion
EGU
pulses of sedimentation and drastic flux increases over only a few days. This short-term variability has been described in previous studies as the result of several forcing events such as the Rhone River inputs, the strong wind regimes in the Gulf of Lions, internal waves, resuspension events, variations of the path of the NMC (Millot, 1990) and rapid changes in the light and nutrient regimes, which allows phytoplankton to
5
bloom outside of the productive period (Diaz et al., 2000). Thus a rotation period of the sediment trap cups of 3 to 4 days seems to be close to the minimum interval required to accurately accurately monitor the pulse-like biological events taking place in the Gulf of Lions.
4.3. Si/C decoupling
10
Opal and POC fluxes appeared overall well correlated, with concomitant export peaks, but of varying intensities depending on the nature of the phytoplankton community. The higher Si:C molar ratio confirmed the dominance of diatoms during the spring season, with fresh material ratios (comprised between 0.09 and 0.13) in the surface trap and increasing ratios closer to 0.2 in the bottom trap, reflecting the faster recycling of C
15
in the water column compared to Si (Fig. 7). Diatom abundance decreased strongly under the autumnal oligotrophic conditions and Si:C ratios decreased to values as low as 0.04 in the surface trap. The peak values of 1.03 measured in mid-October in the surface trap was not attributed to a sudden diatom bloom, but was the consequence of very low POC fluxes. Another peak in the Si:C ratio was observed in June (up to 0.5)
20
and reflected a more detrital siliceous population remaining after the productive spring season.
The excellent correlation of BSi and POC fluxes in the bottom trap (r2=0.95) indi-cated that the largest fraction of the organic C exported to depth was associated to diatom sedimentation events, while smaller cells were more rapidly recycled within the
25
euphotic layer (Fig. 8). Diatoms are known to form large aggregates characterized by high sedimentation rates, a process which efficiently transfers organic material to depth (Smetacek, 1985). However, the rapid increase of Si:C ratios with depth
illus-BGD
2, 551–580, 2005 Efficiency of the silicate pump at a coastal site K. Leblanc et al. Title Page Abstract Introduction Conclusions References Tables Figures J I J I Back CloseFull Screen / Esc
Print Version Interactive Discussion
EGU
trates the faster recycling of C as the microbial component remineralizes the sediment-ing material and as zooplanktonic grazers preferentially metabolize C while excretsediment-ing unusable particulate Si in fecal pellets. The decoupling of Si and C was apparent from the production ratio in the photic layer to the subsequent export to depth. The annual integrated Si:C production ratio, derived from Leblanc et al. (2003), was estimated to
5
be 0.03 (ΣSi/ΣC=0.14 mol Si/4.5 mol C m−2 y−1), which is similar to values found in the Equatorial Pacific (review in Ragueneau et al., 2000). Average annual Si:C export ratios increased to 0.09 at 56 m and 0.14 at 142 m and were comparable to those ob-served in other open ocean oligotrophic sites such as BATS and PAP (Ragueneau et al., 2002).
10
4.4. Si and C budgets, efficiency of the silicate pump
In the companion paper describing the biological processes occurring in the water column at the SOFi site, yearly Si and C production rate budgets were derived from monthly in situ measurements and amounted to 140 mmol Si m−2y−1and 4500 mmol C m−2y−1(Leblanc et al., 2003). The annual Si and C export flux budgets estimated from
15
the bottom trap data amounted to 86.8 mmol Si m−2 y−1 and 154.9 mmol C m−2 y−1. Thus the yearly export of biogenic silica to depth represents 62% of the Si produced in the water column, while only 3.4% of the annual C primary production reaches the same depth. The Si export efficiency may be close to the high range, since Si produc-tion budgets are likely to be underestimated at the SOFi site. These results emphasize
20
the strong Si/C decoupling that occurs when diatoms sediment through the water col-umn. The preferential export of Si compared to C is well known and results in rapid loss of silicic acid in the surface layer during the productive season, which has been termed the “silicate pump” (Dugdale et al., 1995). The silicate pump seems particularly efficient at the SOFi site, with a rapid export of particulate Si to depth, and may explain
25
together with the onset of stratification the complete depletion of the water column in silicic acid observed in April (Leblanc et al., 2003).
BGD
2, 551–580, 2005 Efficiency of the silicate pump at a coastal site K. Leblanc et al. Title Page Abstract Introduction Conclusions References Tables Figures J I J I Back CloseFull Screen / Esc
Print Version Interactive Discussion
EGU
found very similar C export rates in the sediment traps, with 8% of the C produced through primary production reaching the surface trap and 6% reaching the bottom trap, implying that the main fraction of organic C is lost through oxidation or metabolization. The efficiency of POC export to depth calculated for the SOFi site is consistent with values found in the literature for other oceanic systems (5 to 10%) (Buesseler, 1998).
5
In the Eastern Mediterranean, similar values were found, with an export efficiency of 2 to 3% of the primary production in the Cretan Sea (Stavrakakis et al., 2000) and less than 4% in the Adriatic (Boldrin et al., 2002). Another study conducted in different parts of the Mediterranean evidenced an increase in the C export efficiency from the Eastern (3%) to the Western part (10%) of the Mediterranean (Danovaro et al., 1999),
10
but our results are more consistent with values found for the Eastern basin. This result was not surprising however, as oligotrophic conditions are prevalent at the SOFi site through out most of the year (Diaz, 2000; Leblanc et al., 2003).
4.5. Si export fluxes – comparison with other studies
A comparison with other annual Si export budget established for the Mediterranean Sea
15
indicates that the annual flux at SOFi is similar in range to what has been observed in the Lacaze-Duthiers Canyon in the western part of the Gulf of Lions, but lower than the fluxes estimated from other studies conducted closer to our study site in the Eastern part of the Gulf (Table 1). Si export fluxes were at least twice as high at the exit of the Grand Rhone Canyon and on the open slope of the continental margin, which were
20
located within 30 nautical miles of the SOFi site. This further emphasizes the strong temporal variability of sedimentation rates prevailing in the Gulf of Lions, which may in part be due to variations of the vertical component, driven by biological processes, but also to variations of the lateral transport from the continental shelf to the slope, which is likely to differ according to the bottom topography (Monaco et al., 1990). Si
25
export fluxes at the SOFI site were also lower than the fluxes observed in the Adriatic Basin in the Eastern Mediterranean, but only twice as high as the Si fluxes in the Ionian Sea, which again demonstrates the presence of oligotrophic waters in this area. To our
BGD
2, 551–580, 2005 Efficiency of the silicate pump at a coastal site K. Leblanc et al. Title Page Abstract Introduction Conclusions References Tables Figures J I J I Back CloseFull Screen / Esc
Print Version Interactive Discussion
EGU
knowledge, the lowest Si fluxes in the Mediterranean were measured in the Cretan Sea, with annual fluxes as low as 3 to 8 mmol Si m−2 y−1 (Table 1). The highest Si export was recorded in the Western Mediterranean in the Alboran Sea Gyre (460 mmol Si m−2 y−1) and was approximately 5 times higher than the flux measured at the SOFi site.
5
5. Conclusions
The downward particulate flux at the SOFi site showed a typical seasonal signal, with an increase of the total mass flux as well as of all biogenic components (POC, opal, CaCO3) during spring and several smaller peaks in summer and fall. However, the particulate flux also presented one atypical feature with the strongest opal flux (37%
10
of the annual budget) observed very early in the season in mid-February, before the spring thermal stratification of the water column even occurred. We hypothesize that a short-term bloom of diatoms may have taken place on the plateau and was subse-quently advected towards the margin slope due to strong NW winds or that a brief but intense precocious bloom may have occurred locally.
15
The excellent correlation between biogenic silica and organic carbon in the bottom trap indicates that the bulk of the organic matter found in the bottom trap is transferred to depth in association with diatoms, which tend to sink more rapidly than other phy-toplankton groups. However, the larger part of the organic C produced in the surface layer is remineralized in the water column before reaching the bottom trap, with an
ex-20
port efficiency of only 3%. The silicate pump was on the other hand particularly efficient at the SOFi site, with 62% (high estimate) of the Si produced in the water column ex-ported to depth. This decoupling of the Si and C cycles increased with depth, as seen in the increase of Si/C ratios (0.09 to 0.14), reflecting the preferential preservation of Si over C during the sedimentation of particles.
25
The increased Si fluxes during spring were concomitant to a complete depletion of silicic acid throughout the water column by mid-April (Leblanc et al., 2003). Thus, the
BGD
2, 551–580, 2005 Efficiency of the silicate pump at a coastal site K. Leblanc et al. Title Page Abstract Introduction Conclusions References Tables Figures J I J I Back CloseFull Screen / Esc
Print Version Interactive Discussion
EGU
efficiency of the silicate pump in shallow systems of the continental margin may result in potential Si limitation conditions in the surface layer during the spring-summer season, preventing diatoms from forming massive blooms. Consequently, Si limitation may play a larger role than formerly expected in the Gulf of Lions by controlling diatom growth and limiting the spring bloom in the North Mediterranean Current.
5
Acknowledgements. The authors would like to thank G. Coustillier for her assistance in
build-ing the moorbuild-ing line and her help on board for immergbuild-ing and retrievbuild-ing the sediment traps. We also are deeply grateful to P. Rimmelin for her help on board with collecting the samples, to E. Schaaff for collecting sediment cores and processing them for freeze-drying. We deeply appreciated J. Cotten’s help in running the aluminum analysis on our sediment and trap
sam-10
ples. Last, we acknowledge the captains and crews of the coastal vessels Georges Petit and Tethys II, whose help and experience was necessary to carry out this research program. This project was funded by the BioSiCa grant under the PNEC program and received support from INSU-CNRS. Work at sea was accomplished on INSU-CNRS research vessels: NO Professeur Georges Petit and NO Tethys II and the authors thank the crew for their help at any occasion.
15
References
Auffret, G., Khripounoff, A., and Vangriesheim, A.: Rapid post-bloom resuspension in the north-eastern Atlantic, Deep-Sea Res. I, 41, 925–939, 1994.
Berger, W. H., Smetacek, V. S., and Wefer, G.: Ocean productivity and paleoproductivity-An overview, in: Productivity of the Ocean: Present and Past, edited by: Berger, W. H.,
20
Smetacek, V. S., and Wefer, G., John Wiley & Sons Ltd, pp. 1–34, 1998.
Boldrin, A., Miserocchi, S., Rabitti, S., Turchetto, M. M., Balboni, V., and Socal, G.: Particulate matter in the southern Adriatic and Ionian Sea: characterisation and downward fluxes, J. Mar. Sys., 33-34, 389–410, 2002.
Buesseler, K. O.: The decoupling of production and particulate export in the surface ocean,
25
Global Biogoechem. Cycles, 12 (2), 297–310, 1998.
Brzezinski, M. A.: The Si:C:N ratios of marine diatoms: interspecific variability and the effect of some environmental variables, J. Phycol., 21, 345–357, 1985.
BGD
2, 551–580, 2005 Efficiency of the silicate pump at a coastal site K. Leblanc et al. Title Page Abstract Introduction Conclusions References Tables Figures J I J I Back CloseFull Screen / Esc
Print Version Interactive Discussion
EGU Conley, D. J.: An interlaboratory comparison for the measurement of biogenic silica in
sedi-ments, Mar. Chem., 63, 39–48, 1998.
Danovaro, R., Dinet, A., Duineveld, G., and Tselepides, A.: Benthic response to particulate fluxes in different trophic environments: a comparison between the Gulf of Lions-Catalan Sea (western-Mediterranean) and the Cretan Sea (eastern-Mediterranean), Prog. Oceanogr., 44,
5
287–312, 1999.
DeMaster, D. J.: The supply and accumulation of silica in the marine environment, Cosmochim. Acta, 45, 1715–1732, 1981.
Diaz, F.: Evolution saisonni `ere de la production primaire et des processus d’assimilation – r ´eg ´en ´eration de l’azote dans le golfe du Lion. Estimation d’un bilan de carbone. Approches
10
in situ et mod ´elisation, PhD thesis, Universit ´e de la M ´editerran ´ee, Aix-Marseille II, 2000. Diaz, F., Raimbault, P., and Conan, P.: Small-scale study of primary productivity during spring
in a Mediterranean coastal area (Gulf of Lions), Cont. Shelf Res., 20, 975–996, 2000. Dugdale, R. C., Wilkerson, F. P., and Minas, H. J.: The role of silicate pump in driving new
production, Deep-Sea Res. I, 42, 697–719, 1995.
15
Fabres, J., Calafat, A., Sanchez-Vidal, A., Canals, M., and Heussner, S.: Composition and spatio-temporal variability of particle fluxes in the Western Alboran Gyre, Mediterranean Sea, J. Mar. Sys., 33-34, 431–456, 2002.
Gardner, W. D., Richardson, M. J., Hinga, K. R., and Biscaye, P. E.: Resuspension measured with sediment traps in a high-energy environment, Earth and Planet. Sci. Let., 66, 262–278,
20
1983.
Heussner, S., Durrieu de Madron, X., Radakovitch, O., Beaufort, L., Biscaye, P. E., Carbonne, J., Delsaut, N., Etcheber, H., and Monaco, A.: Spatial and temporal patterns of downward particle fluxes on the continental slope of the Bay of Biscay (northeastern Atlantic), Deep-Sea Res. II, 46, 2101–2146, 1999.
25
Kamatani, A.: Studies on the dissolution of diatomaceous silica as a function of heating, J. Oceanogr. Soc. Jpn., 30, 157–162, 1974.
Kamatani, A. and Oku, O.: Measuring biogenic silica in marine sediments, Mar. Chem., 68, 219–229, 2000.
Kerherve, P., Heussner, S., Charri `ere, B., Stavrakakis, S., Ferrand, J. L., Monaco, A., and
30
Delsaut, N.: Biogeochemistry and dynamics of settling particle fluxes at the Antikythira Strait (Eastern Mediterranean), Prog. Oceanogr., 44, 651–675, 1999.
BGD
2, 551–580, 2005 Efficiency of the silicate pump at a coastal site K. Leblanc et al. Title Page Abstract Introduction Conclusions References Tables Figures J I J I Back CloseFull Screen / Esc
Print Version Interactive Discussion
EGU
15
N/14N) in settling organic matter of the northwestern Mediterranean Sea: biogeochemical implications, Oceanol. Acta, 24, S77–S85, 2001.
Leblanc, K., Qu ´eguiner, B., Garcia, N., Rimmelin, P., and Raimbault P.: Silicon cycle in the NW Mediterranean Sea: seasonal study of a coastal oligotrophic site, Oceanol. Acta, 26, 339–355, 2003.
5
Legendre, L. and Le F `evre, L.: Hydrodynamical singularities as controls of recycled versus export production in oceans, in: Productivity of the Ocean: Present and Past, edited by: Berger, W. H., Smetacek, V. S., and Wefer, G., John Wiley & Sons Ltd, pp. 49–63, 1989. Liu, K. K., Atkinson, L., Chen, C. T. A., Gao, S., Hall, J., Macdonald, R. W., Talaue MacManus,
L., and Quinones, R.: Exploring continental margin carbon fluxes on a global scale, EOS,
10
81, 641–644, 2000.
Margalef, R.: Life forms of phytoplankton as survival alternatives in an unstable environment, Oceanol. Acta, 1, 493–510, 1978.
Millot, C.: The Gulf of Lions’ hydrodynamic, Cont. Shelf Res., 10, 885–894, 1990.
Miserocchi, S., Faganeli, J., Balboni, V., Heussner, S., Monaco, A., and Kerherve, P.:
Char-15
acteristics and sources of the settling particulate organic matter in the South Adriatic basin, Organic Biogeochem., 30, 411–421, 1999.
Monaco, A., Courp, T., Heussner, S., Carbonne, J., Fowler, S. W., and Deniaux, B.: Seasonality and composition of particle fluxes during ECOMARGE – I, western Gulf of Lions, Cont. Shelf Res., 10 (9-11), 959–987, 1990.
20
Monaco, A., Durrieu de Madron, X., Radakovitch, O., Heussner, S., and Carbonne, J.: Origin and variability of downward biogeochemical fluxes on the Rh ˆone continental margin (NW Mediterranean), Deep-Sea Res. I, 46, 1483–1511, 1999.
Mortlock, R. A. and Froelich, P. N.: A simple method for the rapid determination of biogenic opal in pelagic marine sediments, Deep-Sea Res., 36, 1415–1426, 1989.
25
Pondaven, P., Ragueneau, O., Tr ´eguer, P., Hauvespre, A., Dezileau, L., and Reyss, J. L.: Re-solving the ’opal paradox’ in the Southern Ocean, Nature, 405, 168–172, 2000.
Ragueneau, O., Tr ´eguer, P., Leynaert, A., Anderson, R. F., Brzezinski, M. A., Demaster, D. J., Dugdale, R. C., Dymond, J., Fisher, G., Franc¸ois, R., Heinze, C., Maier-Reimer, E., Martin-J ´ez ´equel, V., Nelson, D. M., and Qu ´eguiner, B.: A review of the Si cycle in the modern ocean:
30
recent progress and missing gaps in the application of biogenic opal as a paleoproductivity proxy, Global and Planetary Change, 26, 317–365, 2000.
BGD
2, 551–580, 2005 Efficiency of the silicate pump at a coastal site K. Leblanc et al. Title Page Abstract Introduction Conclusions References Tables Figures J I J I Back CloseFull Screen / Esc
Print Version Interactive Discussion
EGU world ocean: is the Southern Ocean different?, Deep-Sea Res. II, 49, 3127–3154, 2002.
Raimbault, P., Pouvesle, W., and Boudjellal, B.: A semi-automatic, wet-oxydation method for simultaneous determination of particulate carbon, nitrogen and phosphorus collected on fil-ters, Mar. Ecol. Progr. Ser., 180, 289–295, 1999.
Smetacek, V. S.: Role of sinking in diatom life-history cycles: ecological, evolutionary and
5
geological significance, Mar. Biol., 84, 239–251, 1985.
Stavrakakis, S., Chronis, G., Tselepides, A., Heussner, S., Monaco, A., and Abassi, A.: Downward fluxes of settling particles in the deep Cretan Sea (NE Mediterranean), Progr. Oceanogr., 46, 217–240, 2000.
Tr ´eguer, P., Nelson, D. M., Van Bennekom, A. J., Demaster, D. J., Qu ´eguiner, B., and Leynaert,
10
A.: The silica budget of the World Ocean: a re-estimate, Science, 268, 375–379, 1995. Wollast, R.: The coastal organic carbon cycle: fluxes, sources and sinks, in: Ocean margin
processes in global change, edited by: Mantoura, R. F. C., Martin, J. M., and Wollast, R., J. Wiley and Sons Ltd., 1991.
BGD
2, 551–580, 2005 Efficiency of the silicate pump at a coastal site K. Leblanc et al. Title Page Abstract Introduction Conclusions References Tables Figures J I J I Back CloseFull Screen / Esc
Print Version Interactive Discussion
EGU Table 1. Comparison of sediment trap data of annual Si flux to depth in the Mediterranean Sea
with the present study. GRC: Grand Rh ˆone Canyon, LDC: Lacaze-Duthiers Canyon, WAG: Western Alboran Gyre.
Si flux Depth References
(mmol Si m−2y−1) (m)
Eastern Mediterranean
Cretan Sea 3; 8 200; 1515 Stavrakakis et al., 2000
Aegean Sea 23 965 Kerherv ´e et al., 1999
Ionian Sea 17; 32 880; 1345 Kerherv ´e et al., 1999
Ionian Sea 46; 27 150; 2250 Boldrin et al., 2002
Adriatic Bassin 211; 327 500; 1000 Miserocchi et al., 1999
Adriatic Bassin 302; 420 150; 1050 Boldrin et al., 2002
Western Mediterranean
Gulf of Lions – SOFi Site 86.8 142 This study
Gulf of Lions – LDC 32; 103; 163 100; 300; 600 Monaco et al., 1990
Gulf of Lions – GRC 147; 207 80; 200 Monaco et al., 1999
Gulf of Lions – Open slope 204 900 Monaco et al., 1999
Alboran Sea – WAG 345; 365 400; 500 Fabres et al., 2002
BGD
2, 551–580, 2005 Efficiency of the silicate pump at a coastal site K. Leblanc et al. Title Page Abstract Introduction Conclusions References Tables Figures J I J I Back CloseFull Screen / Esc
Print Version Interactive Discussion
EGU
Figure 1
SOFi
3°E 4°E 5°E 6°E 42°N 42.5°N 43°N 43.5°N 44°N Marseille 56 m 142 m Gulf of Lions
a
b
Bottom ballast Accoustic release ANDERAA current meter PPS 5/2 sediment trap ANDERAA current meter PPS 5/2 sediment trap Buoy 162 m Mooring lineBGD
2, 551–580, 2005 Efficiency of the silicate pump at a coastal site K. Leblanc et al. Title Page Abstract Introduction Conclusions References Tables Figures J I J I Back CloseFull Screen / Esc
Print Version Interactive Discussion
EGU
Figure 2
Amount of biogenic silica in each cup (in mmol Si)
0 2 4 6 8 10 % di ss o lution 0 20 40 60 80 100
Fig. 2. Percentage of the dissolved silicon fraction (from silicic acid measurements) in each
BGD
2, 551–580, 2005 Efficiency of the silicate pump at a coastal site K. Leblanc et al. Title Page Abstract Introduction Conclusions References Tables Figures J I J I Back CloseFull Screen / Esc
Print Version Interactive Discussion
EGU
Figure 3
Sep Oct Nov Dec Jan Feb Mar Apr May Jun Jul Aug Sep Oct Nov Dec
Mas s fl u x ( in mg m -2 d -1 ) 0 1000 2000 3000 4000 Surface trap (56 m) Bottom trap (142 m)
Fig. 3. Total mass flux in mg m−2 d−1 of dry weight in the surface trap (56 m) and the bottom
BGD
2, 551–580, 2005 Efficiency of the silicate pump at a coastal site K. Leblanc et al. Title Page Abstract Introduction Conclusions References Tables Figures J I J I Back CloseFull Screen / Esc
Print Version Interactive Discussion
EGU
Figure 4
Sep Oct Nov Dec Jan Feb Mar Apr May Jun Jul Aug Sep Oct Nov Dec
Opal f lux ( in mg Si O2 m -2 d -1 ) 0 25 50 75 100 125 150 175 200 Surface trap (56 m) Bottom trap (142 m) Opal c ontent in surf ace sedi m ent (i n mg S iO 2 per g dry s edi m ent ) 0.0 0.2 0.4 0.6 0.8 1.0 1.2 1.4 1.6 1.8
Fig. 4. Left axis: Opal flux in mg m−2d−1in the surface trap (56 m) and the bottom trap (142 m)
throughout the year. Right axis (triangles): opal content of the sediment surface layer in mg m−2d−1per g dry sediment.
BGD
2, 551–580, 2005 Efficiency of the silicate pump at a coastal site K. Leblanc et al. Title Page Abstract Introduction Conclusions References Tables Figures J I J I Back CloseFull Screen / Esc
Print Version Interactive Discussion
EGU
Figure 5
Sep Oct Nov Dec Jan Feb Mar Apr May Jun Jul Aug Sep Oct Nov Dec
POC flux (in m g C m -2 d -1 ) 0 50 100 150 200 Surface trap (56 m) Bottom trap (142 m)
Fig. 5. Particulate Organic Carbon (POC) flux in mg m−2d−1in the surface trap (56 m) and the
BGD
2, 551–580, 2005 Efficiency of the silicate pump at a coastal site K. Leblanc et al. Title Page Abstract Introduction Conclusions References Tables Figures J I J I Back CloseFull Screen / Esc
Print Version Interactive Discussion
EGU
Figure 6
Sep Oct Nov Dec Jan Feb Mar Apr May Jun Jul Aug Sep Oct Nov Dec
Ca CO 3 fl ux ( in mg Ca CO 3 m -2 d -1 ) 0 200 400 600 800 Surface trap (56 m) Bottom trap (142 m)
Fig. 6. Calcium carbonate (CaCO3) flux in mg m−2d−1in the surface trap (56 m) and the bottom
BGD
2, 551–580, 2005 Efficiency of the silicate pump at a coastal site K. Leblanc et al. Title Page Abstract Introduction Conclusions References Tables Figures J I J I Back CloseFull Screen / Esc
Print Version Interactive Discussion
EGU Figure 7
Sep Oct Nov Dec Jan Feb Mar Apr May Jun Jul Aug Sep Oct Nov Dec
Si :C r a ti o (m ol :m o l) 0.0 0.1 0.2 0.3 0.4 0.5 0.6 0.7 0.8 0.9 1.0 Surface trap (56 m) Bottom trap (142 m)
Fig. 7. Si:C molar ratios of the settling material in the surface trap (56 m) and the bottom
trap (142 m) throughout the year. The shaded area represents the commonly used ratios of 0.09–0.13 characterizing live diatoms (Brzezinski, 1985).
BGD
2, 551–580, 2005 Efficiency of the silicate pump at a coastal site K. Leblanc et al. Title Page Abstract Introduction Conclusions References Tables Figures J I J I Back CloseFull Screen / Esc
Print Version Interactive Discussion
EGU
Figure 8
POC flux (in mmol C m-2 d-1)
0 2 4 6 8 10 12 14 16 BSi f lux (in mmol Si m -2 d -1) 0.0 0.2 0.4 0.6 0.8 1.0 1.2 y = 0.07x + 0.04 R2 = 0.51
POC flux (in mmol C m-2 d-1)
0 2 4 6 8 10 12 14 16 18 BSi flux (in m m ol Si m -2 d -1) 0.0 0.5 1.0 1.5 2.0 2.5 3.0 3.5 Surface trap (56 m) Bottom trap (142 m) y = 0.18x - 0.04
R2 = 0.95 Fig. 8. Correlations between the
POC and BSi molar fluxes for in the surface trap (56 m) and the bottom trap (142 m) for all avail-able paired data.
BGD
2, 551–580, 2005 Efficiency of the silicate pump at a coastal site K. Leblanc et al. Title Page Abstract Introduction Conclusions References Tables Figures J I J I Back CloseFull Screen / Esc
Print Version Interactive Discussion
EGU
Figure 9
Ditylum brightwelli, Pseudonitzschia sp.
a
Chaetoceros curvisetum Bacteriastrum sp. Chaetoceros curvisetum Biddulphia mobiliensis Coscinodiscus sp Pseudo-nitzschia sp. Dytilum brightwelli Pseudo-nitzschia sp. Dytilum brightwelli Thalassionema sp. Chaetoceros sp.b
Dytilum brightwelli Pleurosigma sp. Pleurosigma sp. Pseudo-nitzschia sp.Fig. 9. (a) Photographs of the content of the collecting cup at 56 m on 25 February 2000, when
the largest peak of opal was recorded. The sample was primarily constituted of Chaetoceros
sp. chains and large Coscinodiscus sp.
BGD
2, 551–580, 2005 Efficiency of the silicate pump at a coastal site K. Leblanc et al. Title Page Abstract Introduction Conclusions References Tables Figures J I J I Back CloseFull Screen / Esc
Print Version Interactive Discussion
EGU
Figure 9
Ditylum brightwelli, Pseudonitzschia sp.
a
Chaetoceros curvisetum Bacteriastrum sp. Chaetoceros curvisetum Biddulphia mobiliensis Coscinodiscus sp Pseudo-nitzschia sp. Dytilum brightwelli Pseudo-nitzschia sp. Dytilum brightwelli Thalassionema sp. Chaetoceros sp.b
Dytilum brightwelli Pleurosigma sp. Pleurosigma sp. Pseudo-nitzschia sp. Dictyocha fibulaFig. 9. (b) Photographs of the content of the collecting cup at 142 m on 17 February 2000,
when the largest peak of opal was recorded. The sample was primarily constituted of Dytilum