HAL Id: hal-00317082
https://hal.archives-ouvertes.fr/hal-00317082
Submitted on 1 Jan 2002
HAL is a multi-disciplinary open access
archive for the deposit and dissemination of
sci-entific research documents, whether they are
pub-lished or not. The documents may come from
teaching and research institutions in France or
abroad, or from public or private research centers.
L’archive ouverte pluridisciplinaire HAL, est
destinée au dépôt et à la diffusion de documents
scientifiques de niveau recherche, publiés ou non,
émanant des établissements d’enseignement et de
recherche français ou étrangers, des laboratoires
publics ou privés.
during geomagnetic storms
D. Buresova, J. Lastovicka, D. Altadill, G. Miro
To cite this version:
D. Buresova, J. Lastovicka, D. Altadill, G. Miro. Daytime electron density at the F1-region in Europe
during geomagnetic storms. Annales Geophysicae, European Geosciences Union, 2002, 20 (7),
pp.1007-1021. �hal-00317082�
Geophysicae
Daytime electron density at the F1-region in Europe during
geomagnetic storms
D. Buresova1, J. Lastovicka1, D. Altadill2, and G. Miro3
1Institute of Atmospheric Physics, Bocni II, 141 31 Prague 4, Czech Republic
2Observatori de l’Ebre, 43 520 Roquetes, Taragona, Spain
3INTA/CEDEA Atmospheric Sounding Station ‘El Arenosillo’, Mazagon, 21 130 Huelva, Spain
Received: 27 September 2001 – Revised: 25 March 2002 – Accepted: 23 April 2002
Abstract. This study attempts to demonstrate changes in the ionospheric F1-region daytime ionization during geomag-netic storms. The F1-region is explored using available data from several European middle latitude and lower latitude ob-servatories and a set of geomagnetic storms encompassing a range of seasons and solar activity levels. The results of anal-ysis suggest systematic seasonal and partly latitudinal differ-ences in the F1-region response to geomagnetic storm. The pattern of the response of the F1-region at higher middle lat-itudes, a decrease in electron density, does not depend on the type of response of the F2-region and on solar activity. A brief interpretation of these findings is presented.
Key words. Ionosphere (ionospheric disturbances; mid-latitude ionosphere
1 Introduction
Geomagnetic storms are the most important space weather phenomenon from the point of view of impact on the global
ionosphere-atmosphere system. They create complicated
changes in the complex morphology of the electric fields, temperature, winds and composition, and affect all iono-spheric parameters. There are numerous publications on the effect of geomagnetic storms on the ionosphere, e.g. among the recent are those by Rees (1995), Pr¨olss (1995), Buon-santo (1999), Richmond (2000), Danilov and Lastovicka (2001).
This paper deals with the daytime electron density analy-sis at the fixed heights of 160–190 km. This range of heights is the part of the bottomside ionosphere, where under some conditions the F1-layer occurs separately (Ratcliffe, 1956). Further in the text, the term ”F1-region“ or ”F1 heights“ in-stead of the term ”F1-layer” will be used. The reason is that the F1-layer is not developed as a separate layer (i.e. on iono-grams as a ledge on an electron density profile) in winter un-der undisturbed conditions at middle latitudes. On the other
Correspondence to: D. Buresova ([email protected])
hand, the F1-layer is developed even in winter during suffi-ciently strong geomagnetic storms, according to our experi-ence.
Considering different composition and the spectrum of the UV reaching each ionospheric region, according to altitude, the D-, E-, F1- and F2-regions all have their own unique structural characteristics (Ondoh and Marubashi, 2001), and therefore we could expect the different response of each re-gion to storm-induced disturbances. Earlier work of Ratcliffe and Weekes (1960) gave some references on lowering foF1 under ionospheric storm conditions. King (1961) presented a simple F1-F2 transition region model seeking to describe the chemistry changes better under disturbed conditions. By converting the theoretical model and presenting it as sets of curves or “overlays”, which were compared directly with the ionograms, King and Lawden (1964) introduced a possibility of how to obtain practical information about the bottomside ionosphere without using inversion techniques. King (1966, 1967) described in an outline how disturbances in the auro-ral regions could give rise to atmospheric waves, which then cause an increase in the recombination rate at F1 heights at middle latitudes. Rishbeth and Garriott (1969) summarized and commented on these papers.
In general, the F1-region of the ionosphere has been stud-ied much less than the F2- and E-regions, partially due to its lower importance for the ionospheric propagation of ra-dio waves and its prediction. As a consequence of that, the geomagnetic storm effects on the F1-region have recently been studied very scarcely. For instance, the review papers by Buonsanto (1999) and Pr¨olss (1995) did not deal with them at all. Lastovicka (1996) reviewed in brief geomag-netic storm effects on the lower ionosphere, middle atmo-sphere and tropoatmo-sphere, and another review paper by Danilov and Lastovicka (2001) only briefly mentioned a few papers that had been dealing with geomagnetic storm effects at the F1 heights. Buresova and Lastovicka (2001) analyzed the effects of a few geomagnetic storms in electron density at F1 heights during daytime, based on data of three European
of substantial spring/autumn asymmetry of storm effects at heights of 180 and 190 km.
The geomagnetic storm effects on the F1-region
(150 ∼ 200 km) are substantially weaker than those in the F2-region (above 200 km) and in the lower ionosphere (below about 100 km). The storm effects in the F2-region ionosphere are predominantly the ionospheric response to storm effects in the thermosphere, and the effects in the lower ionosphere are predominantly caused by the
storm-associated precipitating energetic particles. At the
F1 heights, the influence of both changes in the neutral atmosphere and ionization and photochemical processes can play important roles due to the shorter lifetime of free electrons compared with the F2-region. Transport processes of ionization are not very important below 200 km (Rishbeth
and Garriott, 1969). Their role in the overall behaviour
of the F1-layer during geomagnetic storms is substantially less important than in the F2-layer, again basically due to the shorter lifetime of electrons. Regarding changes in the neutral atmosphere, they can play a role mainly in the upper part of the F1-region, both changes in the neutral composition and in the total neutral density.
Strong longitudinal and latitudinal asymmetries or the completely different storm-induced disturbance behaviour of the ionospheric F2-region above two comparable locations are frequently observed (Pr¨olss, 1995; Buresova and Las-tovicka, 2001). Moreover, the distribution of storm effects
may vary substantially from one event to the other. To
present the situation for F1-region, data from a few Euro-pean stations from higher middle and lower middle latitudes for different seasons and different solar activity levels are an-alyzed. We are fully aware of the storm dynamics and signif-icant effects on the ionosphere at high-latitudes. Extensive analysis of the latitudinal dependence of the storm effects on the F1-region is the aim of our future investigations.
The aim of this study is to deepen the knowledge of the re-sponse of the ionospheric F1-region to geomagnetic storms by broadening the analyses done in previous investigations with more data from other storms, from other seasons and
stations, and under various levels of solar activity. This
analysis reveals among others the summer/winter asymme-try rather than the spring/autumn asymmeasymme-try in the geomag-netic storm effects at F1 heights. Some hints/constraints for interpretation are provided.
2 Data and methods
Data from ionosondes located at Warsaw (52.2◦N, 21.2◦E),
Chilton (51.7◦N, 358.7◦E), Pruhonice (50◦N, 14.6◦E),
Ebro (40.8◦N, 0.5◦E) and Arenosillo (37.1◦N, 353.2◦E)
ionospheric stations are used. For some events, data
from four stations are available, for other events only
data from three are available. All ionospheric, as well
as geomagnetic data, are in UT. For Warsaw, Pruhon-ice, Arenosillo and Ebro LT = UT + 1 h (even though so-lar time is about UT for Spanish stations), for Chilton
LT = UT. All solar and geomagnetic data have been taken from: http://www.sec.noaa.gov/majordomo archive.cgi and http://www.ises-spaceweather.org.
Basic data applied in further analyses are electron den-sity profiles, inverted from ionograms, and electron densi-ties taken from these profiles at F1-region heights. The elec-tron density profiles had been obtained by a NHPC algo-rithm (Reinisch and Huang, 2001) for digisondes and by the Polynomial Analysis computer program POLAN for classi-cal ionosondes with digitised output, like the ionosonde at Pruhonice. POLAN has a wide range of options to allow for the true-height analysis to be tailored completely to users’ requirements. For true height analysis, the program has been used as a “black box” with only the virtual height data, mag-netic dip angle and the gyrofrequency as required inputs. The resultant true-height profile is sensitive to two approxima-tions, in particular. One of them is the computation start po-sition (at what altitude the electron concentration becomes significant). We have used for the daytime true-height anal-ysis the start position 86 km in altitude. The virtual height of a single layer will be affected by the ionization below it. The ionization in each layer is known from the critical fre-quency, but information about the electron density between the layers cannot be measured by an ionosonde. In order to construct the true-height profile, the valley approximation is a very important point. POLAN approximates the valley us-ing the variation in height and depth of the valley with the time of day, date and latitude. For most routine calculations, by choosing default option 0, POLAN inserts between layers a valley selected from the “standard” family. The width (km) and depth (MHz) of the valley depend on the height of the underlying peak (Titheridge, 1985). For the NHPC algo-rithm, the ionogram traces have been carefully revised, in order to avoid any mistake of the automatic scaling to ob-tain true height electron density profiles. The profiles have been obtained from the base of the E-layer to hmF2 (Huang and Reinisch, 1996) and above (Reinisch and Huang, 2001). They cover the altitude range from 90–350 km. Nevertheless, we restrict our study to the altitude range 160–190 during daytime and the E–F valley region is avoided here.
Six events, listed in Table 1, are analyzed in this paper. One of them is from the year of low solar activity (1996), the others are from the years of high solar activity (1998, 2000, 2001). We deal with electron density variability at the fixed F1-region heights of 160–190 km, in comparison with changes in the F2-layer maximum electron concentra-tion NmF2 during ionospheric storms. Solar and geomag-netic activity indices for each analyzed storm are given in
Table 1. The behaviour of the hourly Dstindex has been used
to define the geomagnetic storm onset hour, and the main and recovery phases of the storm. All events were strong storms
with Dst at about −100 nT or more and with at least two or
three quiet days before the storm onset. Two events were
super storms with Dst lower than −300 nT. The quiet days
Table 1. The analyzed geomagnetic storms
Analyzed Storm Monthly Geomagnetic Storm Maximum
pre-storm and onset sunspot activity indices onset of the
storm period day number hour (UT) storm (UT)
11–17 January 1996 13 January 11.5 4 < Kp< 5, Ap29 03:00 13/10:00 max. Dst(-90) nT 14–22 February 1998 17 Feruary 30.3 6 < Kp< 7, Ap36 13:00 17/22:00 max. Dst (-103) nT 7–14 March 1998 10 March 54.8 6 < Kp< 7, Ap53 11:00 10/21:00 max. Dst (-126) nT 11–18 November 1998 13 November 74.0 5 < Kp< 6, Ap60 02:00 13/18:00 max. Dst (-133) nT 13–19 July 2000 15 July 170.1 8 < Kp< 9, Ap152 16:00 07/15/21:00 max. Dst (-300) nT
29 March-4 April 2001 31 March 113.5 8 < Kp< 9, Ap155 05:00 03/31/08:00 max. Dst (-377) nT
3 Results
The eight events from low solar activity years 1994, 1995 and 1997 for the higher middle latitude stations Chilton and Pruhonice have already been analyzed by Buresova and Las-tovicka (2001). The main results of this analysis are as fol-lows:
1. There is no significant effect of geomagnetic storms on electron density at the F1 heights in the range of 160–190 km during spring, while in autumn there is a substantial effect on the F1-region electron density at 190 km; there is still a well-detectable effect at 180 km, a weak effect at 170 km and no detectable effect at 160 km. The autumn effect consists of a significant de-pletion of electron density during the main phase of the storm.
2. Independent of the sign of the geomagnetic storm effect on NmF2, the effect on the electron density at the higher F1-region altitudes has always been negative, if any at all.
However, all the above storms were basically vernal or au-tumnal events. Therefore, for years of high solar activity, we also add wintertime and summertime events. Two of them are super storms, much stronger than events analyzed by Bu-resova and Lastovicka (2001). The super storms are added to check if conclusions of Buresova and Lastovicka (2001) hold also for super storms. Summer and winter events are added to check if the asymmetry (1) is spring/autumn or sum-mer/winter. Strong geomagnetic storms (not super storms) occur near equinoxes about five times as much as near win-ter or summer solstices; therefore, the number of summer and winter events in our analysis is smaller than that of vernal and autumnal events.
We investigate in detail data of the storms not analyzed
by Buresova and Lastovicka (2001). They are classified
as strong geomagnetic storms (11–17 January 1996, 14– 22 February 1998, 7–14 March 1998 and 11–18 Septem-ber 1998), and two geomagnetic storms (13–19 July 2000 and 29 March 2001–4 April 2001) are classified as super storms, according to Loewe and Pr¨olss (1997).
3.1 Storm of January 1996
This wintertime storm started at about 04:00 on 13 January and achieved its maximum at 11:00. Figure 1a represents
the Dst course for analyzed period. All selected stations
registered the positive storm effect of different magnitude in
NmF2 during the storm maximum day (Fig. 1b). At the same
time, Chilton and Pruhonice stations showed a decrease in the electron density at 190–170 km (Figs. 1c and d). Con-trary to the effect on the upper F1-region for higher mid-dle latitude stations, Ebro practically remained without any changes, and Arenosillo showed an increase in the electron density at 180 and 190 km heights during the storm culmina-tion day. No changes in the electron density were observed at 160 km for all four stations.
3.2 Storm of November 1998
The November 1998 event had its onset at about 02:00 of
13 November. The storm culminated near 18:00 in the
evening, when the Dst index fell down to its minimum
value of −133 nT (Fig. 2a). Warsaw, Pruhonice, Ebro and Arenosillo stations showed a positive effect on the NmF2 dur-ing the storm onset and main phase (Fig. 2b). The course of the electron density at 160–190 km for all stations is plotted in Figs. 2c–f. The electron density at 170, 180 and 190 km for Warsaw and Pruhonice displayed a decrease in different magnitude, and a small insignificant decrease was found also at 160 km. Ebro registered an insignificant, weak effect and Arenosillo registered no effect on the F1-region electron den-sity at the storm maximum day. A peculiar phenomenon is that Arenosillo data present a large positive effect at all
ana-Fig. 1. Storm of January 1996: (a) hourly Dstindices, (b) hourly NmF2 values for Chilton, Pruhonice, Ebro and Arenosillo, (c–f) electron
Fig. 2. Storm of November 1998: (a) hourly Dstindices, (b) hourly NmF2 values for Pruhonice, Warsaw, Ebro and Arenosillo, (c–f) electron
Pruhonice 100 150 200 250 300 350 0 5 10 15 20 N, 105 cm-3 Al ti tu d e , km 1998.11.12 12:00 1998.11.13 12:00 Ebro 100 150 200 250 300 350 0 5 10 15 20 N, 105 cm-3 Al ti tu d e , km 1998.11.12 12:00 1998.11.13 12:00
Fig. 3. The noontime electron density profiles in the F-region (150–350 km) for the storm of November 1998, one day before the storm onset (blue line) and during the storm main phase (red line) for Pruhonice and Ebro. Altitude in km, electron density N in 105cm−3.
lyzed altitudes during the afternoon, one day before and one day after the storm onset.
The electron density profiles plotted in Fig. 3a represent the noontime ionospheric ionization at the heights from 150 to 350 km one day before the storm onset and for the storm maximum day for Pruhonice. The same is plotted for Ebro in Fig. 3b. The plots show a decrease in the F1-region ion-ization during the storm maximum day for Pruhonice and no detectable changes for Ebro, in spite of a strong positive ef-fect at the F2-region heights.
3.3 Storm of February 1998
Figure 4 illustrates the hourly Dst index course and the
re-sults for the Pruhonice, Warsaw, Ebro and Arenosillo
sta-tions. The hourly observations of NmF2 compared with
changes in electron concentration at the heights of 160– 190 km during this winter storm are presented in Figs. 4b– f. The observed variations of NmF2 during daytime hours for 14–16 February are close to each other for the three pre-storm days and any of them may be taken as a reference day. A rather moderate negative storm effect took place during the daytime hours of 18 February for higher middle latitude sta-tions Warsaw and Pruhonice. The relative decrease in elec-tron concentration at 190 and 180 km was larger than that of
NmF2, with some decrease observed at 170 km and a weak
decrease at 160 km. On the other hand, Ebro and Arenosillo
registered an increase in NmF2 during the storm main phase. A moderate decrease was found in the electron density at the fixed F1-region heights before the afternoon of 18 February. The 16 and 18 February midday electron density profiles plotted in Figs. 5a and b for the Pruhonice and Ebro stations illustrate the difference between storm effects at higher and lower European middle latitudes. A stronger effect at the F1 heights and a negative effect in the F2-region are ob-served at higher middle latitudes. A weaker effect at the F1-region heights and a positive effect in the F2-region are observed at lower middle latitudes. February is a typical win-ter month therefore a separated F1-layer was developed only under storm conditions for higher middle latitudes.
3.4 Storm of March 1998
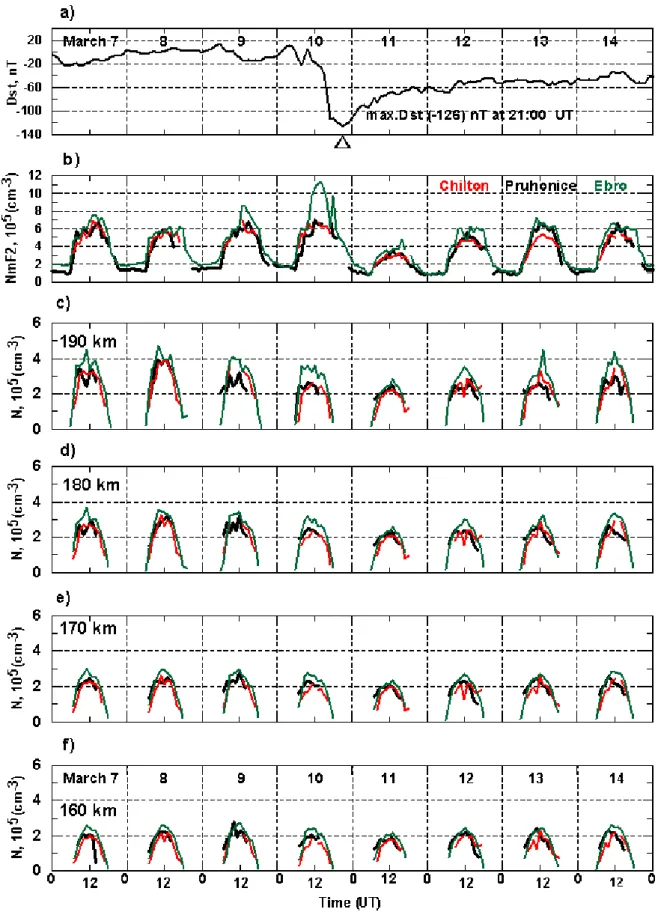
Figures 6a and 6b present the Dstindex course and NmF2 for
Pruhonice, Chilton and Ebro data during the strong
geomag-netic storm of March 1998. The Dstindex began to decrease
rapidly near noon on 10 March and reached its maximum in the late evening hours. The geomagnetic disturbance has a relatively long duration. Both Pruhonice and Chilton stations show a similar negative effect on NmF2 for the storm main phase, a significant decrease in the electron density at 190 and 180 km and a weak decrease in the lower part of the F1-region during the storm main phase (Figs. 6c–f). Contrary to higher middle latitude stations, Ebro data showed an increase in NmF2 at the storm onset day and later negative phase dur-ing the storm main phase. However, in the F1-region, the storm effect at Ebro was quite similar to that of Chilton and Pruhonice.
3.5 Super storm of July 2000
A big solar explosion was observed by SOHO’s ultraviolet telescope EIT on 14 July at 10:12. It started as one of the most intense storms in the 22nd solar cycle. This summer-time event was classified as a super storm. The decrease in
the Dst index started during the afternoon of 15 July, and
selected stations (Chilton, Pruhonice, Ebro and Arenosillo) recorded a large decrease in NmF2 during the storm onset and the main phase (Figs. 7a and 7b). In contrast to the F2-region, the F1-region did not undergo such large changes. A moder-ate decrease in the electron density at 180 and 190 km and a minor decrease below was recorded for all stations (Figs. 7c– f). The F1-region response to the summertime super storm seems to be comparable with the response to the above win-tertime storms, at least at higher middle latitudes.
3.6 Super storm of March–April 2001
The super storm had its onset early in the morning of 31 March and reached maximum intensity after 08:00 UT.
Figure 8a shows the hourly Dst indices for pre-storm, storm
main phase and post-storm period.
All stations (Chilton, Pruhonice, Ebro and Arenosillo) ob-served a substantial decrease in NmF2 for the storm onset day and for the next day (Fig. 8b). Figures 8c–f presents
Fig. 4. Storm of February 1998: (a) hourly Dstindices, (b) hourly NmF2 values for Pruhonice, Warsaw, Ebro and Arenosillo, (c–f) electron density at 190, 180, 170 and 160 km, respectively, for daytime hours for all stations. Time is in UT.
Pruhonice 100 150 200 250 300 350 0 3 6 9 12 15 N, 105 cm-3 A lti tu d e 98/02/16 12:00 98/02/18 12:00 Ebro 100 150 200 250 300 350 0 3 6 9 12 15 N, 105 cm-3 Al ti tu d e , km 98/02/16 12:00 98/02/18 12:00
Fig. 5. The noontime electron density profiles in the F-region (150–350 km) for the storm of February 1998, one day before the storm onset (blue line) and during the storm main phase (red line) for Pruhonice and Ebro. Altitude in km, electron density N in 105cm−3.
the daytime electron density at the fixed F1 heights. The analyzed data shows a similar but stronger effect of the su-per storm compared with the geomagnetic storms of March and November 1998, with a decrease in the daytime electron density at 160–190 km at higher middle latitudes. The lower middle latitude stations Ebro and Arenosillo show a shorter recovery phase for the F1-region electron density in compar-ison with the higher middle latitude stations Pruhonice and Chilton. An interesting feature, which was noticed during the super storm main phase, was that in contrast to the other an-alyzed wintertime geomagnetic storms, the electron density at 170 and 160 km decreased significantly, which indicates a deeper penetration of super storm effects into the F1-region compared to the other strong wintertime storms.
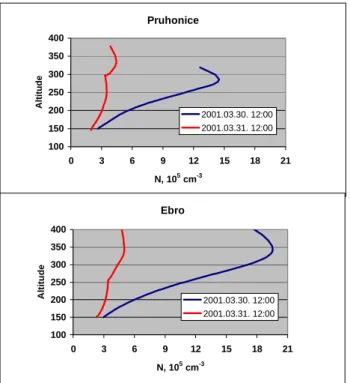
The storm maximum day noontime electron density pro-files for Pruhonice and Ebro are plotted in Figs. 9a and 9b re-spectively. The profiles show clearly the differences between quiet and disturbed ionospheric electron density profiles and the negative super storm effect on the F1-region electron den-sity throughout the F1-region heights. The strong negative effect was also observed in the F2-region at both stations. Since this super storm still belongs to the winter half of the year, the F-region is separated into F1- and F2-layers only under storm conditions.
3.7 Summary of observational results
Some results of Buresova and Lastovicka (2001) have been confirmed but some have been modified as well. The
con-clusion is confirmed that independent of the sign of the geo-magnetic storm effect on NmF2, the effect on electron den-sity at the F1 heights has always been negative, if any at all. This is true for all 14 storms analyzed here and by Bu-resova and Lastovicka (2001), but only for higher middle lati-tudes (Chilton, Pruhonice, Warsaw). For instance, the Febru-ary 1998 geomagnetic storm had a negative phase in the F2-region, whereas other winter events of January 1996, ber 1997 (Buresova and Lastovicka, 2001) and Novem-ber 1998 had a stable, strong positive phase during the storm
main phase. Independent of the storm effect on the
F2-region, the effect on the electron density at the F1 heights was negative for all these storms for the analyzed higher middle latitude stations.
For lower middle latitudes (Ebro and Arenosillo – Spain), the storm effect at the F1 heights is similar to that at higher middle latitudes only for the super storms. It might be a con-sequence of substantial equatorward expansion of the auro-ral zone. For other strong storms, the effects at lower middle latitudes may differ from those at higher middle latitudes. Negative effects, no effects, as well as positive effect (Jan-uary 1996 event – Arenosillo), were observed. There is no evident relation between the effect on NmF2 and on the elec-tron density at the F1-region heights. We plan to analyze more events at European lower middle latitudes, in order to specify better the geomagnetic storm effect pattern of the F1-region.
The other conclusion of Buresova and Lastovicka (2001) about the spring/autumn asymmetry has to be modified. The above results indicate summer/winter asymmetry. There is no significant effect of geomagnetic storms on electron den-sity at the F1 heights in the range of 160–190 km during the summer half of the year (storms of May 1994, May 1995 and May 1997 – Buresova and Lastovicka, 2001), except for the moderate-to-minor effect of the super storm of July 2000 at 160–190 km. On the other hand, in the winter half of the year, there is a substantial effect on the F1-region electron density at 190 km; there is still a well-detectable effect at 180 km, a detectable effect at 170 km and insignificant effect at 160 km, except for the super storm of March–April 2001, with significant effects down to 160 km at higher middle lat-itudes. The winter effect consists of a depletion of electron density during the main phase of the storm. The effects at lower middle latitudes are sometimes weaker and less regu-lar. No event contradicts the idea that the winter-to-summer and summer-to-winter transitions in effects of geomagnetic storms at the F1 heights are centered a few weeks or a cou-ple of days after equinoxes (even though this transition is not expected to be sharp). However, the number of events analyzed near equinoxes is too small for making a final con-clusion about the transition boundary of the F1-region storm response.
The analysis of the two super storms of July 2000 and March-April 2001 indicates for all analyzed higher middle and lower middle latitude stations a deeper penetration of the effects of geomagnetic super storms into the F1-region than in the case of strong storms. Figure 10 shows the differences
Fig. 6. Storm of March 1998: (a) hourly Dst indices, (b) hourly values of NmF2 for Chilton, Pruhonice and Ebro, (c–f) daytime electron density at 190, 180, 170 and 160 km, respectively, for all stations. Time is in UT.
Fig. 7. Results for the July 2000 super storm: (a) hourly Dstindices, (b) hourly values of NmF2 for Chilton, Pruhonice, Ebro and Arenosillo,
Fig. 8. Results for the March–April 2001 super storm: (a) hourly Dst indices, (b) hourly values of NmF2 for Chilton, Pruhonice, Ebro and Arenosillo, (c–f) daytime electron density at 190, 180, 170 and 160 km, respectively, for all stations. Time is in UT.
Pruhonice 100 150 200 250 300 350 400 0 3 6 9 12 15 18 21 N, 105 cm-3 A lti tude 2001.03.30. 12:00 2001.03.31. 12:00 Ebro 100 150 200 250 300 350 400 0 3 6 9 12 15 18 21 N, 105 cm-3 Al ti tu d e 2001.03.30. 12:00 2001.03.31. 12:00
Fig. 9. The noontime electron density profiles in the F-region (150–
350 km) for the super storm of March/April 2001, one day before the storm onset (blue line) and during the storm main phase (red line) for Pruhonice and Ebro. Altitude in km, electron density N in 105cm−3.
between the magnitude of the electron density decrease at the F1-region heights (the differences between the storm main phase and pre-storm quiet days at 11:00–13:00 UT) for the super storm March/April 2001 and the strong storms of Jan-uary 1996, FebrJan-uary 1998, March 1998 and November 1998 for winter, and for the strong storm of May 1997 (Buresova and Lastovicka, 2001) and the super storm of July 2000 for summer. It is evident that the effect of the super storm penetrates deeper and is of larger magnitude than the effect of the strong storms for both summer and winter, and for both Pruhonice and Ebro (higher and lower middle latitudes). Thus, the depth of storm effect penetration into the F1-region seems to depend on the intensity of storms. The inaccuracies of measurements, ionogram scaling and inversion techniques make small effects, like those for strong storms in summer at 160–180 km (Fig. 10), insignificant and rather questionable.
Buresova and Lastovicka (2001) studied the effect of ge-omagnetic storms on the F1-region electron density only for events observed under low solar activity conditions. Here, we add events observed under higher and high solar activ-ity conditions. The pattern of the geomagnetic storm effects on the F1-region electron density does not appear to change with the solar activity (solar cycle).
4 Discussion
Rishbeth and Garriott (1969) described the photochemical processes in the bottomside ionosphere and placed the
tran-Pruhonice (winter storms)
160 km 160 km 170 km 170 km 180 km 180 km 190 km 190 km 0 0.5 1 1.5 2 2.5 E le c tr on de ns it y N , 1 0 5 cm -3
Pruhonice (summer storms)
160 km 160 km 170 km 170 km 180 km 180 km 190 km 190 km 0 0.5 1 1.5 2 2.5 E le c tr on de ns it y N , 1 0 5 cm -3
Ebro (winter storms)
160 km 160 km 170 km 170 km 180 km 180 km 190 km 190 km 0 0.5 1 1.5 2 2.5 E le c tr on de ns it y N , 1 0 5 cm -3
Fig. 10. The magnitude of the electron density decrease at the
F1-region heights (the difference between the storm main phase and pre-storm quiet days at 11:00–13:00 UT) for the super storm of July 2000 versus the May 1997 strong storm (analyzed by Bu-resova and Lastovicka, 2001) for Pruhonice (top panel), and for the super storm of March/April 2001 versus the strong storms of Jan-uary 1996, FebrJan-uary 1998, March 1998 and November 1998 (mid-dle panel – Pruhonice; bottom panel – Ebro). Full columns – super storms; dashed columns – strong storms.
sition height between the region dominated by molecular
ions (NO+ and O+2) and the region where the atomic ions
O+dominate, at about 160–200 km. Ondoh and Marubashi
(2001) mentioned that the transition height lies at about 180 km. At lower altitudes the electron loss rate is propor-tional to the square of the electron density. At higher
alti-tudes, where O+ is the dominant ion species, the electron
loss rate is proportional to electron densities.
There are a couple of physical processes which could con-tribute to the observed effect of geomagnetic storms in the state of the ionosphere at the bottomside F-region at mid-dle latitudes. During disturbed conditions, the changes in the gaseous composition of the thermosphere expand from
high-latitudes equatorward and affect the ionization produc-tion and loss balance. The effect depends on the magnetic latitude. The composition disturbance zone is marked by a significant increase in the molecular nitrogen density and a concurrent depletion in the atomic oxygen density (Pr¨olss, 1995). At the altitudes above the transition height, the ion-ization loss rate depends on the density of molecular gases
N2and O2 and an increase in these gases will directly
in-crease the loss rate of ionization (Pr¨olss, 1995).
According to current theories of the geomagnetic storms, the F-region response depends strongly on the type of
ther-mospheric circulation. The summer or winter type
de-termines if the regular (solar-induced) and storm-induced meridional winds coincide or have opposite directions. In the case of the winter type of circulation during the daytime, the circulation is poleward and it hinders the storm-induced circulation from expanding considerably toward middle itudes. The storm-induced equatorward wind at middle lat-itudes is weakened and an additional component of the up-ward vertical wind appears. In the F2-region, it leads fre-quently to an increase in the electron density (positive phase) due to the shift in peak altitude to higher heights with a smaller electron loss rate. In the higher altitudes of the
F1-region, it should lead to the depletions of the O/N2ratio and
thus, to a decrease in ionization. In the case of the sum-mer type of circulation, the two circulations coincide and the
gases with a decreased O/N2ratio are moved from the high
latitudes into middle latitudes.
At the F1 heights, the influence of both changes in the neutral atmosphere ionization and photochemical processes play important roles due to the shorter lifetime of free elec-trons compared with the F2-region. Ionization transport pro-cesses do not seem to play an important role in the over-all behaviour of the F1-region during geomagnetic storms at middle latitudes compared with the F2-region, again ba-sically due to the shorter lifetime of electrons. Changes in the neutral atmosphere can play a role primarily in the up-per part of the F1-region, and at auroral and subauroral lat-itudes, both changes in the neutral composition and in the total neutral density. Measurements of the total neutral den-sity near 200 km by the SETA satellite have revealed an in-crease in density during geomagnetic storms under daytime
conditions at latitudes of 60–80◦by about 50–70%, with
pen-etration of a substantial increase almost to the equator in the summer hemisphere (Forbes et al., 1996). The neutral den-sity at these latitudes may sometimes increase as much as by more than 100% (Rhoden et al., 2000). At middle latitudes, the change in neutral density is smaller, but may nevertheless play some role. The changes in both neutral density and neu-tral composition (followed by a change in ion composition) result in a decrease in electron density at fixed heights within the F1-region, thus, being in accord with observations. An-other factor is a storm-related increase in the flux of energetic particles. However, this increase should lead to an increase in electron density, which contradicts our daytime observa-tions at higher middle latitudes. Therefore, the increase in the particle ionization rate is not a dominant mechanism for
behaviour of the daytime ionosphere at the F1 heights during geomagnetic storms. On the other hand, it may play a role at night, contributing to rather positive effects observed at night by rockets (Geller et al., 1975).
During disturbed conditions, the transition height at high-latitudes can move upward quickly and substantially, as il-lustrated by model calculations of Millward et al. (1993).
Using the MSIS-86 model, Maruyama (2001–Fig. 3.16) calculated the annual variation of the noontime densities
of major neutral species, n(O) and n(N2), at an altitude of
200 km for 1989. The ratio n(O)/n(N2) < 1 in mid-summer,
June and July, which means that the transition height is lo-cated above 200 km. In the remaining months, in the summer
half of the year, the ratio n(O)/n(N2) indicates that the
tran-sition height is below, but not much below 200 km. On the
other hand, the ratio n(O)/n(N2) indicates the winter
transi-tion height to be well below 200 km. Let us assume that the upward motion of the transition height is an important mech-anism responsible for the effects of the geomagnetic storms at the F1-region heights (the electron loss rate is consider-ably larger below than above the transition height). Then, the summer-winter differences in the height of transition region can explain qualitatively the observational summer-winter differences in the effect of the strong geomagnetic storms at the F1-region heights at higher middle latitudes (insignificant effect in summer versus evident decrease in electron density in winter).
As stated above, the wintertime background circulation does not allow for the propagation of compositional distur-bance from high-latitudes to lower latitudes well and, thus, diminishes or stops the upward motion of the transition boundary. This is probably the reason why sometimes we observe the geomagnetic storm effects on the F1-region at higher middle latitudes but not at Ebro and Arenosillo.
Another important result of our investigations is the evi-dence of the deeper penetration of the effects of super storms into the F1-region compared to strong storms. This cannot be accounted for by the upward motion of the transition height. One process, which probably contributes to the deeper pen-etration of the super storm effects, is the equatorward shift of the auroral zone, which is larger for these super storms. For instance, during the super storm of February 1986, the Pruhonice station was in the auroral zone for a couple of hours (Boska and Pancheva, 1989).
A detailed analysis of the potential mechanisms of the ge-omagnetic storm effects on the F1-region is under way. It is not the purpose of this paper. However, the above results make us capable of defining some constraints for the mecha-nisms. Any mechanism must be able to explain:
(a) Why the geomagnetic storm effect on the electron den-sity at the F1 heights at higher middle latitudes has al-ways been negative, independent of the sign of the storm effect on the F2-region (NmF2)?
(b) Why there is such a pronounced winter/summer asym-metry in the strength of geomagnetic storm effects at the F1 heights?
5 Conclusions
An investigation of the effects of six strong geomagnetic storms and super storms on the ionosphere at F1 heights in Europe has been based on electron density profiles inferred from ionograms recorded at the higher middle and lower middle latitudes stations Pruhonice, Chilton, Warsaw, Ebro, Arenosillo. The four main results, based on the above inves-tigations and the results of Buresova and Lastovicka (2001), are as follows:
– Independent of the sign of the geomagnetic storm effect on NmF2, the effect on electron density at the F1 heights at European higher middle latitudes (Chilton, Pruhon-ice, Warsaw) has always been negative, if any at all. At European lower middle latitudes (Ebro, Arenosillo), the effects at F1-region heights are weaker and less regular. – There is a substantial summer/winter asymmetry of geo-magnetic storm effects on the F1-region electron density at European higher middle latitudes. There is no sig-nificant effect of geomagnetic storms on electron den-sity at the F1 heights in the range of 160–190 km during the summer half of the year, except for the moderate-to-minor effect of the super storm of July 2000. On the other hand, in the winter half of the year, at higher middle latitudes, there is a substantial effect on electron density at 190 km; there is still a well-detectable effect at 180 km, a detectable effect at 170 km and no signif-icant effect at 160 km, except for the super storm of March–April 2001, which caused evident changes down to 160 km. The winter effect consists of a depletion of electron density during the main phase of the storm (ex-cept for Arenosillo, January, 1996).
– The geomagnetic super storm effects penetrate deeper into the F1-region than the effects of the analyzed strong storms. This is consistent with King (1967), who found the depth of the storm-induced disturbance penetration into the F1-region to be dependent on the magnitude of the geomagnetic storm.
– The pattern of the geomagnetic storm effects on the F1-region electron density does not appear to change with solar activity (solar cycle).
The investigations under way are focused on more detailed analysis of possible factors and mechanisms, which could contribute to the observed effects of geomagnetic storms at the F1 heights. The upward motion of the boundary between the region dominated by molecular ions and the region dom-inated by atomic ions evidently plays a role.
Acknowledgements. This work has been supported by grant No
A30 42 102 of the Grant Agency of the Academy of Sciences of the Czech Republic. Part of the work of the Spanish team is supported by Spanish project BTE2000–0825. Authors thank both anonymous referees for helpful comments.
The Editor in Chief thanks A. Mikhailov and P. Wilkinson for their help in evaluating this paper.
References
Boska, J. and Pancheva, D.: Ionospheric effects of the extreme so-lar activity of February 1986, Handbook for MAP, 29, 231–235, 1989.
Buonsanto, M. J.: Ionospheric storms – A review, Space Sci. Revs., 88, 563–601, 1999.
Buresova, D. and Lastovicka, J.: Changes in the F1-region elec-tron density during geomagnetic storms at low solar activity, J. Atmos. Solar-Terr. Phys., 63, 537–544, 2001.
Danilov, A. D. and Lastovicka, J.: Effects of geomagnetic storms on the ionosphere and atmosphere, Int. J. Geomagn. Aeronomy, 1 (3), 2001, http://eos.wdcb.ru/ijga/peer/gai93312/gai93312.htm. Forbes, J. M., Gonzalez, R., Marcos, F. A., Revelle, D., and Parish, H.: Magnetic storm response of lower thermosphere density, J. Geophys. Res., 101, 2313–2319, 1996.
Geller, M. A., Smith, L. G., and Voss, H. D.: Analysis of nighttime E-region winds and ionization production, Radio Sci., 10, 335– 345, 1975.
Huang, X. and Reinisch, B. W.: Vertical electron density profiles from the digisonde network, Adv. Space Res., 18, (6)121–(6)129, 1996.
King, G. A. M.: Analysis of the F1–F2 transition region, J. Geo-phys. Res., 66, 2757–2762, 1961.
King, G. A. M.: The ionospheric disturbance and atmospheric waves. I-General discussion, J. Atmos. Terr. Phys., 28, 957–963, 1966.
King, G. A. M.: The ionospheric disturbance and atmospheric waves. II-The F-region at Campbell Island, J. Atmos. Terr. Phys., 29, 161–168, 1967.
King, G. A. M. and Lawden, M. D.: Analysing the F-region with overlays, J. Atmos. Solar-Terr. Phys., 26, 1273–1280, 1964. Lastovicka, J.: Effects of geomagnetic storms in the lower
iono-sphere, middle atmosphere and tropoiono-sphere, J. Atmos. Terr. Phys., 58, 831–843, 1996.
Loewe, C. A. and Pr¨olss, G. W.: Classification and mean behaviour of magnetic storm. J. Geophys. Res., 102, 14 213–14 218, 1997. Maruyama, T.: The ionosphere, in: Science of Space Environment, (Eds) Ondoh, T. and Marubashi, K., Ohmsha, Ltd., Tokyo, Japan, 73–104, 2001.
Millward, G. H., Quegan, S., Moffett, R. J., Fuller-Rowell, T. J., and Rees, D.: A modelling study of the coupled ionospheric and ther-mospheric response to an enhanced high-latitude electric field event, Planet. Space Sci., 41, 45–56, 1993.
Ondoh, T. and Marubashi, K.: Overview of the science of the space environment, in: Science of Space Environment, (Eds) Ondoh, T. and Marubashi, K., Ohmsha, Ltd., Tokyo, Japan, 1–27, 2001. Pr¨olss, G. W.: Ionospheric F-region storms, in: Handbook of
Atmo-spheric Electrodynamics 2, (Ed) Volland, H., CRC Press, Boca Raton, FL, 195–248, 1995.
Ratcliffe, J. A.: The formation of the ionospheric layers F1 and F2, J. Atmos. Terr. Phys., 8, 260–269, 1956.
Ratcliffe, J. A. and Weekes, K.: The ionosphere, in: Physics of the Upper Atmosphere, (Ed) Ratcliffe, J. A., Academic Press, New York and London, 377–470, 1960.
Rees, D.: Observations and modelling of ionospheric and thermo-spheric disturbances during major geomagnetic storms: a review, J. Atmos. Terr. Phys., 57, 1433–1457, 1995.
Reinisch, B. W. and Huang, X.: Deducing top-side profiles and total electron content from bottom side ionograms, Adv. Space Res., 27, 23–30, 2001.
geomagnetic and solar variability on lower thermospheric den-sity, J. Atmos. Solar-Terr. Phys., 62, 999–1013, 2000.
Richmond, A. D.: Upper-atmospheric effects of magnetic storms: a brief tutorial, J. Atmos. Solar-Terr. Phys., 62, 1115–1127, 2000. Rishbeth, H. and Garriott, O. K.: Introduction to Ionospheric
Physics, Academic Press, New York and London, 1969. Titheridge, J. E.: Ionogram analysis with the generalized program
POLAN, Report UAG-93, WDC for Solar-Terrestrial Physics, Washington D. C., 1985.