HAL Id: hal-00302686
https://hal.archives-ouvertes.fr/hal-00302686
Submitted on 30 Mar 2007HAL is a multi-disciplinary open access
archive for the deposit and dissemination of sci-entific research documents, whether they are pub-lished or not. The documents may come from teaching and research institutions in France or abroad, or from public or private research centers.
L’archive ouverte pluridisciplinaire HAL, est destinée au dépôt et à la diffusion de documents scientifiques de niveau recherche, publiés ou non, émanant des établissements d’enseignement et de recherche français ou étrangers, des laboratoires publics ou privés.
Evaluation of ECMWF water vapour analyses by
airborne differential absorption lidar measurements: a
case study between Brasil and Europe
H. Flentje, A. Dörnbrack, A. Fix, G. Ehret, E. Hólm
To cite this version:
H. Flentje, A. Dörnbrack, A. Fix, G. Ehret, E. Hólm. Evaluation of ECMWF water vapour analyses by airborne differential absorption lidar measurements: a case study between Brasil and Europe. Atmospheric Chemistry and Physics Discussions, European Geosciences Union, 2007, 7 (2), pp.4405-4425. �hal-00302686�
ACPD
7, 4405–4425, 2007
Evaluation of ECMWF water vapour by DIAL
H. Flentje et al. Title Page Abstract Introduction Conclusions References Tables Figures ◭ ◮ ◭ ◮ Back Close
Full Screen / Esc
Printer-friendly Version Interactive Discussion
EGU
Atmos. Chem. Phys. Discuss., 7, 4405–4425, 2007 www.atmos-chem-phys-discuss.net/7/4405/2007/ © Author(s) 2007. This work is licensed
under a Creative Commons License.
Atmospheric Chemistry and Physics Discussions
Evaluation of ECMWF water vapour
analyses by airborne differential
absorption lidar measurements: a case
study between Brasil and Europe
H. Flentje1, A. D ¨ornbrack2, A. Fix2, G. Ehret2, and E. H ´olm3
1
Deutscher Wetterdienst, Hohenpeißenberg, Germany
2
DLR Institut f ¨ur Physik der Atmosph ¨are, Oberpfaffenhofen, Germany
3
European Centre For Medium Range Weather Forecasts, Reading, UK
Received: 8 March 2007 – Accepted: 22 March 2007 – Published: 30 March 2007 Correspondence to: H. Flentje (harald.flentje@dwd.de)
ACPD
7, 4405–4425, 2007
Evaluation of ECMWF water vapour by DIAL
H. Flentje et al. Title Page Abstract Introduction Conclusions References Tables Figures ◭ ◮ ◭ ◮ Back Close
Full Screen / Esc
Printer-friendly Version Interactive Discussion
EGU
Abstract
Airborne Differential Absorption Lidar (DIAL) observations of tropospheric water vapour over Brazil and between Brazil and south Europe in March 2004 are compared to 1-hourly short-range forecasts of the European Centre for Medium Range Weather Forecasts (ECMWF). On three along-flight sections across the tropical and sub-tropical
5
Atlantic between 28◦S and 37◦N humidity fields are observed which represent typical low latitude conditions. H2O mixing ratios vary between q≈0.01–0.1 g/kg in the upper troposphere (UT), in subsiding air layers and a stratospheric intrusion. They reach up to 0.5 g/kg at UT levels inside the Intertropical Convergence Zone (ITCZ) and exceed 10 g/kg at lower levels. Back-trajectories reveal that the humidity fields are largely
10
determined by transport.
The observed water vapour distributions are properly reproduced by 1-hourly ECMWF Integrated Forecasting System (IFS) short-range forecasts at T799/L91 spec-tral resolution. As transport largely determines the water vapour fields, the IFS skill is to a large extend based on a good representation of the dynamics. The mean
rela-15
tive bias accounts to few percent (0%, 3% and 6% for the three sections) being about or even below the accuracy of the DIAL measurements of 5%. The larger deviations between analyses and observations on small scales are due to relative spatial shifts of features with large gradients. The correlation is quite high, ranging between 0.71 and 0.88. Over sea the analyses tend to underestimate the PBL height. At mid-levels
20
near deep convection the mid-troposphere tends to be analyzed too humid indicating shortcomings in the convection parameterization. Humid tendencies are also found in the upper troposphere, particularly in tropical regions.
1 Introduction
Atmospheric water vapour plays a key role for the global climate (e.g. Chahine, 1992),
25
ACPD
7, 4405–4425, 2007
Evaluation of ECMWF water vapour by DIAL
H. Flentje et al. Title Page Abstract Introduction Conclusions References Tables Figures ◭ ◮ ◭ ◮ Back Close
Full Screen / Esc
Printer-friendly Version Interactive Discussion
EGU
processes. It is the primary greenhouse gas (Manabe and Weatherald, 1967, Shine and Sinha, 1991). The latent heat transformations associated with its phase changes alter the atmospheric stability, control the cloud formation (e.g. Kiehl and Trenberth, 1997; Koop et al., 2004; K ¨archer, 2004) and the evolution of weather systems. Rela-tive humidity regulates radiaRela-tive and chemical properties of aerosols and as the prime
5
source of atmospheric hydroxyl radicals, WV plays a key role in removing both, par-ticles and trace gases from the atmosphere. In spite of its low concentration in the stratosphere, VW alters the radiation balance (Forster and Shine, 1999; Gettleman et al., 2004) and controls the formation of particles, e.g. affecting ozone depletion (Kirk-Davidoff et al., 1999). Thus, accurate (re)analyses of water vapour are essential not
10
only for numerical weather forecast but also for atmospheric process studies, climate modelling, trend analyses and other issues associated with the hydrological cycle.
During the last years, climate research centres and weather services as the Eu-ropean Centre for Medium Range Weather Forecasts (ECMWF) have advanced the humidity analyses e. g. by an improved formulation of the background error
covari-15
ance model for humidity (H ´olm et al., 2002), by introducing data from several additional satellite instruments (cf. Moreau et al., 2003), by the revised use of radiosondes (Leit-erer et al., 2005), surface humidity data according to Nash (2002) and by advancing the parameterization of moist physics (e.g. Tompkins et al., 2004). In the ECMWF 4D-Var assimilation system the specific impact of different humidity data extends to
20
forecasts in the medium range, not only for precipitation and water vapour but also for other prognostic variables like geopotential, wind and temperature (Andersson et al., 2004, 2006). As the analysis mostly adds only a few percent to the background fields of the assimilation scheme (increments are <5% of the fields in general), humidity ob-servations should be as little biased as possible. However, most assimilated humidity
25
observing systems currently exceed an absolute calibration of 10%, an error which propagates to the total analysis and forecast errors.
In this paper we investigate the accuracy of operational ECMWF humidity analy-ses by a detailed comparison with long-range airborne Differential Absorption Lidar
ACPD
7, 4405–4425, 2007
Evaluation of ECMWF water vapour by DIAL
H. Flentje et al. Title Page Abstract Introduction Conclusions References Tables Figures ◭ ◮ ◭ ◮ Back Close
Full Screen / Esc
Printer-friendly Version Interactive Discussion
EGU
(DIAL) observations. DIAL H2O observations possess a small bias which essentially depends on the accuracy of the utilized H2O spectral absorption cross sections and is
little sensitive to atmospheric conditions (Poberaj et al., 2002). The skill of operational ECMWF analyses and mesoscale numerical simulations in reproducing DIAL obser-vations along the North Atlantic storm track region in May/June 2002 was reported
5
previously (Flentje et al., 2005). Here we extend our analysis to water vapour obser-vations over Brazil and the tropical and sub-tropical Atlantic Ocean between Brazil and Europe in mid March 2004. To this end, 1-hourly ECMWF forecasts at a spectral reso-lution of T799/L91 were especially produced and ECMWF-based backward trajectories are calculated.
10
The following section sketches the experiment, the DIAL and data evaluation, Sect. 3 presents the measurements, the ECWMF analyses and their matching in the context of meteorological conditions. In Sect. 4, implications of skill and bias of ECMWF water vapour analyses are discussed and summarized in Sect. 5.
2 Experimental
15
Water vapour and particle backscatter were measured by an airborne Differential Ab-sorption Lidar (DIAL) during one research flight on 10 March 2004 and two consecutive transfer flights on 14 March 2004 with a total distance of about 7000 km. The flight on 10 March went from SE Brazil (22◦S, 47◦W) south toward the Atlantic Ocean and re-turned at 28◦S (Fig. 1). On 14 March the Atlantic Ocean was crossed from Fernando
20
de Naronha, Brazil (5◦S, 36◦W) to South Spain (37.2◦N, 6◦W) with stopover in Sal (Cape Verde Islands). The DIAL was installed onboard a Falcon 20E research aircraft
(http://www.dlr.de/FB/OP) in nadir viewing arrangement, thus profiling the troposphere
from the ground up to∼10 km altitude.
As described by Ehret et al. (1999) and Poberaj et al. (2002), the DLR H2O-DIAL
25
DIAL transmitter was based on a Nd:YAG pumped, injection seeded KTP-OPO (Op-tical Parametric Oscillator). Other than there, the DIAL during TROCCINOX was
op-ACPD
7, 4405–4425, 2007
Evaluation of ECMWF water vapour by DIAL
H. Flentje et al. Title Page Abstract Introduction Conclusions References Tables Figures ◭ ◮ ◭ ◮ Back Close
Full Screen / Esc
Printer-friendly Version Interactive Discussion
EGU
erated at 925 nm achieving a pulse energy of 18 mJ. A spectral purity of more than 99.5% was mostly achieved during in-flight operation which allowed accurate calcu-lation of the water vapour concentrations. The 925 nm spectral region fits for water vapour measurements from the planetary boundary layer (PBL) up to the upper tropo-sphere with a resolution of about 500 m in the vertical and few kilometres horizontally.
5
In the nadir-viewing configuration the range-induced signal decrease was partly com-pensated by the increasing H2O-absorption in the lower troposphere. Only the range
where the crossed optical depth remains below 0.9 (one way) is evaluated. System-atic errors were due to uncertainties in the water vapour absorption line cross sec-tion (estimated 5%, Giver et al., 2000), laser spectral impurity (1–2%), atmospheric
10
temperature uncertainty (<1%), and the Rayleigh-Doppler absorption line broadening (<1.5% after correction). They summed up to about 5.5% in total. The random er-ror of the DIAL measurements depended on the horizontal and vertical averaging of the individual shots. In case the DIAL observations’ spatial resolution corresponded to that of the ECMWF analyses, the random error remained well below 10%. Aerosol
15
properties are expressed as particle backscatter ratio, defined as the total (particle + molecular) backscatter coefficient βλdivided by the molecular backscatter coefficient
Rλ = (βp,λ + βm,λ)/βm,λ (λ denoting the wavelengths). The spatial resolution depends
on the signal strength (i.e. the aerosol backscatter ratio) and typically amounts to about 100 m horizontally and few 10 m vertically.
20
Backward trajectories were calculated with the Lagrangian Analysis Tool (LA-GRANTO) software package developed at the ETH Z ¨urich by Wernli and Davis (1997). They were driven by 6-hourly ECMWF-analyses at T511/L60 spectral resolution and allowed for following the development of meteorological parameters along the flow. For a more detailed comparison with the DIAL water vapour observations, 1-hourly
short-25
range forecasts from the ECMWF integrated forecast system (IFS) were especially produced with a spectral resolution of T799/L911. These humidity fields were first in-terpolated onto a regular 0.3◦×0.3◦latitude-longitude grid, afterwards on the individual
1
ACPD
7, 4405–4425, 2007
Evaluation of ECMWF water vapour by DIAL
H. Flentje et al. Title Page Abstract Introduction Conclusions References Tables Figures ◭ ◮ ◭ ◮ Back Close
Full Screen / Esc
Printer-friendly Version Interactive Discussion
EGU
flight paths of the DLR Falcon.
3 Results
3.1 Meteorological conditions
The airborne H2O-DIAL observations during the international TROCCINOX campaign
(http://www.pa.op.dlr.de/troccinox) reflected typical humidity features of the sub-tropical
5
and tropical troposphere and may be regarded as representative for a wide range of low latitude conditions. The humidity field observed on 10 March 2004 was affected by an active mesoscale convective system (MCS) near Sao Paolo (–23.5◦S, 46.7◦W) which formed in a moderately labile flow from central South America. Around the MCS, scattered Cumulunimbus (Cb) clouds reached up to about 8–12 km. Over the Atlantic
10
Ocean, the PBL was stably stratified and only a few shallow cumulus clouds penetrated its capping inversion. The first transfer flight on 14 March scanned humid tropical and drier sub-tropical air with a transition zone in the free troposphere at about 9–13◦N. Figure 1 depicts the intertropical convergence zone northeast of Brazil which is asso-ciated with the tropical Hadley circulation. The second transfer flight roughly followed
15
the axis of a trough along the northwest African coast and finally entered a cyclone over Gibraltar. A stratospheric intrusion dipping down below 700 hPa along the flight path was associated with the polar jet stream. With 0.06 g/kg (100 µmole/mole) being the threshold for stratospheric air, the hygropause outside the intrusion was located above 200 hPa in the tropics and in regions of large scale frontal lifting. Meteosat 8
20
imagery depicts dust spreading out from the African continent in the easterly low-level trade winds (the gray colour in Fig. 1).
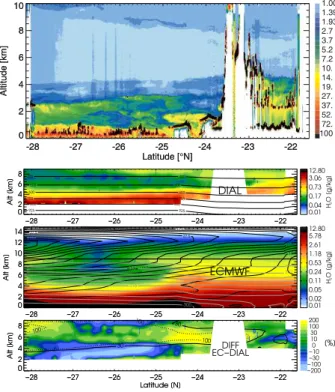
3.2 Mesoscale Convective System on 10 March 2004
In the particle backscatter observations from 10 March (Fig. 2a) Cumulunimbus clouds extending above the flight level indicated the MCS in the Sao Paolo area. Owing to
ACPD
7, 4405–4425, 2007
Evaluation of ECMWF water vapour by DIAL
H. Flentje et al. Title Page Abstract Introduction Conclusions References Tables Figures ◭ ◮ ◭ ◮ Back Close
Full Screen / Esc
Printer-friendly Version Interactive Discussion
EGU
beam attenuation no measurements were possible beyond thick clouds. The marine PBL was stably stratified and partly hazy with β≈3–15 due to enhanced aerosol trans-port from the land, e.g. the Sao Paolo plume near 24–25◦S. It reached up to about 3 km over sea and to 4 km a.g.l. over land. The expected sharp H2O gradient at the
top of the moist PBL top was probably smoothed by the vertical resolution of the DIAL
5
profiles of∼500 m. There, the water vapour mixing ratio dropped 2 orders of magni-tude from q≈10 g/kg to q ≈0.1 g/kg between 3 and 5 km altitude. The convective cells over land transported humid PBL air to the upper troposphere where it contributed to the humidity outflow from the continent (cf. Fig. 1) appearing downwind as a layer with enhanced humidity q ≈0.5 g/kg above 7 km altitude. Thus, over sea there were
10
three distinct layers from the ground to the upper troposphere with differing H2O
mix-ing ratios. Sporadic water vapour artefacts (e.g. at 25◦S in 8–10 km) occurred due to electronic interferences.
Generally, the observed humidity patterns were correctly reproduced by the ECMWF analysis as shown in Figs. 2b–d. While the DIAL observations were limited to heights
15
below the aircraft cruising level (∼10 km), the ECMWF analysis was depicted up to the hygropause. The largest negative bias occurred at the top of the moist PBL which was analyzed roughly 1 km too shallow. The largest positive bias was found at the dry intermediate layer between convective in- and outflow. This layer did not reach as much towards the MCS in the analyses as observed by the DIAL. Another humidity
20
uplift pattern analyzed in the very south of the flight track was only weakly indicated by the observations. The mean bias of the ECMWF re-analysis with respect to the DIAL observations is about f =6.2±0.1%, with a standard error σn of 0.1. It was
calcu-lated using a Gaussian fit (f (x)=A0exp(−z 2
/2) with z=(x-A1)/A2, A1 and A2 being the
centre and width of the Gaussian) of the frequency distribution of relative differences
25
∆q=2*(qECMWF – qDIAL)/(qECMWF+qDIAL) as displayed in Fig. 6. The linear correlation
ACPD
7, 4405–4425, 2007
Evaluation of ECMWF water vapour by DIAL
H. Flentje et al. Title Page Abstract Introduction Conclusions References Tables Figures ◭ ◮ ◭ ◮ Back Close
Full Screen / Esc
Printer-friendly Version Interactive Discussion
EGU
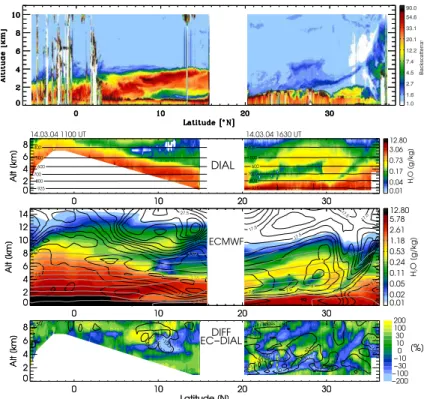
3.3 Hadley cell on 14 March 2004
During the first flight on 14 March the Hadley cell was crossed (aslant) as indicated in Fig. 3c. Organized convection near the equator, evident as Cb clouds in Fig. 3a, lifted moist boundary layer air to the upper troposphere (note that clouds are circled for security reasons). The humidity uplift calculated by the ECMWF IFS reaches up
5
to 14 km corresponding to the observation that convection during the TROCCINOX campaign was generally limited to heights below 12–14 km. A moist layer extended from 20◦N to beyond the equator where H2O mixing ratios q≈0.5 g/kg reach up to 4 km
near the Cape Verde Islands (23◦W, 16◦N) and above 9 km near 0◦N. As the H2O
absorption line saturated in the lower part of this layer, this region is masked in Fig. 3.
10
Similar as on 10 March an upper tropospheric humid layer (q≈0.5 g/kg) extended from the equator till 15◦N while the mid-troposphere is dry (q<0.1 g/kg).
Again the water vapour distribution along the flight path was reproduced in detail by the ECMWF analyses as shown in Fig. 3d except for the location of the dry intermedi-ate layer which extended further towards the convection cells in the observations. The
15
top of the moist lower tropospheric layer closely follows the observations. In the upper middle troposphere (8–9 km) the H2O mixing ratios of the ECMWF model tend to be
too high, i.e. too much water vapour was transported up to these levels by the model. On the other hand, the extremely dry regions observed below the upper humid layer were not captured by the model, a behaviour also noted by Ovarlez and v. Velthoven
20
(1997) in other cases. According to the frequency distribution of relative differences ∆q in Fig. 6, the overall q-bias of the ECMWF analyses for this flight is again small positive and amounts to f=3±0.07%, the standard error σn being 0.07. The large ∆q
tails on both sides of the distribution correspond to small shifts of analyzed vs. ob-served humidity structures emphasized by large gradients at their boundaries. The
25
ACPD
7, 4405–4425, 2007
Evaluation of ECMWF water vapour by DIAL
H. Flentje et al. Title Page Abstract Introduction Conclusions References Tables Figures ◭ ◮ ◭ ◮ Back Close
Full Screen / Esc
Printer-friendly Version Interactive Discussion
EGU
3.4 Stratospheric Intrusion on 14 March 2004
The second flight section on 14 March exhibited smaller spatial scales due to stirring of dry and humid air masses. The hygropause (as defined by the q=0.06 g/kg contour) was observed several kilometres lower than in the tropics and sub-tropics. In the north a narrow intrusion of air originating from the upper troposphere and lower stratosphere
5
(UT/LS) tilted downward and southward from 35◦N to 30◦N with H2O mixing ratios below 0.2 g/kg. The moist maritime PBL (q>2 g/kg) extended over the lowest 1.5– 2 km, except where convection in the cold sector of the Gibraltar cyclone (35–37◦N) lifted humid air up to 4 km.
Even this rather complex H2O distribution was properly analyzed by the ECMWF
10
IFS. According to a Gaussian fit of the differences-frequency distribution the total bias was estimated to be f≈0.0±0.08, the standard error σnbeing 0.06. The linear
correla-tion coefficient is again quite high, r=0.84, however the differences exhibit considerable small scale variability (Fig. 3d), typical for small spatial shifts in presence of large gradi-ents. The shape of the intrusion was captured well by the ECMWF model but the slope
15
of its axis was a bit too large. Particularly in the south, the PBL height was analyzed slightly too low and the corresponding air too moist.
4 Discussion
The ECMWF analyses closely reproduced the observed water vapour distributions with a total bias of few percent for the described cases. This value is in the range of the
esti-20
mated uncertainty of the DIAL measurements. Noticeable regularities in the deviations were imposed by the spatial and temporal resolution, the coverage/accuracy of as-similated water vapour observations, small scale transport/mixing and (micro-)physical parameterizations of the model. In order to minimize errors caused by the linear tem-poral interpolation between the operationally available 6 hourly ECMWF analyses, we
25
apply-ACPD
7, 4405–4425, 2007
Evaluation of ECMWF water vapour by DIAL
H. Flentje et al. Title Page Abstract Introduction Conclusions References Tables Figures ◭ ◮ ◭ ◮ Back Close
Full Screen / Esc
Printer-friendly Version Interactive Discussion
EGU
ing the IFS. This significantly reduced the displacements of analyzed vs. observed features due to the rapidly evolving weather systems. Displacements are evident in Figures 2d and 3d as enhanced differences |∆q| which are aligned with the edges of water vapour features, partly adjacent with alternating signs. The|∆q|-values may be large in the presence of large gradients, but overall do not effect the mean bias
sig-5
nificantly. Instead, these displacements broaden the frequency distribution of relative differences as shown in Fig. 6. The standard deviation σ=66±0.1% of the frequency distribution for the 10 March flight is significantly larger than for the two transfer flights which amounts to σ=32±0.07% and σ=38±0.08%, respectively. This discrepancy is due to the larger areas with negative bias at the PBL top and positive bias at mid-levels
10
near the MCS. However, the widths of all frequency distributions are significantly lower than those calculated for the linearly interpolated difference fields resulting from the operational 6-hourly analyses (75% and 90% for the 1st and 2nd flight on 14 March 2004).
As the PBL height tends to be analyzed too low (also noted by H ´olm et al., 2002) and
15
owing to the large water vapour gradient, the PBL top and the associated entrainment zone is a distinctive location of enlarged analysis errors. The analyses do not indicate rapid ongoing air mass changes or changes in vertical motion. Moreover, the PBL depth over sea usually exhibits no strong diurnal cycle which both would give rise to displacements of the PBL height due to temporal lags or spatial shifts. This suggests
20
that the lack of constraint by the assimilated temperature and humidity profiles may be a main reason for the displaced PBL heights. In correspondence with the observations, the modelled depth of the entrainment zone is strongly affected by nearby convection.
The upper PBL seems slightly too moist in the ECMWF analyses compared to the available H2O DIAL data (cf. Sect. 3.3), probably indicating shortcomings in the
param-25
eterization of convection and moist processes in the IFS. Furthermore, the analyzed H2O mixing ratios exceeded the observations in the dry intermediate layers between
convective in- and outflow regions for both the MCS on 10 March and the Headley cell on 14 March. Either the turbulent mixing out of convective towers at mid-levels was
ACPD
7, 4405–4425, 2007
Evaluation of ECMWF water vapour by DIAL
H. Flentje et al. Title Page Abstract Introduction Conclusions References Tables Figures ◭ ◮ ◭ ◮ Back Close
Full Screen / Esc
Printer-friendly Version Interactive Discussion
EGU
overestimated or the convection depth may be underestimated for parts of the cells causing an unrealistic outflow at mid levels. The cirrus outflow at the top in each case was captured quite well by the ECMWF model.
On synoptic scales the humidity fields are largely controlled by transport of back-ground humidity rather than constrained by the assimilated water vapour information
5
(Bengtsson et al., 2004). Therefore, the good agreement of the ECMWF IFS with the lidar observations confirms the accuracy of the model transport scheme. Particularly, the 2nd transfer flight to Spain demonstrates the model’s skill to reproduce intense dynamical processes. Larger deviations only occur on small scales or in the vicin-ity of rapid evolvement. This is indicated by the correspondence of the large
model-10
observation difference with the humidity change rate between the two successive op-erational analyses before and after the respective flights. The latter is indicated in Figs. 2d and 3d by contours of 30% and 100% change in water vapour mixing ratio be-tween the analyses at 06:00 and 12:00 UT for the 1st flight and at 12:00 and 18:00 UT for the 2nd flight.
15
The intensity of the stirring processes resulting in the observations during the transfer flights on 14 March 2004 is revealed by 9-d backward trajectories as shown in Figs. 4 and 5. On both flights, the water vapour distribution closely reflects the ongoing trans-port. Thus on the other hand, the good agreement between analyzed and observed humidity fields confirms the accuracy of the trajectories (i.e. the model dynamics) and
20
gives trust in the related parameters.
The spatial resolution of the analyzed water vapour fields T799 (about 25 km) is the highest available from the current model system. There the analyses have already been interpolated from their original reduced Gaussian grid to a regular lat-lon grid, which has little effect in tropical regions. The fields at T511/L60 resolution interpolated
25
from 6-hourly analyses exhibited slightly larger shifts of structures, which however is an issue of temporal interpolation rather than sensitivity to the different resolutions. In the horizontal direction, the observed DIAL H2O fields were degraded from their original
ACPD
7, 4405–4425, 2007
Evaluation of ECMWF water vapour by DIAL
H. Flentje et al. Title Page Abstract Introduction Conclusions References Tables Figures ◭ ◮ ◭ ◮ Back Close
Full Screen / Esc
Printer-friendly Version Interactive Discussion
EGU
In the vertical, the observed DIAL H2O data were extracted at the ECMWF model levels. An exact tuning of the resolution is difficult since the model’s effective vertical resolution does not only depend on the spacing of the model levels but also on the sub-grid and numerical diffusion. Furthermore, the vertical resolution can be diminished by the implicit smoothing of vertical gradients by horizontal averaging of tilted structures
5
which depends on the aspect ratio of vertical to horizontal atmospheric scales. Possible 3-D inhomogeneity induced uncertainties become large in cases when the crossed structures exhibit large gradients in the direction perpendicular to the flight section. A cross flight section air flow moves such inhomogeneities through the observation plane in a hardly predictable manner. If the structures flowing through the observation
10
plane are continuous, these gradients may be expressed in terms of local humidity tendencies between subsequent analyses dates. The results shown in Figs. 2d and 3d indicate the largest deviations from the observations on small scales are caused by this effect.
5 Summary
15
Specially calculated ECMWF water vapour analyses at T799/L91 spectral resolution have been evaluated by airborne DIAL H2O observations over Brazil and from Brazil to
south Europe in mid-March 2004. The two-dimensional along-flight sections crossing the tropical and sub-tropical Atlantic Ocean (5◦S–37◦N) exhibit large humidity gradi-ents with H2O mixing ratios covering three orders of magnitude between q≈0.01 to
20
q≈10 g/kg. The observed water vapour distributions were properly analyzed by the ECMWF IFS at T799/L91 spectral resolution. As transport largely determines the wa-ter vapour fields, the IFS skill is to a large extend due to good representation of the dynamical processes. The mean relative bias accounted to few percent (0±0.08%, 3±0.07% and 6±0.1% for the three sections) and thus was about or even below the
25
estimated accuracy of the DIAL measurements of 5%. The linear correlation coeffi-cients were quite high, being r=0.71, r=0.88 and r=0.84 for the 10 March flight and the
ACPD
7, 4405–4425, 2007
Evaluation of ECMWF water vapour by DIAL
H. Flentje et al. Title Page Abstract Introduction Conclusions References Tables Figures ◭ ◮ ◭ ◮ Back Close
Full Screen / Esc
Printer-friendly Version Interactive Discussion
EGU
two 14 March flights, respectively. The larger deviations between analyses and obser-vations occurred on small scales and were caused by spatial shifts in the presence of large gradients. Over sea the analyses tend to underestimate the PBL height, probably indicating a lack of constraint by available water vapour profiles for the assimilation. Near deep convection the mid-troposphere tended to be too humid, indicating
short-5
comings in the convection parameterization. Moreover, humid tendencies are found in the upper troposphere, particularly in tropical regions.
Acknowledgements. This work was funded by the ESA in the contract no. 10832/03/NL/FF and the European Community in the frame of the TROCCINOX project (EVK2-2001-00087).
References
10
Andersson, E., H ´olm, E., and Th ´epaut, J. N.: Impact studies of main types of conventional and satellite humidity data. Proc. 3rd WMO Workshop on “The Impact of Various Observing Systems on Numerical Weather Prediction”, Alpbach, Austria, 9–12 March 2004, edited by: B ¨ottger, H., Menzel, P., and Pailleux, J., WMO/TD No. 1228, 32–44, 2004.
Andersson, E., H ´olm, E., Bauer, P., Beljaars, A., Kelly, G. A., McNelly, A. P., Simsons, A. J.,
15
Thepaud, J.-N., and Tompkins, A. M.: Analysis and forecast impact of the main humidity observing systems, ECMWF Technical Memorandum No. 493, ECMWF, Reading 2006. Bengtsson, L., Hodges, K. I., and Hagemann, S.: Sensitivity of large scale atmospheric
anal-yses to humidity observations and its impact on the global water cycle and tropical and extratropical weather systems in ERA40, Tellus, 56A, 202–217, 2004.
20
Chahine, M. T.: The hydrological cycle and its influence on climate, Nature, 359, 373–380, 1992.
Ehret, G., Hoinka, K. P., Stein, J., Fix, A., Kiemle, C., and Poberaj, G.: Low-Stratospheric Water Vapour Measured by an Airborne DIAL, J. Geophys. Res., 104(D24), 31 351–31 359, 1999. Flentje, H., D ¨ornbrack, A., Ehret, G., Fix, A., Kiemle, C., Poberaj, G., and Wirth, M.: Water
25
vapour heterogeneity related to stratospheric intrusions over the northern Atlantic revealed by airborne water vapour, J. Geophys. Res., 110, D03115, doi:10.1029/2004JD004957, 2005.
ACPD
7, 4405–4425, 2007
Evaluation of ECMWF water vapour by DIAL
H. Flentje et al. Title Page Abstract Introduction Conclusions References Tables Figures ◭ ◮ ◭ ◮ Back Close
Full Screen / Esc
Printer-friendly Version Interactive Discussion
EGU
Forster, P. M. de F. and Shine, K. P.: Radiative forcing and temperature trends from stratospheric ozone depletion, J. Geophys. Res., 102, 10 841– 10 855, 1997.
Gettelman, A., Forster, P. M. de F., Fujiwara, M., Fu, Q., V ¨omel, H., Gohar, L. K., Johanson, C., and Ammerman, M.: Radiation balance of the tropical tropopause layer, J. Geophys. Res., 109, D07103, doi:10.1029/2003JD004190, 2004.
5
Giver, L. P., Chackerian Jr., C., and Varanasi, P.: Visible and near-infrared H216O line intensity corrections for HITRAN-96, J. Quant. Spectrosc. Radiat. Transfer, 66, 101, 101–105, 2000. H ´olm, E., Andersson, E., Beljaars, A., Lopez, P., Mahfouf, F., Simmons, A., and Th ´epaut,
J.-N.: Assimilation and modeling of the hydrological cycle: ECMWF’s status and plans, ECMWF Technical Memorandum No. 383, ECMWF, Reading 2002.
10
K ¨archer, B. and Solomon, S.: On the composition and optical extinction of particles in the tropopause region, J. Geophys. Res., 104, 27 441–27 459, 1999.
Kiehl, J. T. and Trenberth, K. E., Earth’s annual global mean energy budget, Bull. Am. Meteorol. Soc., 78, 197–208, 1997.
Kirk-Davidoff, D. B., Anderson, J. G., Hintsa, E. J., and Keith, D. W.: The effect of climate
15
change on ozone depletion through changes in stratospheric water vapour, Nature, 402, 399–401, 1999.
Koop, T., Luo, B. P., Tsias, A., and Peter, T.: Water activity as the determinant for homogeneous ice nucleation in aqueous solutions, Nature, 406, 611–614, 2000.
Lawrence, M. G., Hov, ¨O., Beekmann, M., Brandt, J., Elbern, H., Eskes, H., Feichter, H., and
20
Takigawa, M.: The Chemical Weather, Environ. Chem., 2, 6–8, doi:10:1071/EN05014, 2005. Leiterer, U., Dier, H., Nagel, D., Naebert, T., Althausen, D., Franke, K., Kats, A., and Wagner, F.:
A correction method for RS-80A Humicap profiles and their validation by Lidar backscattering profiles in tropical cirrus clouds, J. Atmos. Oceanic. Tech. (JTECH), 22(1), 18–29, 2005. Manabe, S. and Weatherald, R.: Thermal equilibrium of the atmosphere with a given
distribu-25
tion of atmospheric humidity, J. Atmos. Sci., 24, 241–259, 1967.
Moreau, E., Lopez, P., Bauer, P., Tompkins, A. M., Janiskova, M., and Chevallier, F.: Variational retrieval of temperature and humidity profiles using rain rates versus microwave brightness temperatures, ECMWF Technical Memorandum No. 412,http://www.ecmwf.int), 2003. Nash, J.: Review of test results on the accuracy of radiosonde relative humidity sensors, Proc.
30
ECMWF/GEWEX workshop on “Humidity Analysis”, Reading, UK, 8–11 July 2002, 117–123, 2002.
ACPD
7, 4405–4425, 2007
Evaluation of ECMWF water vapour by DIAL
H. Flentje et al. Title Page Abstract Introduction Conclusions References Tables Figures ◭ ◮ ◭ ◮ Back Close
Full Screen / Esc
Printer-friendly Version Interactive Discussion
EGU
retrieved from ECMWF analyses during the POLINAT experiment, J. Appl. Meteorol., 36, 1329–1335, 1997.
Poberaj, G., Fix, A., Assion, A., Wirth, M., Kiemle, C., and Ehret, G.: All-Solid-State Airborne DIAL for Water Vapour Measurements in the Tropopause Region: System Description and Assessment of Accuracy, Appl. Phys. B, 75, 165–172, 2002.
5
Shine, K. P. and Sinha, A.: Sensitivity of the earth’s climate to height dependent changes in the water vapour mixing ratio, Nature, 354, 382–384, 1991.
Tompkins, A. M., Bechtold, P., Beljaars, A. C. M., Benedetti, A., Cheinet, S., Janiskov ´a, M., K ¨ohler, M., P. Lopez, and Morcrette, J.-J.: Moist physical processes in the IFS: progress and plans, ECMWF Tech Memo., 452, pp 91., 2004.
10
Wernli, H. and Davis, H. C.: A Lagrangian-based analysis of extratropical cyclones. I: The method and some applications, Q. J. R. Meteorol. Soc., 123, 467–489, 1997.
ACPD
7, 4405–4425, 2007
Evaluation of ECMWF water vapour by DIAL
H. Flentje et al. Title Page Abstract Introduction Conclusions References Tables Figures ◭ ◮ ◭ ◮ Back Close
Full Screen / Esc
Printer-friendly Version Interactive Discussion
EGU Fig. 1. METEOSAT 8 VIS channel showing clouds and dust from central Africa on 14 March
2004, 12:00 UT and down right ECHAM model simulation of upper tropospheric water vapour on 10 March 2004, 18:00 UT, each with aircraft flight track from Fernando de Naronha (Brasil) to Seville (Spain) via Sal (Cape Verde Islands) and crossing the south Brazilian coast near Sao Paolo.
ACPD
7, 4405–4425, 2007
Evaluation of ECMWF water vapour by DIAL
H. Flentje et al. Title Page Abstract Introduction Conclusions References Tables Figures ◭ ◮ ◭ ◮ Back Close
Full Screen / Esc
Printer-friendly Version Interactive Discussion EGU −28 −27 −26 −25 −24 −23 −22 0 2 4 6 8 Alt [km] −28 −27 −26 −25 −24 −23 −22 0 2 4 6 8 Alt [km] 400 400 500 500 600 600 700 700 800 800 925 925 0.01 0.04 0.17 0.73 3.06 12.80 H2 O [g/kg] DIAL −28 −27 −26 −25 −24 −23 −22 0 2 4 6 8 10 12 14 Alt [km] −28 −27 −26 −25 −24 −23 −22 0 2 4 6 8 10 12 14 Alt [km] 7.5 7.5 7.5 17.5 17.5 17.5 17.5 27.5 27.5 37.5 300 316 316 332 332 0.01 0.02 0.05 0.11 0.24 0.53 1.18 2.61 5.78 12.80 H2 O [g/kg] ECMWF −28 −27 −26 −25 −24 −23 −22 Latitude [N] 0 2 4 6 8 Alt [km] 30 30 100 100 100 −28 −27 −26 −25 −24 −23 −22 Latitude [N] 0 2 4 6 8 Alt [km] [%] DIFF EC−DIAL −200 −100 −30 −10 0 10 30 100 200
Fig. 2. Backscatter ratio R (a) and water vapour mixing ratio q in g/kg (b) along DIAL flights on
10 March 2004, 18:00–20:00 UT using log colour scales. Isolines are pressure. H2O profiles are averaged over 700 m vertically and≈3 km horizontally. (c): ECMWF T799/L91 operational analysis on sigma levels (∼30), interpolated in space and time on the flight tracks. Contours are potential temperature (grey), horizontal wind speed (black) and potential vorticity at 2, 2.5 and 3 PVU. (d): Difference of water vapour mixing ratios qECMWF– qDIAL/ (qECMWF/2 + qDIAL/2)
from the upper panels on linear colour scale with black contours of relative q-change (30%, 100%) between 06:00 UT/12:00 UT and 12:00 UT/18:00 UT. Note the different altitude range of the ECMWF panel.
ACPD
7, 4405–4425, 2007
Evaluation of ECMWF water vapour by DIAL
H. Flentje et al. Title Page Abstract Introduction Conclusions References Tables Figures ◭ ◮ ◭ ◮ Back Close
Full Screen / Esc
Printer-friendly Version Interactive Discussion EGU 0 10 20 30 0 2 4 6 8 Alt [km] 0 10 20 30 0 2 4 6 8 Alt [km] 14.03.04 1100 UT 14.03.04 1630 UT 400 500 600 700 800 925 400 500 600 700 800 925 0.01 0.04 0.17 0.73 3.06 12.80 H2 O [g/kg] 0 10 20 30 0 2 4 6 8 10 12 14 Alt [km] 0 10 20 30 0 2 4 6 8 10 12 14 Alt [km] 7.5 7.5 7.5 7.5 7.5 7.5 17.5 27.5 7.5 7.5 7.5 7.5 17.5 17.5 17.5 17.5 17.5 300 316 332 300 316 0.01 0.02 0.05 0.11 0.24 0.53 1.18 2.61 5.78 12.80 H2 O [g/kg] 0 10 20 30 Latitude [N] 0 2 4 6 8 Alt [km] 30 30 100 −30 −30 −30 30 30 30 30 30 30 30 100 100 100 0 10 20 30 Latitude [N] 0 2 4 6 8 Alt [km] [%] DIAL ECMWF DIFF EC−DIAL −200 −100 −30 −10 0 10 30 100 200
Fig. 3. Backscatter ratio R (a) and water vapour mixing ratio q in g/kg (b) along DIAL flights
on 14 March 2004, 11:00–14:00 UT and 16:30–19:00 UT using log colour scales. Isolines are pressure. H2O profiles are averaged over 700 m vertically and≈3 km horizontally. (c): ECMWF T799/L91 operational analysis on sigma levels (∼30), interpolated in space and time on the flight tracks. Contours are potential temperature (grey), horizontal wind speed (black). (d): Difference of water vapour mixing ratios qECMWF – qDIAL/ (qECMWF/2 + qDIAL/2) from the upper
panels on linear colour scale with black contours of relative q-change (30%, 100%) between 06:00 UT/12:00 UT (southerly flight) and 12:00 UT/18:00 UT (northerly flight). Note the different altitude range of the ECMWF panel.
ACPD
7, 4405–4425, 2007
Evaluation of ECMWF water vapour by DIAL
H. Flentje et al. Title Page Abstract Introduction Conclusions References Tables Figures ◭ ◮ ◭ ◮ Back Close
Full Screen / Esc
Printer-friendly Version Interactive Discussion
EGU Fig. 4. 7-day ECMWF backward trajectories arriving at the DLR Falcon flight track at (a)
ACPD
7, 4405–4425, 2007
Evaluation of ECMWF water vapour by DIAL
H. Flentje et al. Title Page Abstract Introduction Conclusions References Tables Figures ◭ ◮ ◭ ◮ Back Close
Full Screen / Esc
Printer-friendly Version Interactive Discussion
EGU Fig. 5. 9-day ECMWF backward trajectories arriving at the DLR Falcon flight track at (a)
ACPD
7, 4405–4425, 2007
Evaluation of ECMWF water vapour by DIAL
H. Flentje et al. Title Page Abstract Introduction Conclusions References Tables Figures ◭ ◮ ◭ ◮ Back Close
Full Screen / Esc
Printer-friendly Version Interactive Discussion EGU H2O BIAS (ECMWF−DIAL) −200 −100 0 100 200 Difference [%] 0.0 0.2 0.4 0.6 0.8 1.0 Norm. Frequency Bias: 6% H2O BIAS (ECMWF−DIAL) −200 −100 0 100 200 Difference [%] 0.0 0.2 0.4 0.6 0.8 1.0 Norm. Frequency − − Leg 1 ________ Leg 2 Bias_L1: 3% Bias_L2: 0%
Fig. 6. Frequency distributions of normalized relative differences 2*(qECMWF –
qDIAL)/(qECMWF+qDIAL) shown in Figs. 2 and 3, panels C along the flights on 10 (left) and 14