HAL Id: hal-00303944
https://hal.archives-ouvertes.fr/hal-00303944
Submitted on 10 Oct 2005HAL is a multi-disciplinary open access
archive for the deposit and dissemination of sci-entific research documents, whether they are pub-lished or not. The documents may come from teaching and research institutions in France or abroad, or from public or private research centers.
L’archive ouverte pluridisciplinaire HAL, est destinée au dépôt et à la diffusion de documents scientifiques de niveau recherche, publiés ou non, émanant des établissements d’enseignement et de recherche français ou étrangers, des laboratoires publics ou privés.
Measurements and modelling of I2, IO, OIO, BrO and
NO3 in the mid-latitude marine boundary layer
A. Saiz-Lopez, J. A. Shillito, H. Coe, J. M. C. Plane
To cite this version:
A. Saiz-Lopez, J. A. Shillito, H. Coe, J. M. C. Plane. Measurements and modelling of I2, IO, OIO, BrO and NO3 in the mid-latitude marine boundary layer. Atmospheric Chemistry and Physics Discussions, European Geosciences Union, 2005, 5 (5), pp.9731-9767. �hal-00303944�
ACPD
5, 9731–9767, 2005 Measurements and modelling of trace gases in a coastal marine environment A. Saiz-Lopez et al. Title Page Abstract Introduction Conclusions References Tables Figures J I J I Back Close Full Screen / EscPrint Version Interactive Discussion
EGU Atmos. Chem. Phys. Discuss., 5, 9731–9767, 2005
www.atmos-chem-phys.org/acpd/5/9731/ SRef-ID: 1680-7375/acpd/2005-5-9731 European Geosciences Union
Atmospheric Chemistry and Physics Discussions
Measurements and modelling of I
2
, IO,
OIO, BrO and NO
3
in the mid-latitude
marine boundary layer
A. Saiz-Lopez1, J. A. Shillito2, H. Coe2, and J. M. C. Plane1
1
School of Environmental Sciences, University of East Anglia, Norwich, UK
2
School of Earth, Atmospheric and Environmental Sciences, University of Manchester, Manchester, UK
Received: 26 August 2005 – Accepted: 4 September 2005 – Published: 10 October 2005 Correspondence to: J. M. C. Plane ([email protected])
ACPD
5, 9731–9767, 2005 Measurements and modelling of trace gases in a coastal marine environment A. Saiz-Lopez et al. Title Page Abstract Introduction Conclusions References Tables Figures J I J I Back Close Full Screen / EscPrint Version Interactive Discussion
EGU Abstract
Time series observations of molecular iodine (I2), iodine oxides (IO, OIO), bromine ox-ide (BrO), and the nitrate radical (NO3) in the mid-latitude coastal marine boundary layer (MBL) are reported. Measurements were made using a new long-path DOAS in-strument during a summertime campaign at Mace Head on the west coast of Ireland. I2
5
was detected using the B3Π(0+u)−X1Σxg electronic transition between 535 and 575 nm. The I2 mixing ratio was found to vary from below the detection limit (∼5 ppt) up to a nighttime maximum of 93 ppt. Along with I2, observations of IO, OIO and NO3 were also made during the night. Surprisingly, IO and OIO were detected at mixing ratios up to 2.5 and 10.8 ppt, respectively. A model is employed to show that the reaction
10
between I2 and NO3 is the likely nighttime source of these radicals. The BrO mixing ratio varied from below the detection limit at night (∼1 ppt) to a maximum of 6 ppt in the first hours after sunrise. A model shows that this diurnal behaviour can be explained by halogen recyling in sea-salt aerosol building up photolabile precursors of atomic Br during the preceding night. In the same campaign a zenith sky DOAS was employed
15
to determine the column density variation of NO3 as a function of solar zenith angle (SZA) during sunrise, from which vertical profiles of NO3through the troposphere were obtained. On several occasions a positive gradient of NO3was observed over the first 2 km, possibly due to dimethyl sulphide (DMS) removing NO3at the ocean surface.
1. Introduction
20
Interest in atmospheric halogen chemistry has grown enormously in the past three decades, originally because of its active role in the destruction of stratospheric (Molina and Rowland,1974;Wofsy et al.,1975;Farman et al.,1985) and polar tropospheric (Barrie et al.,1988;Finlayson-Pitts et al.,1990;McConnell et al.,1992;Hausmann and Platt,1994;Honninger and Platt,2002) ozone. However, halogen radicals could play a
25
ACPD
5, 9731–9767, 2005 Measurements and modelling of trace gases in a coastal marine environment A. Saiz-Lopez et al. Title Page Abstract Introduction Conclusions References Tables Figures J I J I Back Close Full Screen / EscPrint Version Interactive Discussion
EGU NO2) and HOx(OH and HO2) chemistry, the oxidation of a range of organic molecules,
and in the formation of ultra-fine particles. These impacts are discussed in greater de-tail below. In the mid-latitude MBL, BrO has recently been detected both by multi-axis DOAS (Leser et al.,2003) and long-path DOAS (Saiz-Lopez et al.,2004a). The source of bromine is almost certainly the release of species such as Br2, BrCl and IBr from
5
sea-salt aerosol, following the uptake from the gas phase, and subsequent aqueous-phase reactions, of hypohalous acids (HOX, where X=Br, I) (Vogt et al.,1996). In semi-polluted areas with higher NOx, the uptake of di-nitrogen pentoxide (N2O5), formed at night by the recombination of the NO3 with NO2, also leads to the release of BrNO2 (Behnke et al., 1994). These heterogeneous mechanisms are supported by the
ob-10
servation that the bromide ions in sea-salt aerosols are substantially depleted (Ayers et al.,1999;Gabriel et al.,2002). Once released into the gas phase, these bromine-containing compounds will photolyse rapidly during the day, and the resulting Br atoms will react fast with O3to form BrO.
Recent measurements of IO and OIO (Alicke et al.,1999;Allan et al.,2000a,2001;
15
Saiz-Lopez and Plane,2004) have confirmed the importance of iodine chemistry in the MBL. The source of atmospheric iodine is the evasion of biogenic iodocarbons such as CH3I, CH2I2, CH2IBr and CH2ICl from both the open ocean and coastal areas ( Carpen-ter et al.,1999). Additionally, the detection of I2 during NAMBLEX indicates that this molecule is probably the major source of atmospheric iodine in certain coastal
loca-20
tions (Saiz-Lopez and Plane,2004). Also, I2would account for the surprising nighttime observations of IO and OIO, since the rate constant between NO3and I2to yield INO3 and I is relatively fast (Chambers et al.,1992). The atomic I produced in this way would rapidly form IO by reaction with O3. A number of studies have proposed iodine as a significant catalyst in tropospheric O3depletion (Jenkin et al.,1985;Davis et al.,1996;
25
McFiggans et al.,2000). BrO and IO also compete effectively with the OH radical in the oxidation of DMS (Saiz-Lopez et al., 2004a;Glasow and Crutzen, 2004), and a very recent study has shown that the HO2/OH ratio in the coastal MBL is significantly altered by IO (Bloss et al.,2005). Another potentially significant aspect of the iodine
ACPD
5, 9731–9767, 2005 Measurements and modelling of trace gases in a coastal marine environment A. Saiz-Lopez et al. Title Page Abstract Introduction Conclusions References Tables Figures J I J I Back Close Full Screen / EscPrint Version Interactive Discussion
EGU chemistry is the condensation of iodine oxide vapours, leading to the formation of new
ultra-fine particles in the daytime marine atmosphere (O’Dowd et al.,2002;McFiggans et al.,2004;Saiz-Lopez et al.,2005).
Field observations of the NO3radical over the past 25 years have demonstrated that it plays a major role in the chemistry of the nighttime troposphere (Platt et al.,1980,
5
1990;Heintz et al.,1996;Allan et al.,2000b,2002a;Brown et al.,2003,2004). NO3 reacts rapidly with DMS in the MBL (Butkovskaya and LeBras, 1994). The radical also recombines with NO2 to establish an equilibrium with N2O5. The subsequent heterogeneous uptake of N2O5 on aqueous sea-salt aerosol both removes NOx and activates halogens (see above).
10
In this paper we report results from a 5 week campaign of boundary layer obser-vations of I2, IO, OIO, BrO and NO3 made by long-path differential optical absorption spectroscopy (DOAS), and measurements of the vertical concentration profiles of NO3 by zenith sky DOAS. Box models are then used to investigate the nighttime chemistry of iodine, and the diurnal behaviour of BrO.
15
2. Experimental
2.1. Long-path DOAS instrument
The DOAS measurements were performed at the Mace Head Atmospheric Research Station (MHARS) on the west coast of Ireland (53◦200N, 9◦540W), during the NAM-BLEX (North Atlantic Marine Boundary Layer EXperiment) campaign in July/August
20
2002. The long-path DOAS instrument was housed in an observatory on the foreshore at the MHARS. It consists of a Newtonian telescope containing the xenon arc lamp source, and the transmitting and receiving optics. The light beam was folded back to the transmitter by a retro-reflector situated 4.2 km away on Croaghnakeela Island (see Fig. 2 inSaiz-Lopez et al.,2005), providing an optical absorption path of 8.4 km, about
25
ACPD
5, 9731–9767, 2005 Measurements and modelling of trace gases in a coastal marine environment A. Saiz-Lopez et al. Title Page Abstract Introduction Conclusions References Tables Figures J I J I Back Close Full Screen / EscPrint Version Interactive Discussion
EGU for 30 min when measuring I2, IO, OIO and BrO, or 20 min when detecting NO3. More
details on the instrument design and spectral deconvolution procedures are provided elsewhere (Plane and Saiz-Lopez,2005). The following reference spectra were taken from the literature and adapted to the spectrometer instrument function: I2(Saiz-Lopez et al.,2004b), IO (Harwood et al.,1997), OIO (P. Spietz, University of Bremen, personal
5
communication, 2005), BrO (Wahner et al.,1988) and NO3(Yokelson et al.,1994).
2.2. Zenith sky DOAS instrument
This instrument consists of a 0.8◦ field-of-view telescope, fixed in a zenith-viewing geometry and coupled to a spectrometer by means of a fibre optic cable. Spectra were recorded with a resolution of 0.5 nm in the λ=640–700 nm region for detection of
10
NO3. A detailed description of the instrument is given in (Allan et al.,2002a). Spectra were acquired every 1–2 min (depending on scattered light levels) for approximately 2 h through sunrise (SZA 95◦). The NO3column abundances were obtained using the same de-convolution method as for the long-path DOAS measurements, with a refer-ence spectrum recorded after sunrise when the NO3mixing ratio is negligible due to the
15
rapid photodissociation of the radical (Allan et al.,2002a). The vertical concentration profile was then determined using an optimal estimation algorithm described below.
3. Results and discussion
3.1. Long-path DOAS measurements of NO3
Observations of NO3 were performed during 16 nights under different meteorological
20
conditions. Figure 1 summarises the NO3 time series set during the campaign. The maximum value reached during the observation period was 25 ppt, with averages of ∼3 and 13 ppt for clean marine and semi-polluted air masses. These values are consis-tent with previously reported observations at the same location, under a similar range
ACPD
5, 9731–9767, 2005 Measurements and modelling of trace gases in a coastal marine environment A. Saiz-Lopez et al. Title Page Abstract Introduction Conclusions References Tables Figures J I J I Back Close Full Screen / EscPrint Version Interactive Discussion
EGU of meteorological conditions (Allan et al., 2000b). Comparable nighttime mixing ratio
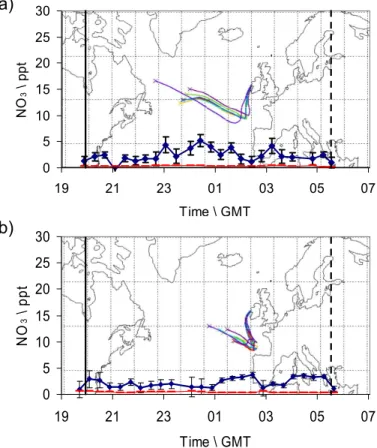
profiles have been reported in other marine areas (Heintz et al., 1996; Allan et al., 1999;Brown et al., 2004;Vrekoussis et al.,2004). The significant variations in NO3 levels during the period of measurements can be explained by considering the back trajectories of the air masses arriving in the MBL at Mace Head. Figures 2 and 3 show
5
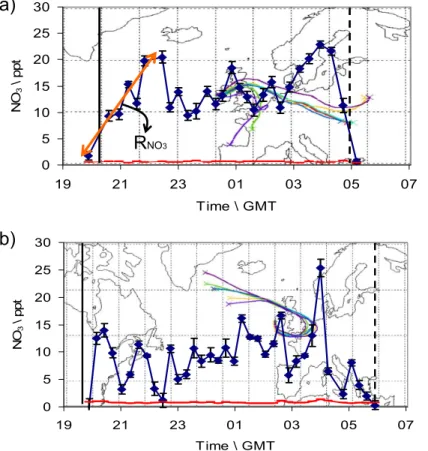
two different types of air masses and the associated NO3mixing ratios. The solid and broken grey bars correspond to sunset and sunrise, respectively. Typically, NO3 mix-ing ratios below 5 ppt were associated with air masses from the Atlantic Ocean sector, Fig. 2a and b. By contrast, NO3mixing ratios above 10 ppt coincided with semi-polluted air masses from the UK or the European continent Fig. 3a and b. Note that although the
10
predicted back trajectories on 3 September have their origin in the north Atlantic, the air mass has traversed over parts of the United Kingdom and the European continent before reaching Mace Head.
NO3is formed by the oxidation of NO2by O3, with a rate constant k (NO2+O3)=1.2× 10⁻¹³exp (-2450/T ) cm3molecule−1 s−1 (Sander et al.,2003). In the immediate
post-15
dusk hours, once photolysis ceases and before NO3 builds up to a chemical steady state, assuming other losses are negligible, the rate of increase of NO3 should just be the rate of production, RNO
3=k(NO2+ O3) [O3][NO2]. Taking the observed average
NO2 and O3 mixing ratios of 450 ppt and 22 ppb, respectively, and an average tem-perature of 288 K, then RNO
3=22 ppt h
−1
is obtained. This rate is in good accord with
20
the observations (see Fig. 3a). We have shown previously that under clean marine air conditions at Mace Head during summer, DMS controls the removal of NO3, whereas in semi-polluted air masses NO3 removal is dominated by the indirect loss of N2O5 (Allan et al.,2000b).
During NAMBLEX the broad-band cavity ring-down spectroscopy (BBCRDS)
tech-25
nique was also employed to make in-situ measurements of the NO3radical. An inter-comparison of the local and long-path observations can be found in Bitter et al. (2005)1.
1
ACPD
5, 9731–9767, 2005 Measurements and modelling of trace gases in a coastal marine environment A. Saiz-Lopez et al. Title Page Abstract Introduction Conclusions References Tables Figures J I J I Back Close Full Screen / EscPrint Version Interactive Discussion
EGU A photochemical box model of the nighttime NO3chemistry (Allan et al.,2000b) was
used to simulate the production of N2O5 from its equilibrium with NO3. The model was run under typical westerly clean marine conditions, for which an average NO3 mixing ratio of 3 ppt was observed. For marine air masses, the N2O5 accommodation coefficient in the model, γN2O5, was set at 0.03 (Behnke et al., 1997; Allan et al.,
5
2000b). Under these clean marine conditions, with an aerosol volumetric surface area of 10−7cm2cm−3, the modelled N2O5mixing ratio throughout the night is ∼3 ppt. This N2O5mixing ratio will be used in a bromine chemistry model to assess the contribution of NO3chemistry to halogen activation on sea-salt particles (Sect. 3.6).
3.2. Zenith sky observations of NO3vertical profiles
10
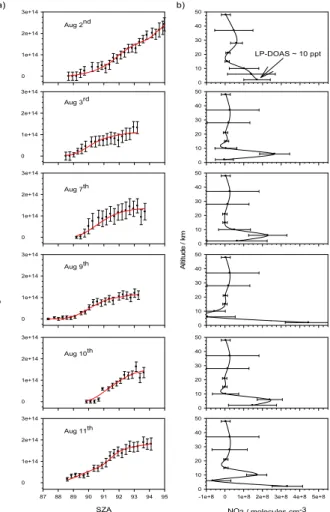
NO3 vertical column measurements were carried out at sunrise during six days, as shown in Fig. 4. The left-hand panels (Fig. 4a) show the expected dependence of NO3 column on SZA: as the solar terminator sweeps down through the atmosphere, more and more of the overlying NO3 is removed by photolysis. Note that the errors associated with individual column density measurements are quite variable. These
un-15
certainties arise mainly from the visibility conditions, and the temperature dependence of the NO3absorption cross-section (Allan et al.,2002a). The literature cross-section employed is that ofYokelson et al. (1994) at 280 K, a temperature which can be con-sidered representative of the lower troposphere where the contribution to the NO3total absorption column should be strongest. In Fig. 4a it can be seen that the NO3
per-20
sisted after dawn on several occasions. This effect is most likely due to the thermal decomposition of N2O5competing with photolysis to sustain the NO3mixing ratio past sunrise (Smith and Solomon,1990;Smith et al.,1993;Allan et al.,2002a;Coe et al., 2002).
The conversion from column abundance to vertical mixing ratio profiles was made
25
Measurements of NO3, N2O5, OIO, I2, water vapour and aerosol optical depth by broadband cavity ringdown spectroscopy during the NAMBLEX campaign, Atmos. Chem. Phys. Discuss., in preparation, 2005.
ACPD
5, 9731–9767, 2005 Measurements and modelling of trace gases in a coastal marine environment A. Saiz-Lopez et al. Title Page Abstract Introduction Conclusions References Tables Figures J I J I Back Close Full Screen / EscPrint Version Interactive Discussion
EGU using the optimal estimation method (OEM) (Rodgers,1976,1990). Briefly, the forward
model used is described by the expression y=Kx, where knowing the state of the
system or weighing matrix function (K) and the vertical mixing ratio profile (x), the
column density time series (y) can be predicted. However, since x is not known the
forward model is inverted to give the backward modelx=K−1y. The inversion process
5
makes use of ‘a priori’ information, i.e. the likely NO3 vertical profile, to allow NO3 vertical distribution information to be retrieved. K comprises photolysis of NO3 as a function of height, SZA and time (Coe et al.,2002).
In Fig. 4a the predicted column abundance (solid red line) using the forward model is compared with the measured, as a function of SZA. Figure 4b illustrates the
cor-10
responding retrieved NO3vertical concentration profiles. These profiles exhibit strong gradients, consistent with other observations (Allan et al.,2002a). On all six days, the highest NO3 concentrations are in the mid- to low troposphere. There are probably three reasons for this. First, higher temperatures and NO2 concentrations will cause NO3 to be produced more rapidly. Second, the thermal decomposition of N2O5 back
15
to NO3will be faster. Third, DMS evading from the ocean will remove NO3at the base of the MBL, creating a positive gradient of NO3in the MBL. This probably explains the observations in clean marine conditions on 3, 7 and 10 August. On the night of 2 Au-gust (when the site was influenced by semi-polluted continental air masses) long-path DOAS and zenith sky measurements of NO3were performed simultaneously. In Fig. 4b
20
(top panel) the boundary layer measurement of ∼10 ppt just before dawn is comparable to the 7 ppt retrieved for the lowest box in the vertical profile, which is centred at 2 km. On 9 and 11 August, back trajectories show boundary layer air arriving after traversing north-south along the west coast of Ireland, which probably accounts for the relatively high NO3concentrations in the lowest box.
25
3.3. Iodine species (I2, IO, OIO)
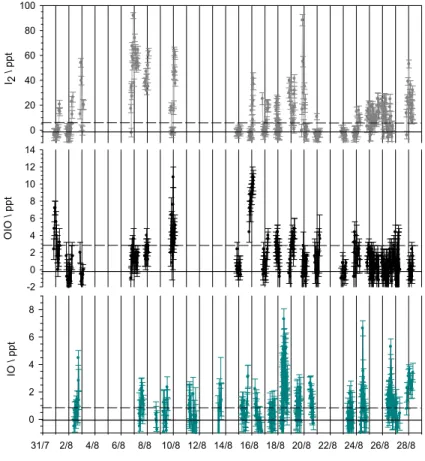
Figure 5 illustrates the time series of I2, IO and OIO during NAMBLEX. The broken line in each of the panels shows the average DOAS detection limit for the particular
ACPD
5, 9731–9767, 2005 Measurements and modelling of trace gases in a coastal marine environment A. Saiz-Lopez et al. Title Page Abstract Introduction Conclusions References Tables Figures J I J I Back Close Full Screen / EscPrint Version Interactive Discussion
EGU species during the campaign. Measurements of I2were carried out during 18 days. As
we have demonstrated in an accompanying paper (Saiz-Lopez et al.,2005), the pho-tolysis lifetime of I2is so short (∼15 s) that during daytime I2 is very inhomogeneously distributed along the DOAS light path. Thus the daytime mixing ratios of I2 (and IO) in Fig. 5 should be treated with caution – they are useful as relative rather than
abso-5
lute measurements. The maximum I2mixing ratio observed during the campaign was 93 ppt. This was observed at night, when the average I2mixing ratio was considerably higher, as expected in the absence of photolysis.
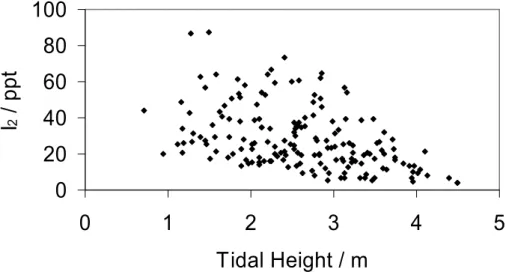
Figure 5 shows that the I2 mixing ratio is characterised by sharp peaks lasting for 30 to 45 min. These peaks always coincided with low tide (Saiz-Lopez and Plane,
10
2004). Indeed, a simple plot of I2 mixing ratio versus tidal height exhibits a clear anti-correlation, as shown in Fig. 6. The source of I2at this coastal environment is almost certainly macro-algae (e.g. Laminaria), which accumulate iodine compounds well over the concentration of such chemical species in seawater, leading to direct injection of I2 when the plant is exposed to the atmosphere at low tide (Truesdale et al., 1995;
15
Kupper et al.,1998;McFiggans et al.,2004). The role of I2 in the production of new particles in coastal areas has been recently proposed bySaiz-Lopez and Plane(2004) andMcFiggans et al. (2004), and explored in detail using an iodine chemistry model (Saiz-Lopez et al.,2005). These studies show that I2 is the major contributor to the particle bursts observed at Mace Head.
20
In contrast to the state of the tide, the I2mixing ratio did not correlate significantly with local wind direction. This is not surprising since the prevailing wind directions tended to be westerly or easterly, and macroalgae were exposed at both ends of the light path (see the map in Saiz-Lopez et al., 2005). Nevertheless, one potentially interesting detail is that I2 was observed at night in westerly winds, irrespective of the state of
25
the tide. This may indicate that I2 is also produced over the open ocean, as originally proposed byGarland and Curtis(1981).
Figure 5 also shows the complete time series of IO during NAMBLEX, totalling 15 days of measurements. The maximum IO mixing ratio during the campaign was ∼7 ppt,
ACPD
5, 9731–9767, 2005 Measurements and modelling of trace gases in a coastal marine environment A. Saiz-Lopez et al. Title Page Abstract Introduction Conclusions References Tables Figures J I J I Back Close Full Screen / EscPrint Version Interactive Discussion
EGU measured during daytime. This is in accord with previously reported IO observations
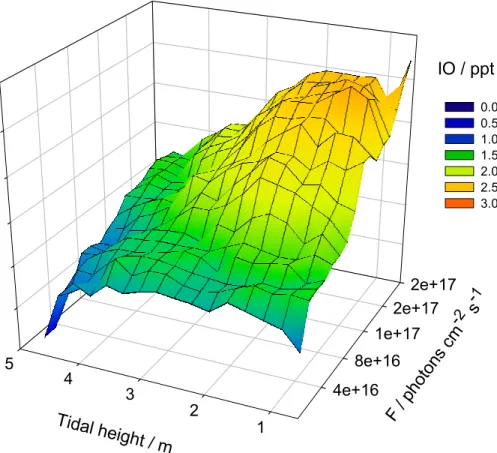
at Mace Head (Alicke et al., 1999; Allan et al., 2000a). Note that this mixing ratio is probably the average of a rather inhomogeneous distribution along the DOAS path (Saiz-Lopez et al.,2005). During daytime, IO exhibited a clear anti-correlation with tidal height and solar irradiation, as shown in the mesh plot in Fig. 7. This is good evidence
5
for its photochemical production from coastal emissions of I2(Saiz-Lopez and Plane, 2004). IO was only measured during two nights of NAMBLEX, when mixing ratios up to ∼2.5 ppt were observed.
OIO measurements were made simultaneously with I2 in the 535–575 nm wave-length region. During the day, OIO was not observed above the daytime detection
10
limit of ∼4 ppt. The radical was only observed at night, with a maximum mixing ratio of 10.8 ppt. In fact, on this occasion the OIO peaked after local midnight, and about 2 h after a night-time peak of I2at low tide (Saiz-Lopez and Plane,2004). The observation that OIO is only detectable at night is consistent with previous measurements made by us at Cape Grim (Tasmania), another remote marine location (Allan et al.,2001).
15
There appear to be two possible explanations for the absence of OIO during day-time. First, it could photolyse following absorption in the strong bands between about 470 and 610 nm. Whilst certain experimental evidence led us to conclude this was the case (Ashworth et al.,2002), we have recently shown that absorption leads to inter-conversion into the highly vibrationally-excited ground state rather than dissociation to
20
I+O2, so the quantum yield for photolysis is probably much less than 10% at 562 nm (D. M. Joseph, S. H. Ashworth, and J. M. C. Plane, University of East Anglia, personal communication). Nevertheless, a small probability of photolysis, integrated over the ab-sorption bands, could still account for the removal of OIO during daytime (Saiz-Lopez et al.,2005). A second possibility is that OIO is removed during daytime by reaction
25
with radicals that have marked diurnal cycles with daytime maxima, such as OH, NO and IO. Based on our current experimental and theoretical work, we believe that the most likely of these is IO, as discussed in our recent modelling study (Saiz-Lopez et al., 2005).
ACPD
5, 9731–9767, 2005 Measurements and modelling of trace gases in a coastal marine environment A. Saiz-Lopez et al. Title Page Abstract Introduction Conclusions References Tables Figures J I J I Back Close Full Screen / EscPrint Version Interactive Discussion
EGU 3.4. Nighttime iodine chemistry
In order to understand the source of IO and OIO during the night in the MBL, we have modified our existing iodine chemistry model (McFiggans et al., 2000; Saiz-Lopez et al., 2005). A plausible mechanism for the formation of atomic iodine at night is the reaction of I2+NO3→INO3+I, which has a rate constant at 295 K of
5
1.5×10⁻¹² cm3 molecule−1 s−1 (Chambers et al.,1992). The resulting I atom would form IO in the atmosphere, and a simple calculation showed that this reaction might be fast enough to account for the nighttime observations of IO (Saiz-Lopez and Plane, 2004). The other product is INO3. Assuming an accommodation coefficient, γINO3, of 0.05 and a clean MBL aerosol volumetric surface area of 10−7cm2cm−3, the loss rate
10
due to uptake on aerosols is ∼2.3×10⁻⁵ s−1. An upper limit to the rate of thermal dis-sociation at 285 K has been determined to be 4.5×10⁻⁴ s−1(Allan and Plane,2002b). Hence, at night in the MBL there will be a competition between uptake on aerosols and thermal decomposition of INO3.
We also consider in the model the thermal stabilities of I2O2 and I2O4, dimers that
15
form from the self reactions of IO and OIO, respectively. Ab initio quantum calculations, using a level of theory described previously (Allan and Plane, 2002b), show that the binding energy of the OIO dimer is only 72 kJ mol−1, while that of the IO dimer (in the form IOIO) is about 86 kJ mol−1. Using these binding energies, vibrational frequen-cies and rotational constants as input for a Rice-Ramsberger-Kassel-Markus (RRKM)
20
calculation, we predict that the rates of dissociation of these dimer molecules will be fast at a typical mid-latitude MBL nighttime temperature of 285 K and a pressure of 1 atmosphere. I2O4 will dissociate back to OIO+OIO at a rate of ∼7×10³s−1. IOIO will dissociate to OIO+I and IO+IO at rates of ∼12 and 4 s−1, respectively. The atmospheric implication of these results will be a delay in the rate of disappearance of IO and OIO in
25
the nighttime MBL. These dissociation rates, and the rate constant for the association of the OIO dimer (predicted from RRKM theory to be ∼5×10⁻¹¹cm3molecule−1s−1 at 1 atm and 285 K), are included in the model.
ACPD
5, 9731–9767, 2005 Measurements and modelling of trace gases in a coastal marine environment A. Saiz-Lopez et al. Title Page Abstract Introduction Conclusions References Tables Figures J I J I Back Close Full Screen / EscPrint Version Interactive Discussion
EGU When running the model, the source of I2 was constrained to produce the average
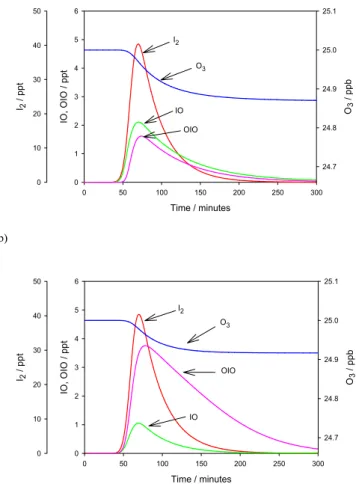
nighttime I2 peak of about 40 ppt that was observed during nocturnal low tide. The rate of I2emission in the model followed a Gaussian distribution, peaking at low tide, with a standard width of 22 min (Saiz-Lopez et al.,2005). The NO3 mixing ratio was fixed at 10 ppt. Figure 8a shows the time- profiles of I2, IO and OIO. The O3 profile is
5
also shown, although the predicted O3loss rate is negligible (3×10⁻²ppb h−1). In the absence of photolysis, the I2 peak decays much more slowly than during the day, in accord with our observations (Saiz-Lopez and Plane,2004).
In this model run the IO and OIO mixing ratios peak at 2 ppt and 1.7 ppt, respectively, coincident with low tide. Hence, there are two things that differ from the nighttime
ob-10
servations. First, the OIO/IO ratio predicted by the model is 0.9, whereas the measure-ments indicate that this ratio is ∼4. Second, the observations show that the OIO peak occurs after I2 reaches its maximum at low tide. Therefore, to reconcile the measure-ments with the model results, another route for converting IO to OIO, in addition to the self reaction of IO, is required. Although the reaction IO+O3→OIO+O2is exothermic
15
by about 150 kJ mol−1 (Misra and Marshall,1998), a very small upper limit to the rate constant of 10−15cm3molecule−1s−1 has been determined (Atkinson et al.,2000), so that this reaction would be too slow. Another candidate is the reaction:
IO+ NO3→ OIO+ NO2 (1)
Although this reaction does not appear to have been studied, it is also exothermic
20
(by about 50 kJ mol−1), and NO3is in general a more aggressive reactant than O3: for instance, it reacts about 105times faster with I2.
When Reaction (1) is included in the model, the rate constant needs to be larger than 7×10⁻¹²cm3molecule−1s−1in order to increase the modelled OIO/IO ratio to the observed ratio of 4. This model run is shown in Fig. 8b; note that the OIO peak now
oc-25
curs after the maxima of I2and IO, as observed. Although this model does not include vertical mixing or consider inhomogeneity along the DOAS light path when comparing with the observations, it does include the uptake of OIO (and IO) onto a background
ACPD
5, 9731–9767, 2005 Measurements and modelling of trace gases in a coastal marine environment A. Saiz-Lopez et al. Title Page Abstract Introduction Conclusions References Tables Figures J I J I Back Close Full Screen / EscPrint Version Interactive Discussion
EGU aerosol loading typical of Mace Head (Saiz-Lopez et al.,2005). We therefore consider
the level of agreement with the observations to be encouraging. A study of Reaction (1) appears to be a priority to develop further understanding of nighttime iodine chemistry.
3.5. BrO observations
BrO was measured over 6 days during NAMBLEX (Saiz-Lopez et al.,2004a). A
max-5
imum mixing ratio of 6 ppt was observed, coinciding with westerly and relatively high speed winds (up to 11 m s−1), whereas a mean daytime mixing ratio of 2.3 ppt was observed. The diurnal profile was characterised by a short-lived pulse after dawn. Fig-ure 9 shows an average mixing ratio time-profile from three days of observations (3, 4 and 10 August) when BrO was observed from dawn onwards. The sunrise time at
10
Mace Head for this time of the year was around 04:50 UT, with a 43 min twilight pe-riod defined as the pepe-riod when the SZA is between 96◦ and 90◦. Twilight needs to be considered because, as we show below, some bromine atom precursors are very photolabile. After the BrO pulse, a rapid decrease in its mixing ratio was observed, followed by a partial recovery before noon. Figure 9 indicates that a second small
15
maximum may also be present in the late afternoon before sunset, after which BrO decreased below the detection limit of the DOAS instrument (∼1 ppt).
It is unlikely that the post-dawn BrO pulse results from the photolysis of organic bromine species, because of their long photolytic lifetimes in the lower atmosphere (Carpenter et al.,1999). One relatively short-lived alkyl bromide is CH2IBr; however,
20
its photolytic lifetime is still about 1 h, and its mixing ratio in the MBL at Mace Head is ∼0.1 ppt (Carpenter et al.,1999). In any case, halocarbon emissions at Mace Head are driven by tidal height (Carpenter et al.,1999), and there is no correlation with tidal height evident in the BrO measurements.
Hence, the most likely BrO precursors are inorganic bromine species such as Br2,
25
IBr, BrCl and BrNO2, which have built up after heterogeneous processing through sea-salt aerosol during the preceding night. At sunrise they are rapidly photolysed to yield Br atoms which react with O3to form BrO. An interesting problem is to determine which
ACPD
5, 9731–9767, 2005 Measurements and modelling of trace gases in a coastal marine environment A. Saiz-Lopez et al. Title Page Abstract Introduction Conclusions References Tables Figures J I J I Back Close Full Screen / EscPrint Version Interactive Discussion
EGU of these potential precursors is the main contributor to the post-sunrise BrO pulse. In
Fig. 10a the absorption cross-sections of these four bromine precursors are plotted against wavelength, using data fromAtkinson et al.(2000). It can be seen that IBr has the largest cross-section, peaking around 500 nm and extending throughout the visible region of the spectrum. IBr will therefore photolyse most readily around dawn. In
5
contrast, BrNO2has an absorption cross-section nearly an order of magnitude smaller, peaking at 300 nm. The rates of photodissociation (J) of BrNO2, Br2, IBr and BrCl are shown in Fig. 10b as a function of time of day, for the location of Mace Head in early August. The J values are calculated, assuming a quantum yield of unity, by an explicit two-stream radiation code (Thompson, 1984), where the incident actinic flux
10
(photons cm−2 s−1 nm−1) at the Earth’s surface is obtained after attenuation through 50 atmospheric layers of 1 km height. Immediately after sunrise, JIBr is twice as fast as JBr
2 and up to an order of magnitude faster than JBrNO2. Indeed, if BrNO2(and to a
lesser extent BrCl) were the major sources of atomic Br, then the BrO pulse would be delayed in appearance and also less sharp.
15
Laboratory studies of the uptake of N2O5 on a saline surface mimicking sea-salt aerosols, which are ∼660 times more concentrated in Cl−than Br−, have been reported byBehnke et al.(1994):
N2O5(g) → N2O5(aq) (2)
N2O5(aq)+ X− → NO3−+ XNO2 (3)
20
where X is Cl or Br. The authors found that ∼10% of the released product was BrNO2, with 73% ClNO2 and 17% Br2. Assuming this product yield for BrNO2 and using the NO3 chemistry model described in Sect. 3.1, we calculate that for clean marine con-ditions ([NO3] and [N2O5] ∼3 ppt) the cycling through sea-salt aerosol during the night would yield a BrNO2 mixing ratio of ≤0.2 ppt before sunrise.
25
When photolysis ceases after sunset, the uptake of HOBr or BrNO3 on sea-salt aerosol will be their major removal pathways. These species will be rapidly recycled
ACPD
5, 9731–9767, 2005 Measurements and modelling of trace gases in a coastal marine environment A. Saiz-Lopez et al. Title Page Abstract Introduction Conclusions References Tables Figures J I J I Back Close Full Screen / EscPrint Version Interactive Discussion
EGU through heterogeneous reactions to gas-phase Br2and BrCl, depending on the
avail-ability of Cl−and Br− (Finlayson-Pitts,2003):
HOBr+ Cl−+ H+ → BrCl+ H2O (4)
BrCl+ Br− ↔ Br2Cl− (5)
Br2Cl−↔ Br2+ Cl− (6)
5
If the Br− concentration is sufficient (i.e., in freshly generated sea-salt aerosol), BrCl will be converted into Br2via Reactions (5) and (6). In aged sea-salt aerosol that is de-pleted in Br−, BrCl becomes the major product (Fickert et al.,1999;Liu and Margerum, 2001;Adams et al.,2002).
Although the I− content in sea-salt is negligible compared to Cl− and Br−, a similar
10
mechanism to Reaction (4) can proceed following uptake of species such as HOI and INO3, leading to the release of ICl and IBr to the gas phase (Vogt et al., 1999; Mc-Figgans et al., 2000). From laboratory experiments, the main di-halogen gas-phase product is IBr from freshly generated NaCl/NaBr surfaces with sufficient Br− content. Release of ICl was only observed after depletion of Br−(Holmes et al.,2001). The
cor-15
responding Henry’s law constants (mol l−1 atm−1) for the different species are: BrNO2 0.3, Br21.8, BrCl 0.59 (Frenzel et al.,1998) and 110 and 24 for ICl and IBr, respectively (Wagman et al.,1982).
Considering the above photodissociation rates and the mechanisms for recycling halogens through sea salt, it seems that Br2 and IBr should be the primary sources
20
of the large post-sunrise BrO pulses observed at Mace Head. However, from our DOAS observations there is no evidence of a post-sunrise pulse of IO (apart from when low tide coincides with sunrise). Putting this together with the fact that the solubility constant of IBr is an order of magnitude greater than that of Br2, we infer that Br2 is probably the dominant source of Br at sunrise in this location.
ACPD
5, 9731–9767, 2005 Measurements and modelling of trace gases in a coastal marine environment A. Saiz-Lopez et al. Title Page Abstract Introduction Conclusions References Tables Figures J I J I Back Close Full Screen / EscPrint Version Interactive Discussion
EGU 3.6. Modelling the diurnal behaviour of BrO
We now describe a model of bromine chemistry, containing the gas-phase reactions, photochemistry, and heterogeneous uptake processes listed in Table 1. The photol-ysis rates were calculated off-line using a two-stream radiation scheme. The model is solved using a variable step-size fourth-order Runge-Kutta integrator (Press et al.,
5
1986). All bromine-containing species and O3 are allowed to vary. The mixing ratios of the following species are held constant at values typical of clean MBL conditions: [NO2]=30 ppt; [NO]=5 and 0 ppt at day- and nighttime, respectively; [DMS]=100 ppt; [CH2IBr]=0.1 ppt. The mixing ratios of OH and HO2 are constrained in the model to follow the diurnal profiles of these radicals measured during NAMBLEX, with noon
10
maxima of 0.1 and 5 ppt, respectively (Bloss et al.,2005).
The heterogeneous reaction of HOBr with sea salt and subsequent liberation of Br2 and BrCl to the gas phase has been observed to occur rapidly (Abbatt and Waschewsky,1998;Fickert et al.,1999;Adams et al.,2002). These experiments were conducted on surfaces with a Cl−/Br− ratio of ∼660. Considering the aqueous phase
15
reaction rates and equilibrium constants for Reactions (4–6) (Liu and Margerum,2001; Finlayson-Pitts,2003), a simple calculation shows that it would take a few minutes for HOBr, once taken up on a sea-salt aerosol surface, to be released as Br2 and, to a lesser extent BrCl, depending upon the Br− content and acidity of the aerosol (Fickert et al., 1999). Hence, the rate-limiting step of this heterogeneous process will be the
20
uptake of HOBr on the aerosol surface. In the model runs shown here we consider the uptake of HOBr to generate 75% Br2and 25% BrCl.
Likewise, aqueous phase reactions involving BrNO3could also lead to the release of Br2and BrCl via hydrolysis or reaction with Cl− and Br− (Sander et al.,1999):
BrNO3+ H2O → HOBr+ HNO3 (7)
25
BrNO3+ Cl− → BrCl+ NO3− (8)
BrNO3+ Br− → Br2+ NO3−
ACPD
5, 9731–9767, 2005 Measurements and modelling of trace gases in a coastal marine environment A. Saiz-Lopez et al. Title Page Abstract Introduction Conclusions References Tables Figures J I J I Back Close Full Screen / EscPrint Version Interactive Discussion
EGU Reaction of BrNO3on aerosol surfaces via Reactions (8) and (9) can proceed without
aerosol acidity, and hence allow halogen activation on alkaline aerosols (Sander et al., 1999). Figure 11 shows the result of a model simulation for clean marine conditions, where the sea-salt surface area is set to 10−7cm2cm−3. The model is initialised with Br2and BrCl mixing ratios of 4.5 and 1.5 ppt, respectively. A rapid pulse of BrO up to
5
4.5 ppt is generated as soon as photolysis starts. In order to match the observed pulse of BrO (Fig. 9) the rate of post-sunrise Br atom production needed is ∼8×10³molecule cm−3 s−1. As Br2 and BrCl are photolysed and their mixing ratio rapidly decreases, BrO reaches a minimum followed by a slow recovery throughout the day leading to a second maximum in the late afternoon. BrO then disappears as photolysis ceases after
10
sunset. Similar diurnal behaviour has been predicted in previous studies (Sander et al., 1999;Glasow et al.,2002). The modelled BrO time-profile in Fig. 11 is comparable to that observed (Fig. 9), with midday/afternoon mixing ratios around 1.5–2.5 ppt (Saiz-Lopez et al., 2004). Note that this model does not incorporate BrO mixing within the boundary layer. The BrO increase towards the late afternoon is due to the recycling of
15
HOBr and BrNO3through sea-salt aerosol.
After sunset, large amounts of BrNO3 build up as photolysis ceases, and this be-comes the major bromine species. In this model run BrNO3 has a loss rate due to uptake on aerosols of ∼1×10⁻⁵s−1 if γ=0.02 (note that the uptake of BrNO3 on del-iquesced sea salt aerosols does not appear to have been measured). The daytime
20
average photolysis rate of BrNO3is ∼8.5×10⁻⁴s−1, so this will probably be the domi-nant loss process, competing with thermal decomposition which has a measured rate of 9×10⁻⁶s−1 at 290 K (Orlando and Tyndall,1996). The BrNO3time-profile in Fig. 11 exhibits two distinct peaks: after the sunrise BrO pulse, and in the early evening when photolysis slows down. The BrNO3 minimum around noon is caused by photolysis,
25
which is sharply peaked to noon because the molecule absorbs almost entirely in the near-UV. After sunset the remaining BrNO3is slowly taken up on aerosols, and this is most likely the major route to the overnight build-up of gas-phase Br2.
re-ACPD
5, 9731–9767, 2005 Measurements and modelling of trace gases in a coastal marine environment A. Saiz-Lopez et al. Title Page Abstract Introduction Conclusions References Tables Figures J I J I Back Close Full Screen / EscPrint Version Interactive Discussion
EGU moval during daytime is dominated by photodissociation, as JHOBr is about 40 times
greater than heterogeneous loss to form Br2 and BrCl. Here a γ of 0.05 for HOBr is used, in accord with a lower limit of γ>10−2 measured on aqueous salt solutions (Fickert et al.,1999; Adams et al.,2002). Note that Abbatt and Waschewsky(1998) reported γ>0.2 for deliquescent NaCl aerosols within an acidity pH range 0.3–7. HOBr
5
uptake and production of gas-phase bromine-containing is dependant on aerosol acid-ity, and decreases with decreasing acidity (Fickert et al.,1999). Here we are assuming a scenario of freshly generated sea-salt aerosols with pH = 8, the same as ocean water (Glasow et al., 2002, and references therein). It must be noted that the pro-gressive acidification of aerosols by uptake of species such as HNO3, H2SO4and SO2
10
is not treated in the model. Considering an average volume concentration of aerosol (diameter= 0.3–47 µm) measured during NAMBLEX of 400 µm3cm−3(G. McFiggans, personal communication, 2005) and a Br− content in sea salt of 8×10⁻³mol l−1 we calculate a Br−depletion from sea-salt of 22% over the 1-day model run.
After sunset, the main sink for HOBr is heterogeneous uptake, contributing to the
15
nighttime production of gas-phase bromine atom precursors: Fig. 11 shows the Br2 build up once photolysis ceases leading to a maximum before sunrise, which will be responsible of the second post-dawn BrO pulse. Note that O3 is depleted through the day at a rate of approximately 0.06 ppb h−1, mainly through the cycle involving BrO+HO2. Of course, this is a zero-dimensional model and does not include mixing
20
with O3-rich air from aloft.
4. Conclusions
The techniques of long-path DOAS and zenith sky spectroscopy have been employed to acquire a comprehensive set of measurements of I2, IO, OIO, BrO and NO3 in a coastal mid-latitude location. The time series of the different species over a month
25
of observations are summarised in this paper. The observed daytime mixing ratios of the halogen oxides will affect a number of atmospheric processes such as ozone
de-ACPD
5, 9731–9767, 2005 Measurements and modelling of trace gases in a coastal marine environment A. Saiz-Lopez et al. Title Page Abstract Introduction Conclusions References Tables Figures J I J I Back Close Full Screen / EscPrint Version Interactive Discussion
EGU pletion, DMS oxidation capacity, new particle formation and regulation of the HO2/OH
and NO2/NO ratios. Model simulations show that the reaction between NO3 and I2 probably accounts for the significant nighttime levels of iodine oxides found at Mace Head. The observed pulses of BrO at sunrise, and subsequent diurnal behaviour of the radical, are explained with a model that incorporates the processing of the major
5
daytime bromine reservoirs, BrNO3 and HOBr, through sea-salt aerosol. However, the NAMBLEX data-set on BrO is quite small and more field observations are needed in order to establish this diurnal behaviour. Finally, the combination of boundary layer and vertical profile measurements of NO3 indicates that this radical often exists at higher concentration in the upper MBL and lower free troposphere, probably reflecting the
10
efficient removal of NO3by DMS close to the ocean surface.
Acknowledgements. This work was supported by the Natural Environment Research Council
of the UK. The authors wish to thank D. Heard (University of Leeds) for leading the NAMBLEX campaign and B. Allan for helpful discussions.
References
15
Abbatt, J. P. D. and Waschewsky, G. C. G.: Heterogeneous interactions of HOBr, HNO3, O3 and NO2 with deliquescent NaCl aerosols at room temperature, J. Phys. Chem. A, 102, 3719–3725, 1998. 9746,9748
Adams, J. W., Holmes, N. S., and Crowley, J. N.: Uptake and reaction of HOBr on frozen and dry NaCl/NaBr surfaces between 253 and 233 K, Atmos. Chem. Phys., 2, 79–91, 2002,
20
SRef-ID: 1680-7324/acp/2002-2-79. 9745,9746,9748,9756
Alicke, B., Hebestreit, K., Stutz, J., and Platt, U.: Iodine oxide in the marine boundary layer, Nature, 397, 572–573, 1999. 9733,9740
Allan, B. J. and Plane, J. M. C.: A study of the recombination of IO and NO2and the stability of INO3: implications for the atmospheric chemistry of iodine, J. Phys. Chem. A, 106, 8634–
25
8641, 2002b. 9741
Allan, B. J., Carslaw, N., Coe, H., Burgess, R. A., and Plane, J. M. C.: Observations of the nitrate radical in the marine boundary layer, J. Atmos. Chem., 33, 129–154, 1999. 9736
ACPD
5, 9731–9767, 2005 Measurements and modelling of trace gases in a coastal marine environment A. Saiz-Lopez et al. Title Page Abstract Introduction Conclusions References Tables Figures J I J I Back Close Full Screen / EscPrint Version Interactive Discussion
EGU Allan, B. J., McFiggans, G., Plane, J. M. C., and Coe, H.: Observations of iodine monoxide
in the remote marine boundary layer, J. Geophys. Res.-Atmos, 105, 14 363–14 369, 2000a.
9733,9740
Allan, B. J., McFiggans, G., Plane, J. M. C., and McFadyen, G. G.: The nitrate radical in the remote marine boundary layer, J. Geophys. Res.-Atmos, 105, 24 191–24 204, 2000b. 9734,
5
9736,9737
Allan, B. J., Plane, J. M. C., and McFiggans, G.: Observations of OIO in the remote marine boundary layer, Geophys. Res. Lett., 28, 1945–1948, 2001. 9733,9740
Allan, B. J., Plane, J. M. C., Coe, H., and Shillito, J. A.: Observations of NO3concentration pro-files in the troposphere, J. Geophys. Res., 107, art. no. 4588, doi:10.1029/2002JD002112,
10
2002a. 9734,9735,9737,9738
Ashworth, S. H., Allan, B. J., and Plane, J. M. C.: High resolution spectroscopy of the OIO radical: Implications for the ozone-depleting potential of iodine, Geophys. Res. Lett., 29, art. no. 1456, doi:10.1029/2001GL013851, 2002. 9740
Atkinson, R., Baulch, D. L., Cox, R. A., Crowley, J. N., Hampson Jr., R. F., Hynes, R. G.,
15
Jenkin, M. E., Kerr, J. A., Rossi, M. J., and Troe, J.: Summary of evaluated kinetic and photochemical data for atmospheric chemistry, IUPAC, J. Phys. Chem. Ref. Data, 29, 167– 266,http://www.iupac-kinetic.ch.cam.ac.uk/, 2000. 9742,9744,9756
Ayers, G. P., Gillet, R. W., Cainey, J. M., and Dick, A. L.: Chloride and bromide loss froma sea-salt particles in Southern Ocean air, J. Atmos. Chem., 33, 299–319, 1999. 9733
20
Barrie, L. A., Bottenheim, J. W., Schnell, R. C., Crutzen, P. J., and Rasmussen, R. A.: Ozone destruction and photochemical-reactions at polar sunrise in the lower Arctic atmosphere, Nature, 334, 138–141, 1988. 9732
Behnke, W., Scheer, V., and Zetzsch, C.: Production of BrNO2, Br2and ClNO2from the reaction between sea spray aerosol and N2O5, J. Aero. Sci., 25, S277–S278, 1994. 9733,9744
25
Behnke, W., George, C., Scheer, V., and Zetzsch, C.: Production and decay of ClNO2from the reaction of gaseous N2O5 with NaCl solution: bulk and aerosol experiments, J. Geophys. Res.-Atmos, 102, 3795–3804, 1997. 9737
Bloss, W. J., Lee, J. D., Johnson, G. P., Sommariva, R., Heard, D. E., Saiz-Lopez, A., Plane, J. M. C., McFiggans, G., Coe, H., Flynn, M., Williams, P., Rickard, A. R., and Fleming, Z.:
30
Impact of halogen monoxide chemistry upon boundary layer OH and HO2concentrations at a coastal site, Geophys. Res. Lett., 32, art. no. L06814, doi:10.1029/2004GL022084, 2005.
ACPD
5, 9731–9767, 2005 Measurements and modelling of trace gases in a coastal marine environment A. Saiz-Lopez et al. Title Page Abstract Introduction Conclusions References Tables Figures J I J I Back Close Full Screen / EscPrint Version Interactive Discussion
EGU Brown, S. S., Stark, H., Ryerson, T. B., Williams, E. J., Nicks, D. K., Trainer, M., Fehsenfeld,
F. C., and Ravishankara, A. R.: Nitrogen oxides in the nocturnal boundary layer: Simultane-ous in situ measurements of NO3, N2O5, NO2, NO, O3, J. Geophys. Res.-Atmos, 108, art.
no. 4299, doi:10.1029/2002JD002917, 2003. 9734
Brown, S. S., Dibb, J. E., Stark, H., Aldener, M., Vozella, M., Whitlow, S., Williams, E. J., Lerner,
5
B. M., Jakoubek, R., Middlebrook, A. M., DeGouw, J. A., Warneke, C., Goldan, P. D., Kuster, W. C., Angevine, W. M., Sueper, D. T., Quinn, P. K., Bates, T. S., Meagher, J. F., Fehsenfeld, F. C., and Ravishankara, A. R.: Nighttime removal of NOx in the summer marine boundary layer, Geophys. Res. Lett., 31, art. no. L07108, doi:10.1029/2004GL019412, 2004. 9734,
9736
10
Butkovskaya, N. I. and LeBras, G.: Mechanism of the NO3+ DMS reaction by discharge flow mass- spectrometry, J. Phys. Chem. A, 98, 2582–2591, 1994. 9734
Carpenter, L. J., Sturges, W. T., Penkett, S. A., Liss, P. S., Alicke, B., Hebestreit, K., and Platt, U.: Short-lived alkyl iodides and bromides at Mace Head, Ireland: Links to biogenic sources and halogen oxide production, J. Geophys. Res.-Atmos, 104, 1679–1689, 1999. 9733,9743
15
Chambers, R. M., Heard, A. C., and Wayne, R. P.: Inorganic gas-phase reactions of the nitrate radical – I2+NO3and I+NO3, J. Phys. Chem. A, 96, 3321–3331, 1992. 9733,9741
Coe, H., Allan, B. J., and Plane, J. M. C.: Retrieval of vertical profiles of NO3 from zenith
sky measurements using an optimal estimation method, J. Geophys. Res.-Atmos, 107, art. no. 4587, doi:10.1029/2002JD002111, 2002. 9737,9738
20
Davis, D. J., Crawford, J., Liu, S., McKeen, S., Bandy, A., Thorton, D., Rowland, F., and Blake, D.: Potential impact of iodine on tropospheric levels of Ozone and other critical oxidants, J. Geophys. Res.-Atmos, 101, 2135–2147, 1996. 9733
Deiber, G., George, C., Calve, S. L., Schweitzer, F., and Mirabel, P.: Uptake study of ClNO2and BrNO2by halide containing droplets, Atmos. Chem. Phys., 4, 1291–1299, 2004,
25
SRef-ID: 1680-7324/acp/2004-4-1291. 9756
Farman, J. C., Gardiner, B. G., and Shanklin, J. D.: Large losses of total ozone in Antarctica reveal seasonal ClOx/NOxinteraction, Nature, 315, 207–210, 1985. 9732
Fickert, S., Adams, J. W., and Crowley, J. N.: Activation of Br2and BrCl via uptake of HOBr onto aqueous salt solutions, J. Geophys. Res.-Atmos, 104, 23 719–23 727, 1999. 9745, 9746,
30
9748,9756
Finlayson-Pitts, B. J.: The tropospheric chemistry of sea salt: a molecular-level view of the chemistry of NaCl and NaBr, Chem. Rev., 103, 4801–4822, 2003. 9745,9746
ACPD
5, 9731–9767, 2005 Measurements and modelling of trace gases in a coastal marine environment A. Saiz-Lopez et al. Title Page Abstract Introduction Conclusions References Tables Figures J I J I Back Close Full Screen / EscPrint Version Interactive Discussion
EGU Finlayson-Pitts, B. J., Livingston, F. E., and Berko, H. N.: Ozone destruction and bromine
photochemistry at ground-level in the Arctic spring, Nature, 343, 622–625, 1990. 9732
Frenzel, A., Scheer, V., Sikorski, R., George, C., Behnke, W., and Zetzsch, C.: Heterogeneous interconversion reactions of BrNO2, ClNO2, Br2and Cl2, J. Phys. Chem. A, 102, 1329–1337, 1998. 9745
5
Gabriel, R., von Glasow, R., Sander, R., Andreae, M. O., and Crutzen, P. J.: Bromide content of sea-salt aerosols collected over the Indian Ocean during INDOEX 1999, J. Geophys. Res.-Atmos, 107, 8032, doi:10.1029/2001JD001133, 2002. 9733
Garland, J. A. and Curtis, H.: Emission of iodine from the sea surface in the presence of ozone, J. Geophys. Res.-Atmos, 86, 3183–3186, 1981. 9739
10
Glasow, R. V. and Crutzen, P. J.: Model study of multiphase DMS oxidation with a focus on halogens, Atmos. Chem. Phys., 4, 589–608, 2004,
SRef-ID: 1680-7324/acp/2004-4-589. 9733
Glasow, R. V., Sander, R., Bott, A., and Crutzen, P. J.: Modelling halogen chemistry in the marine boundary layer 1. Cloud-free MBL, J. Geophys. Res.-Atmos, 107, 4341,
15
doi:10.1029/2001JD000942, 2002. 9747,9748
Harwood, M. H., Burkholder, J. B., Hunter, M., Fox, R. W., and Ravishankara, A. R.: Absorption cross sections and self-reaction kinetics of the IO radical, J. Phys. Chem. A, 101, 853–863, 1997. 9735
Hausmann, M. and Platt, U.: Spectroscopic measurement of bromine oxide and ozone in the
20
high Arctic during Polar Sunrise Experiment 1992, J. Geophys. Res.-Atmos, 99, 25 399– 25 413, 1994. 9732
Heintz, F., Platt, U., Flentje, H., and Dubois, R.: Long-term observation of nitrate radicals at the Tor station, Kap Arkona (Rugen), J. Geophys. Res.-Atmos, 101, 22 891–22 910, 1996.
9734,9736
25
Holmes, N. S., Adams, J. W., and Crowley, J. N.: Uptake and reaction of HOI and IONO2 on frozen and dry NaCl/NaBr surfaces and H2SO4, Phys. Chem. Chem. Phys., 3, 1679–1687, 2001. 9745
Honninger, G. and Platt, U.: Observations of BrO and its vertical distribution during surface ozone depletion at Alert, Atmos. Environ., 36, 2481–2489, 2002. 9732
30
Jenkin, M. E., Cox, R. A., and Candeland, D. E.: Photochemical aspects of tropospheric iodine behavior, J. Atmos. Chem., 2, 359–375, 1985. 9733
ACPD
5, 9731–9767, 2005 Measurements and modelling of trace gases in a coastal marine environment A. Saiz-Lopez et al. Title Page Abstract Introduction Conclusions References Tables Figures J I J I Back Close Full Screen / EscPrint Version Interactive Discussion
EGU uptake in Laminariales involves extracellular, haloperoxidase-mediated oxidation of iodide,
Planta, 207, 163–171, 1998. 9739
Leser, H., Honninger, G., and Platt, U.: MAX-DOAS measurements of BrO and NO2 in the marine boundary layer, Geophys. Res. Lett., 30, doi:10.1029/2002GL015811, 2003. 9733
Liu, Q. and Margerum, D. W.: Equilibrium and kinetics of bromine chloride hydrolysis, Environ.
5
Sci. Tech., 35, 1127–1133, 2001. 9745,9746
McConnell, J. C., Henderson, G. S., Barrie, L., Bottenheim, J., Niki, H., Langford, C. H., and Templeton, E. M. J.: Photochemical bromine production implicated in Arctic boundary-layer ozone depletion, Nature, 355, 150–152, 1992. 9732
McFiggans, G., Plane, J. M. C., Allan, B. J., Carpenter, L. J., Coe, H., and O’Dowd, C.: A
10
modeling study of iodine chemistry in the marine boundary layer, J. Geophys. Res.-Atmos, 105, 14 371–14 385, 2000. 9733,9741,9745
McFiggans, G., Coe, H., Burgess, R., Allan, J., Cubison, M., Alfarra, M. R., Saunders, R., Saiz-Lopez, A., Plane, J. M. C., Wevill, D. J., Carpenter, L. J., Rickard, A. R., and Monks, P. S.: Direct evidence for coastal iodine particles from Laminaria macroalgae - linkage to
15
emissions of molecular iodine, Atmos. Chem. Phys., 4, 701–713, 2004,
SRef-ID: 1680-7324/acp/2004-4-701. 9734,9739
Misra, A. and Marshall, P.: Computational investigations of iodine oxides, J. Phys. Chem. A, 102, 9056–9060, 1998. 9742
Molina, M. J. and Rowland, F. S.: Stratospheric sink for chlorofluoromethanes – chlorine
atom-20
catalysed destruction of ozone, Nature, 249, 810–812, 1974. 9732
O’Dowd, C. D., Jimenez, J. L., Bahreini, R., Flagan, R. C., Seinfeld, J. H., Hameri, K., Pirjola, L., Kulmala, M., Jennings, S. G., and Hoffmann, T.: Marine aerosol formation from biogenic iodine emissions, Nature, 417, 632–636, 2002. 9734
Orlando, J. J. and Tyndall, G. S.: Rate coefficients for the thermal decomposition of BrONO2
25
and the heat of formation of BrONO2, J. Phys. Chem. A, 100, 19 398–19 405, 1996. 9747,
9756
Plane, J. M. C. and Saiz-Lopez, A.: UV-visible Differential Optical Absorption Spectroscopy (DOAS), in: Analytical Techniques for Atmospheric Measurement; edited by: Heard, D. E., Blackwell Publishing, Oxford, in press, 2005. 9735
30
Platt, U., Perner, D., Harris, G. W., Winer, A. M., and Pitts, J. N.: Detection of NO3in the polluted
troposphere by differential optical absorption, Geophys. Res. Lett., 7, 89–92, 1980. 9734
night-ACPD
5, 9731–9767, 2005 Measurements and modelling of trace gases in a coastal marine environment A. Saiz-Lopez et al. Title Page Abstract Introduction Conclusions References Tables Figures J I J I Back Close Full Screen / EscPrint Version Interactive Discussion
EGU time reaction of NO3with organic compounds, Nature, 348, 147–149, 1990. 9734
Press, W. H., Flannery, B. P., Teukolsky, S. A., and Vetterling, W. T.: Numerical recipes: The art of scientific computing, Cambridge University Press, Cambridge, 1986. 9746
Rodgers, C. D.: Retrieval of atmospheric temperature and composition from remote measure-ments of thermal-radiation, Rev. Geophys., 14, 609–624, 1976. 9738
5
Rodgers, C. D.: Characterization and error analysis of profiles retrieved from remote sounding measurements, J. Geophys. Res.-Atmos, 95, 5587–5595, 1990. 9738
Saiz-Lopez, A. and Plane, J. M. C.: Novel iodine chemistry in the marine boundary layer, Geophys. Res. Lett., 31, art. no. L04112, doi:10.1029/2003GL019215, 2004. 9733,9739,
9740,9741,9742
10
Saiz-Lopez, A., Plane, J. M. C., and Shillito, J. A.: Bromine oxide in the mid-latitude ma-rine boundary layer, Geophys. Res. Lett., 31, art. no. L03111, doi:10.1029/2003GL018956, 2004a. 9733,9743
Saiz-Lopez, A., Saunders, R. W., Joseph, M., and Plane, J. M. C.: Absolute absorption cross-section and photolysis rate of I2, Atmos. Chem. Phys., 4, 1443–1450, 2004b,
15
SRef-ID: 1680-7324/acp/2004-4-1443. 9735
Saiz-Lopez, A., Plane, J. M. C., McFiggans, G., Williams, P. I., Ball, S. M., Bitter, M., Jones, R. L., Hongwei, C., and Hoffmann, T.: Modelling molecular iodine emissions in a coastal marine environment: the link to new particle formation, Atmos. Chem. Phys. Discuss., 5, 5405–5439, 2005,
20
SRef-ID: 1680-7375/acpd/2005-5-5405. 9734,9739,9740,9741,9742,9743
Sander, R., Rudich, Y., von Glasow, R., and Crutzen, P. J.: The role of BrNO3 in marine tro-pospheric chemistry: A model study, Geophys. Res. Lett., 26, 2857–2860, 1999. 9746,
9747
Sander, S. P., Friedl, R. R., Golden, D. M., Kurylo, M. J., Huie, R. E., Orkin, V. L., Moortgat,
25
G. K., Ravishankara, A. R., Kolb, C. E., Molina, M., and Finlayson-Pitts, B. J.: Chemical kinetics and photochemical data for use in stratospheric modeling: Evaluation 14, Tech. rep., Jet Propulsion Laboratory, Pasadena, California, USA,http://jpldataeval.jpl.nasa.gov/, 2003.
9736,9756
Schweitzer, F., Mirabel, P., and George, C.: Multiphase chemistry of N2O5, ClNO2, BrNO2, J.
30
Phys. Chem. A, 102, 3942–3952, 1998. 9756
Smith, J. P. and Solomon, S.: Atmospheric NO3. 3. Sunrise disappearance and the
ACPD
5, 9731–9767, 2005 Measurements and modelling of trace gases in a coastal marine environment A. Saiz-Lopez et al. Title Page Abstract Introduction Conclusions References Tables Figures J I J I Back Close Full Screen / EscPrint Version Interactive Discussion
EGU Smith, J. P., Solomon, S., Sanders, R. W., Miller, H. L., Perliski, L. M., Keys, J. G., and
Schmeltekopf, A. L.: Atmospheric NO3. 4. Vertical profiles at middle and polar latitudes at sunrise, J. Geophys. Res.-Atmos, 98, 8983–8989, 1993. 9737
Thompson, A. M.: The effect of clouds on photolysis rates and ozone formation in the unpol-luted troposphere, J. Geophys. Res.-Atmos, 89, 1341–1349, 1984. 9744
5
Truesdale, V. W., Luther, G. W., and Canosamas, C.: Molecular iodine reduction in seawater – an improved rate equation considering organic compounds, Mar. Chem., 48, 2, 143–150, 1995. 9739
Vogt, R., Crutzen, P. J., and Sander, R.: A mechanism for halogen release from sea-salt aerosol in the remote marine boundary layer, Nature, 383, 327–330, 1996. 9733
10
Vogt, R., Sander, R., Glasow, R. V., and Crutzen, P. J.: Iodine chemistry and its role in halogen activation and ozone loss in the marine boundary layer: A model study, J. Atmos. Chem., 32, 375–395, 1999. 9745
Vrekoussis, M., Kanakidou, M., Mihalopoulos, N., Crutzen, P. J., Lelieveld, J., Perner, D., Berresheim, H., and Baboukas, E.: Role of the NO3 radicals in oxidation processes in the
15
eastern Mediterranean troposphere during the MINOS campaign, Atmos. Chem. Phys., 4, 169–182, 2004,
SRef-ID: 1680-7324/acp/2004-4-169. 9736
Wagman, D. D., Evans, W. H., Parker, V. B., Schumm, R. H., Halow, I., Bailey, S. M., Churney, K. L., and Nuttall, R. L.: The NBS tables of chemical thermodynamic properties; Selected
20
values for inorganic and C1and C2organic substances in SI units, J. Phys. Chem. Ref. Data, 11, suppl. 2, 1982. 9745
Wahner, A., Ravishankara, A. R., Sander, S. P., and Friedl, R. R.: Absorption cross-section of BrO between 312 and 385 nm at 298 and 223 K, Chem. Phys. Lett., 152, 507–512, 1988.
9735
25
Wofsy, S. C., McElroy, M. B., and Yung, Y. L.: The chemistry of atmospheric bromine, Geophys. Res. Lett., 2, 215–218, 1975. 9732
Yokelson, R. J., Burkholder, J. B., Fox, R. W., Talukdar, R. K., and Ravishankara, A. R.: Temperature-Dependence of the NO3 absorption spectrum, J. Phys. Chem. A, 98, 13 144– 13 150, 1994. 9735,9737
ACPD
5, 9731–9767, 2005 Measurements and modelling of trace gases in a coastal marine environment A. Saiz-Lopez et al. Title Page Abstract Introduction Conclusions References Tables Figures J I J I Back Close Full Screen / EscPrint Version Interactive Discussion
EGU
Table 1. Bromine chemistry scheme used in the photochemical box modela.
No Reaction Rate constant Remarksb
(R1) Br+ O3→BrO+ O2 1.7×10⁻¹¹e (−800/T ) 1 (R2) HBr+ OH → Br + H2O 1.1×10⁻¹¹ 1 (R3) Br+ HO2→HBr+ O2 1.5×10 −11 e(−600/T ) 1 (R4) Br+ NO2+ M → BrNO2 ko= 4.2×10⁻³¹×(T/300)−2.4 1 k∞= 2.7×10⁻¹¹×(T/300)−0 (R5) BrO+ NO2+M → BrNO3 ko= 5.2×10 −31×(T/300)−3.2 1 k∞= 6.9×10⁻¹²×(T/300)−2.9 (R6) BrO+ HO2→HOBr+ O2 3.4×10 −12e(540/T ) 1 (R7) BrO+ NO → Br + NO2 8.8×10 −12 e(260/T ) 1 (R8) BrO+ CH3SCH3→CH3SOCH3+ Br 1.5×10⁻¹⁴e(850/T ) 1 (R9) BrO+ BrO → 2Br + O2 2.4×10⁻¹²e (40/T ) 1 (R10) BrO+ BrO → Br2+ O2 2.8×10⁻¹⁴e(860/T ) 1 (R11) BrNO3→BrO+ NO2 2.8×10 13e−(12360/T ) 2 (R12) BrO+ hν → Br + O 0.05 3 (R13) Br2+ hν → 2Br 0.0315 3 (R14) IBr+ hν → Br + I 0.067 3 (R15) BrCl+ hν → Br + Cl 9.8×10⁻³ 3 (R16) BrNO2+ hν → Br + NO2 5.8×10⁻³ 3 (R17) BrNO3+ hν → BrO + NO2(Φ=0.71) 1.4×10 −3 3 → Br+ NO3(Φ = 0.29) (R18) HOBr+ hν → Br + OH 1.8×10⁻³ 3 (R19) CH2IBr+ hν → CH2+ Br + I 3.8×10⁻⁴ 3 (R20) Uptake coefficient of HOBr 0.05 4 (R21) Uptake coefficient of HBr 0.03 5 (R22) Uptake coefficient of BrNO3 0.02 6
a
Units: unimolecular reactions, s−1; photolysis rate constants, s−1; bimolecular reactions, cm3 molecule−1 s−1; termolecular reactions, cm6molecule−2 s−1, calculated using the formalism of Sander et al. (2003), where k=((ko
[M]/(1+ko[M]/k∞))×Fcn), Fc=0.6 and n=(1+(log10(ko[M]/k∞))2)−1. b
Remarks: 1,Sander et al.(2003); 2, fromOrlando and Tyndall(1996), applicable for atmospheric pressure; 3, ab-sorption cross-sections taken fromAtkinson et al.(2000); 4, fromFickert et al.(1999);Adams et al.(2002); 5, from
ACPD
5, 9731–9767, 2005 Measurements and modelling of trace gases in a coastal marine environment A. Saiz-Lopez et al. Title Page Abstract Introduction Conclusions References Tables Figures J I J I Back Close Full Screen / EscPrint Version Interactive Discussion EGU 31/7 1/8 2/8 NO 3 \ ppt 0 5 10 15 20 25 30 Time 19/8 23/8 27/8 31/8 4/9
Fig. 1. NO3 time series as measured by the LP-DOAS instrument during NAMBLEX. The mixing ratios are plotted together with the 2σ uncertainties.
ACPD
5, 9731–9767, 2005 Measurements and modelling of trace gases in a coastal marine environment A. Saiz-Lopez et al. Title Page Abstract Introduction Conclusions References Tables Figures J I J I Back Close Full Screen / EscPrint Version Interactive Discussion EGU 0 5 10 15 20 25 30 19 21 23 01 03 05 07 Time \ GMT NO 3 \ p pt 0 5 10 15 20 25 30 19 21 23 01 03 05 07 Time \ GMT NO 3 \ p pt a) b)
Fig. 2. Example of 5-day back trajectory in combination with a time-profile of the corresponding
NO3 mixing ratios for the westerly air masses arrival day. The solid and broken black lines correspond to dusk and dawn times, respectively, on 21 August(a) and 22 August (b). The
NO3 mixing ratios are shown with their uncertainty and detection limit (red line). Each back trajectory shows the path of an air mass over a period of five days before its arrival at Mace Head. The arrival time is midnight and the colour coded trajectories correspond to different pressure levels.
ACPD
5, 9731–9767, 2005 Measurements and modelling of trace gases in a coastal marine environment A. Saiz-Lopez et al. Title Page Abstract Introduction Conclusions References Tables Figures J I J I Back Close Full Screen / EscPrint Version Interactive Discussion EGU 0 5 10 15 20 25 30 19 21 23 01 03 05 07 Time \ GMT NO 3 \ p pt 0 5 10 15 20 25 30 19 21 23 01 03 05 07 Time \ GMT NO 3 \ p pt
R
NO3a)
b)
0 5 10 15 20 25 30 19 21 23 01 03 05 07 Time \ GMT NO 3 \ p pt 0 5 10 15 20 25 30 19 21 23 01 03 05 07 Time \ GMT NO 3 \ p pt 0 5 10 15 20 25 30 19 21 23 01 03 05 07 Time \ GMT NO 3 \ p pt 0 5 10 15 20 25 30 19 21 23 01 03 05 07 Time \ GMT NO 3 \ p ptR
NO3a)
b)
Fig. 3. Example of semi-polluted air masses and the NO3mixing ratio time-profiles for 1 August and 3 September. RNO
3 represent the rate of formation of the radical after sunset, calculated
ACPD
5, 9731–9767, 2005 Measurements and modelling of trace gases in a coastal marine environment A. Saiz-Lopez et al. Title Page Abstract Introduction Conclusions References Tables Figures J I J I Back Close Full Screen / EscPrint Version Interactive Discussion EGU A lti tude / k m 0 10 20 30 40 50 NO 3 co lu m n abundanc e / m ol ec ul es c m -2 0 1e+14 2e+14 3e+14 0 10 20 30 40 50 0 1e+14 2e+14 3e+14 0 10 20 30 40 50 0 1e+14 2e+14 3e+14 0 10 20 30 40 50 0 1e+14 2e+14 3e+14 0 10 20 30 40 50 0 1e+14 2e+14 3e+14
-1e+8 0 1e+8 2e+8 3e+8 4e+8 5e+8 0 10 20 30 40 50 87 88 89 90 91 92 93 94 95 0 1e+14 2e+14 3e+14 Aug 2nd Aug 3rd Aug 7th Aug 9th Aug 10th Aug 11th LP-DOAS ~ 10 ppt a) b) NO3 / molecules cm-3 SZA
Fig. 4. (a) Zenith-sky spectroscopy measurements of the NO3column abundance as a function of SZA during six days of observations at Mace Head. The solid red line indicates the profile predicted by the OEM forward model. (b) The corresponding retrieved vertical concentration