HAL Id: hal-03187865
https://hal.inrae.fr/hal-03187865
Submitted on 1 Apr 2021
HAL is a multi-disciplinary open access archive for the deposit and dissemination of sci-entific research documents, whether they are pub-lished or not. The documents may come from teaching and research institutions in France or abroad, or from public or private research centers.
L’archive ouverte pluridisciplinaire HAL, est destinée au dépôt et à la diffusion de documents scientifiques de niveau recherche, publiés ou non, émanant des établissements d’enseignement et de recherche français ou étrangers, des laboratoires publics ou privés.
Distributed under a Creative Commons Attribution| 4.0 International License
vector Aphis craccivora but inefficiently transmitted
Faustine Ryckebusch, Michel Peterschmitt, Martine Granier, Nicolas Sauvion
To cite this version:
Faustine Ryckebusch, Michel Peterschmitt, Martine Granier, Nicolas Sauvion. Alfalfa leaf curl virus is efficiently acquired by its aphid vector Aphis craccivora but inefficiently transmitted. Journal of General Virology, Microbiology Society, In press, 102 (2), �10.1099/jgv.0.001516�. �hal-03187865�
Alfalfa leaf curl virus is efficiently acquired by its aphid vector
Aphis craccivora
but inefficiently transmitted
Faustine Ryckebusch1,2,3, Michel Peterschmitt1,2,*, Martine Granier1,2 and Nicolas Sauvion2,*
DOI 10.1099/jgv.0.001516
Received 15 January 2020; Accepted 09 October 2020; Published 19 November 2020
Author affiliations: 1CIRAD, UMR BGPI, Montpellier, France; 2BGPI, Univ Montpellier, INRAE, CIRAD, Montpellier SupAgro, Montpellier, France; 3Global
Health Institute, School of Life Science, Ecole Polytechnique Fédérale de Lausanne (EPFL), Lausanne, Switzerland. *Correspondence: Nicolas Sauvion, nicolas. sauvion@ inrae. fr; Michel Peterschmitt, michel. peterschmitt@ cirad. fr Keywords: Aphididae; Capulavirus; epidemiology; Hemiptera; luteovirus; nanovirus.
Abbreviations: AAP, acquisition access period; ALCV, alfalfa leaf curl virus; BYDV, barley yellow dwarf virus; CNP, circulative, non- propagative mechanism; CP, capsid protein; d, mean number of days from aphid birth to reproduction (i.e. pre- reproductive time); DIECA, sodium
diethyldithiocarbamate; DT, doubling time, i.e. the time required by the aphid population to double its size; E1, phloem salivation phase; E2, phloem- feeding phase; EcmLV, Euphorbia caput medusae latent virus; ELISA, enzyme- linked immunosorbent assay; EPG, electropenetrography; FBNSV, faba bean necrotic stunt virus; FbSLCV, french bean severe leaf curl virus; FISH, Fluorescence in situ hybridization; IAP, inoculation access period;
Loess, acronym for locally weighted regression; Md, average number of progeny produced in a time equal to d; MEAM1, Bemisia tabaci cryptic
species Middle East Asia Minor 1; MED, Bemisia tabaci cryptic species Mediterranean; MSV, maize streak virus; Na2HPO4, sodium phosphate; PBS, Phosphate- buffered saline; PCR, Polymerase Chain Reaction; pd, potential drop; PEMV1, pea enation mosaic virus 1; PFA, paraformaldehyde; PlLV, plantago latent virus; PLRV, potato leafroll virus; qPCR, quantitative PCR; rm, intrinsic rate of increase; R- pd, repetitive pd; SDS, sodium dodecyl sulfate; SGBL, salivary gland basal lamina; T, mean generation time, i.e. the mean length of aphid generation; TR, theoretical transmission rate; TYLCCNV, tomato yellow leaf curl China virus; TYLCV, tomato yellow leaf curl virus; WDi, Waveform Duration by Insect; WDi- E2, variable WDi related to E2 pattern; WDV, wheat dwarf virus; WmCSV, watermelon chlorotic stunt virus.
One supplementary table is available with the online version of this article.
001516 © 2021 The Authors Abstract
Alfalfa leaf curl virus (ALCV) is the first geminivirus for which aphid transmission was reported. Transmission by Aphis
crac-civora was determined previously to be highly specific and circulative. Using various complementary techniques, the
transmis-sion journey of ALCV was monitored from its uptake from infected plant tissues up to the head of its vector. ALCV was shown to be restricted to phloem tissues using fluorescence in situ hybridization (FISH) and electropenetrography (EPG) monitoring of virus acquisition. Furthermore, the virus is heterogeneously distributed in phloem tissues, as revealed by FISH and quantitative PCR of viral DNA acquired by EPG- monitored aphids. Despite the efficient ingestion of viral DNA, about 106 viral DNA copies
per insect in a 15 h feeding period on ALCV- infected plants, the individual maximum transmission rate was 12 %. Transmission success was related to a critical viral accumulation, around 1.6×10⁷ viral DNA copies per insect, a threshold that generally
needed more than 48 h to be reached. Moreover, whereas the amount of acquired virus did not decrease over time in the whole aphid body, it declined in the haemolymph and heads. ALCV was not detected in progenies of viruliferous aphids and did not affect aphid fitness. Compared to geminiviruses transmitted by whiteflies or leafhoppers, or to luteoviruses transmitted by aphids, the transmission efficiency of ALCV by A. craccivora is low. This result is discussed in relation to the aphid vector of this geminivirus and the agroecological features of alfalfa, a hardy perennial host plant.
INTRODUCTION
Viruses that belong to the family Geminiviridae are trans-mitted by various hemipteran vectors [1–3]. Whiteflies (Aley-rodidae) transmit geminiviruses of the genus Begomovirus [4], leafhoppers (Cicadellidae) transmit those of the genera
Mastrevirus, Curtovirus, Becurtovirus, Turncurtovirus and
probably Eragrovirus [5–7], and treehoppers (Membracidae) transmit those of the genera Topocuvirus and Grablovirus [8]. Finally, aphids were found to be vectors of genetically distinct geminiviruses recently detected by metagenomic analyses
and for which a new genus was defined, named Capulavirus [9–11]. Although taxonomically very distinct, aphids transmit geminiviruses by a circulative, non- propagative (CNP) mechanism [1, 10] similar to that of the aphid- transmitted viruses of the family Luteoviridae [2] and Nanoviridae [3]. Circulative non- propagatively transmitted viruses require circulation through insect bodies before transmission [12]. Viruses can be acquired from infected plants when insects probe and feed on virus- infected cells using their piercing– sucking mouthparts. The success of virus acquisition depends
OPEN ACCESS
both on virus localization within the plant tissue and on the feeding behaviour of the insect. Phloem sieve tubes are the most conducive cells for virus acquisition because viruses inevitably use them for long- distance movement, and hemip-terans spend most of their feeding time in this cell compart-ment to draw their nutrient resource. Sieve tubes consist of a network of sieve elements surrounded by companion and phloem parenchyma cells which form phloem tissue [13]. By coupling microscopic observations and feeding behaviour analysis with an electropenetrography (EPG) method, Prado and Tjallingii [14] confirmed with barley yellow dwarf virus (BYDV), a Luteoviridae member (luteovirid), that virus acquisition is mainly associated with ingestion of phloem sap from sieve elements (EPG E2 waveform). Interestingly, they detected some virus acquisition with insects for which the E2 waveform was not detected, indicating that the virus can be acquired from other cells. While most CNP viruses are phloem- restricted [15, 16], some of them are also detected in mesophyll tissues, including mastreviruses, some begomovi-ruses and the luteovirid pea enation mosaic virus 1 (PEMV1) [17–21]. Therefore, it cannot be excluded that these viruses, like BYDV, may be acquired from non- sieve- element cells, including mesophyll cells. The most compelling validation for virus acquisition from non- phloem tissues was obtained with Cicadulina mbila Naudé, 1924, a leafhopper vector of maize streak virus (MSV), the type member of the genus
Mastrevirus. MSV can be acquired in 15 s [22], which is far too
short a time for the leafhopper stylet to reach sieve elements, as shown by EPG recording [23]. This result was fully consistent with electron microscopy observations showing that, unlike aphids, C. mbila individuals vigorously ingest mesophyll cell content. Together, these findings show that tissue tropism of the virus in the plant, together with the feeding behaviour of the vector are both keys to virus acquisition.
CNP transmission is characterized by a latent period, the time between virus acquisition by the insect vector and its ability to transmit the virus. The latent period corresponds to the time needed by the ingested virus to translocate from the gut lumen to the salivary duct of the insect vector. The best description of this circulation route was obtained with luteovirids for which transcytosis through the gut epithelium, haemocoel crossing and transcytosis through the salivary glands epithelium was shown with compelling electron micrographs [2, 24]. For most CNP viruses, the minimum duration of the latent period is several hours. For example, it is 54 h for the luteovirid potato leafroll virus (PLRV) in Myzus
persicae (Sulzer, 1776) aphids [25], 6–12 h for MSV in C. mbila
leafhoppers [26] and 8 h for the begomovirus tomato yellow leaf curl virus (TYLCV) in Bemisia tabaci (Gennadius, 1889) of the cryptic species Middle East Asia Minor 1 (MEAM1; also known as biotype B) [27]. The minimum latent period duration of only 10 min detected with the mastrevirus wheat dwarf virus (WDV) in Psammotettix alienus (Dahlbom, 1850) leafhoppers was explained by an early shortcut from the filter chamber reducing the circulation route [28].
Typically, CNP viruses are retained by their insect vectors for life, reflecting their ability to cope with insect defence
mechanisms [4, 29, 30]. Among CNP viruses, TYLCV exhibits some unexpected features. Indeed, some isolates of TYLCV replicate in two species of the B. tabaci complex (MEAM1 and Mediterranean- MED; previously biotype Q) [31, 32] and are transovarially transmitted [33, 34]. For one TYLCV isolate, a negative impact on the fitness of MEAM1 whiteflies was reported [35]. Using other TYLCV and begomovirus isolates, as well as other B. tabaci populations, neither DNA replication nor vertical transmission was detected [36–39].
While CNP transmission in aphids has long been reported only in the families Nanoviridae and Luteoviridae, an aphid vector, Aphis craccivora Koch, 1854, was recently identified for the geminivirus alfalfa leaf curl virus (ALCV) [9]. A CNP transmission mechanism was identified based on the reten-tion of viral DNA in gut, haemolymph and salivary gland compartments, as well as persistence of infectivity over time through insect moults [10]. The transmission of ALCV is highly specific. Indeed, ALCV could not be transmitted with a Euphorbia population of A. craccivora, although this population was a vector of Euphorbia caput medusae latent virus (EcmLV), the type member of the genus Capulavirus. Two transmission barriers were detected, a gut barrier to the transmission of ALCV in non- vector aphids of the species
Acyrthosiphon pisum (Harris, 1776), and a barrier at the
primary salivary gland level in A. craccivora aphids of the Euphorbia population. The objective of the present study was to complete the description of the transmission cycle of ALCV through aphids and particularly its acquisition from infected source plants, its accumulation dynamics in relation to infectivity, and its retention dynamics in different insect compartments. ALCV was also tested for a possible impact on the fitness of the aphid vector and for vertical transmis-sion. Particular attention was given to transmission efficiency because previous results showed that it was relatively low compared to other CNP viruses [10, 40].
METHODS
Plant and insect material
All transmission tests were conducted using broad bean plants (Vicia faba L. cv. ‘Séville’). Fluorescence in situ hybridi-zation (FISH) analysis was performed on both broad bean and Nicotiana benthamiana plants. Plants were grown in a P2 containment chamber under 16 h light at 26 °C and 8 h dark at 24 °C.
Aphis craccivora insects were collected in 2015 by G. Labonne
(INRAE, France) on Robinia pseudoacacia L. (false acacia) near Montpellier (France). A colony was initiated and main-tained on broad bean plants (Vicia faba L. cv. ‘Séville’) under 16 h light at 24 °C and 8 h dark at 21 °C.
Preparation of agroinfectious clones and agroinoculation
The construct for the Agrobacterium- mediated inoculation of ALCV was reported by Roumagnac et al. [9]. Agrobacterium
cultures were prepared and inoculated on broad bean plants as described by Ryckebusch et al. [10].
Plant DNA extraction and detection of ALCV DNA by PCR
ALCV infection of broad bean plants was monitored 4–6 weeks after inoculation by symptom observation and/or by PCR- mediated detection of viral DNA in total plant DNA extracts as described by Ryckebusch et al. [10].
Mechanical inoculation of ALCV
Two methods were used. In the first, 1 g of leaf material was collected from broad bean plants 4 weeks after agroinocula-tion with ALCV. The plant material was ground in an ice- cold mortar with 4 ml of a cold solution of 0.03 M sodium phos-phate (Na2HPO4) containing 0.2 % sodium diethyldithiocar-bamate (DIECA). After the addition of 0.2 g activated charcoal and 0.4 g carborundum, the plant extracts were rubbed onto the upper side of the youngest leaves of 22 10- day- old broad bean plants. Plants were abundantly rinsed with water 5 min after inoculation.
The second procedure was performed according to Susi et al. [11]: 2 g of leaf material was collected from broad bean plants 33 days after their agroinoculation with ALCV. Plant material was ground in a cold mortar with 8 ml of sodium phosphate buffer (0.02 M – pH 7.4). After the addition of 0.8 g of carbo-rundum, the inoculum sap was rubbed onto the youngest leaves of 30- day- old broad bean plants. The inoculated leaves were rinsed with water 15 min after inoculation.
ALCV transmission by aphids
Virus acquisition feedings were performed on broad bean plants 4–6 weeks after agroinoculation with ALCV, in a P2 containment chamber under 16 h light at 24 °C and 8 h dark at 22 °C. The duration of the acquisition access period (AAP) was specific to each test and carried out with 50, 1–3- day- old apterous adult insects per source plant. Virus inoculation feedings were performed on 8- day- old broad bean plants under 16 h light at 26 °C and 8 h dark at 24 °C. The duration of the inoculation access period (IAP) and the number of insects transferred to each test plant were specific to each test (see detailed descriptions below). The IAP was stopped by spraying the test plants with Pirimor G insecticide (1 g .l−1 in water). Virus transmission was determined by the appearance of symptoms and diagnostic PCR.
Aphid dissection, DNA extraction and qPCR
After collection, aphids were stored at −20 °C until use. Some aphids were dissected to assess the viral content in guts, heads and haemolymph. Dissection and DNA extraction were performed as described by Ryckebusch et al. [10].
Quantitative PCR (qPCR) amplification was performed with the LightCycler FastStart DNA Master Plus SYBR Green I kit (Roche) and the LightCycler 480 thermocycler (Roche). Primers ALCV2cEcmLV- F and ALCV2cEcmLV- R [10] were used at a concentration of 0.6 µM each in a total reaction
volume of 10 µl containing 8 µl Master- mix and 2 µl of DNA extract. The cycling protocol and the presentation of DNA accumulation results were as described by Ryckebusch et al. [10].
Plant material used for FISH
Broad bean and N. benthamiana plants were inoculated with agrobacteria transformed either with a binary vector containing an ALCV genome or with an empty binary vector as a negative control. ALCV- infected plants were identified 4–6 weeks after agroinoculation based on symptoms and an ALCV- specific PCR test (see above). FISH was performed on petioles or leaves at 6 weeks after agroinoculation. Cross- sections of petioles (1 cm) were cut with a razor blade from upper leaves of ALCV- agroinfected broad bean plants. Sections were fixed overnight at 4 °C with stirring in embryo dishes containing 4 % paraformaldehyde (PFA) diluted in PBS. Fixation was stopped by a 15 min incubation in PBS containing 0.1 M glycine. Petiole sections were embedded vertically in 8 % low- melting- point agarose in a 24- well tissue culture plate and stored overnight at 4 °C. The agarose blocks were extracted from the plates and cross- sections of 100 µm were produced with a Vibratome HM650V (Microm) and processed as described previously [41]. Leaf discs of
N. benthamiana plants were cut with drinking straws and
leaf cuticles were removed with forceps. Discs were fixed as described above for petioles. After rinsing in 70 % ethanol, discs were incubated for 2 h in a Carnoy solution (six volumes of chloroform, three volumes of ethanol and one volume of acetic acid), bleached for 10 min in a 6 % hydrogen peroxide solution and finally incubated for 1 h in PBS before FISH. Vein networks of broad bean leaves were pulled using sticky tape [42], and subsequently processed as for leaf discs.
Preparation of fluorescent probes and labelling procedure
The CP gene of ALCV was PCR- amplified from the recom-binant plasmid containing the ALCV genome, using the following primer pair: CP_ALCV_620 F, 5′- GAAGAGGGC-GAGAACGACAG-3′ and CP_ALCV_1025 R, 5′- GTGG TCTA TTTC AGCA GTTGCC-3′. The amplification product was used to generate a fluorescent probe by random priming with the BioPrime DNA labelling system (Invitrogen) and Alexa Fluor 568- labelled dUTP.
The probe (10 µl) was diluted in 290 µl of 20 mM Tris- HCl hybridization buffer (pH 8) containing 0.9 M NaCl, 0.01 % SDS and 30 % formamide. The diluted probe was denatured for 10 min at 100 °C and rapidly cooled on ice for 15 min. In parallel, plant samples (petioles, leaf- discs or veins) were soaked three times, for 5 min each, in hybridization buffer. Plant samples were then incubated overnight at 37 °C in embryo dishes containing probe solutions and sealed with parafilm membranes. After three washing steps of 5 min with hybridization buffer and two with PBS, samples were mounted on microscope slides in Vectashield antifade mounting medium containing 1.5 μg ml−1 DAPI for staining nuclei. Observations were performed using a Zeiss LSM700
laser scanning confocal microscope and acquired in stack mode.
EPG system
We used the EPG technique [43, 44] to investigate which specific stylet penetration activities of A. craccivora indi-viduals were associated with the acquisition of the virus. Different EPG waveforms can be recorded by connecting an insect and its host plant to an electrical circuit, reflecting particular biopotentials and electrical resistances associated with typical feeding activities [45, 46]. During intercellular stylet pathways, aphids perform numerous very brief punc-tures into non- vascular cells that result in EPG- detectable potential drops (waveform pd [44]). Two types of ‘anoma-lous’ pd (i.e. different from standard pd) were recorded just before aphids eventually start a sustained phloem sieve ingestion, the so- called repetitive pd (R- pd [47], and phloem- pd [48]). R- pds may reflect repeated punctures of phloem sieve elements, but their biological significance is unknown. Ultrastructural analyses with the biological model
M. persicae on sugar beet clearly demonstrated that
pds were associated with stylet penetrations in sieve elements or companion cells whereas other cells (mesophyll, bundle sheath cells and possibly phloem parenchyma) are penetrated during standard- pds [49]. The phloem- pds were shown to play an important role in inoculation of the semi- persistent phloem- limited beet yellows virus (BYV) by M. persicae and the persistently transmitted, phloem- limited BYDV by
Rhopalosiphum padi (Linnaeus, 1758) [48, 50]. Long stylet
penetration (i.e. several tens of seconds to several hours) in sieve elements that eventually attain phloem sap ingestion always begins by the stereotypical E1 waveform. It is related to salivation and described as the essential phase for inoculation of persistently or semi- persistently transmitted plant viruses by aphids [14, 50], whiteflies [51] or leafhoppers [52]. The E1 waveform is usually followed by a short transition period before the E2 waveform. This waveform recorded with R. padi in wheat has been related to passive sap ingestion concurrent with the secretion of watery saliva, and associated with inges-tion of BYDV [14]. It is commonly accepted that phloem- restricted viruses transmitted by hemipterans are acquired mainly during waveform E2 [14].
A Giga-8 DC- EPG device (EPG- Systems) was used to monitor probing and ingestion activities of virus- free newly emerged A. craccivora adults on leaves of virus- infected broad bean plants. The electrical circuits containing insects, plants and electrodes were placed in a Faraday cage to isolate them from electromagnetic interference. The electrical signals between the electrodes were converted into digital signals via the Di710- UL (DATAQ) analog- to- digital board. The digital signals were visualized and recorded on a computer using Probe 3.5 software (EPG Systems). Recordings were made under constant temperature (23±1 °C).
A gold wire (Ø 18.5 µm, 2–3 cm long) was fixed to the thorax cuticle of the backside of the insects using a drop of silver glue (EPG Systems). During this procedure, insects
were held stationary at the tip of a plastic pipe in which a slight suction was applied. The other end of the gold wire was pasted onto a copper electrode with the silver glue. This electrode (5 cm long, 2 mm in diameter) was inserted into the soil beside the plant whereas the insect was placed on a leaf. Before beginning each recording, individuals were given a fasting period of 30 min. Eight individuals were recorded in parallel. The voltage source was tuned as described by Tjallingii [53], so that the amplifier output signal was between +5 and −5 V, with positive values when stylet tips were outside cells and negative inside cells. New plants were used for each recording.
Signals were analysed using the software Stylet +a (EPG Systems). Individuals of many aphid species have been moni-tored by EPG over the past 50 years, including A. craccivora (e.g. [54, 55]), allowing an unambiguous interpretation of our recordings, in particular the waveforms correlated with the stylet location in the phloem (E1 and E2).
Detection by EPG of vector feeding behaviour associated with ALCV acquisition (experiments 1 and 2)
Young apterous adult aphids (⋍2 days old) were given access individually to upper leaves of ALCV- infected broad bean plants, and EPG recording was used to monitor their feeding behaviour.
In experiment 1, the objective was to test if ALCV acqui-sition is essentially associated with the ingestion of sieve tube content (waveforms E2). Thus, we dissociated two sets of aphids: 24 individuals were stopped at the end of their first phloem salivation phase (E1) (modality 1), whereas 30 individuals were monitored up to 4 h, a period that was expected to contain almost one phloem- feeding phase (E2) (modality 2). Indeed, preliminary analysis revealed that most aphids reached phloem in less than 1 h. After their monitoring, aphids were stored individually at −20 °C. Total DNA was extracted from each aphid and viral DNA was quantified by qPCR. Negative controls consisted of three adult aphids of the same batch that were given access to upper leaves of healthy broad bean plants.
In experiment 2, the objective was to test if the amount of ingested virus is correlated with the duration of the ingestion of sieve tube content. As virus acquisition was only detected with aphids of the E2 batch (experiment 1), we focused only on the duration of E2 for statistical analysis. Twenty- six individuals were monitored for 4 h. For each individual, we calculated the variable WDi (Wave-form Duration by Insect, i.e. the sum of durations of all its events of one waveform type made by each individual insect that produced that waveform) related to E2 pattern as defined by Backus et al. [56]. Total DNA of each aphid was extracted and viral DNA was quantified by qPCR. Finally, the amount of virus harboured by each insect was plotted against WDi- E2.
Individual transmission probability and
transmission rates in relation to aphid numbers (experiments 3 and 4)
In experiment 3, the individual transmission success of ALCV by aphids was determined in relation to their virus content. After a 3- day AAP on ALCV- infected broad bean plants, 43 individuals were each given individual access to one healthy broad bean plant for a 5- day IAP. The viral DNA of each of the 34 individuals that were alive at the end of the IAP was quanti-fied by qPCR. The 34 plants associated with the surviving aphids were sampled 4 weeks after the IAP and PCR- tested for ALCV.
In experiment 4, the transmission rate of ALCV was deter-mined with aphid batches of various sizes in eight inde-pendent transmission tests (Table S1, available in the online version of this article). The batch sizes were of one, five, 10, 20, 30, 40, or 100 individuals depending on the test. The average transmission rate determined for each batch size was used to plot a curve showing the expected transmission rate as a function of the number of individuals per test plant. The theoretical transmission rate TR is defined as TR=1−(1−pi)n
in which pi is the probability that at least one aphid is infective in a population, 1−pi is the probability of an aphid not being infective and n is the batch size.
Kinetics of ALCV accumulation in aphids (experiment 5)
Young apterous adult aphids were allowed to feed on ALCV- infected broad bean plants for 2, 6, 15 24, 48 and 82 h. Indi-viduals were collected at each time point. Their total DNA was extracted in pools of five individuals, and the amount of ALCV DNA was quantified by qPCR. The same test was performed with AAPs of 2, 4, 6, 19, 24, 48, 72 and 96 h except that DNA was extracted from individual aphids. Some of the individuals that were not moved to infected plants for an AAP were collected and tested as negative controls (time point 0 h). Transmission rates in relation to AAP duration (experiment 6)
Eight independent transmission tests were carried out with five or 10 apterous adult aphids per test plant. The transmis-sion rate was determined with 19 or 20 test plants per AAP duration. Acquisition access period duration ranged between 1 and 120 h and IAP duration was 5 days.
ALCV persistence in aphids (experiment 7)
After a 3- day AAP on ALCV- infected broad bean plants (D0), apterous adult aphids were transfered to non- infected broad bean plants in groups of 10 individuals per plant. After 4 days, insects were similarly transferred for two more sequential 4- day feedings on healthy broad bean plants. At D0 and at the end of each sequential 4- day post- AAP feeding (i.e. at D4, D8, D12), 80 insects in groups of 10 were collected. Total viral DNA was extracted from 40 insects in groups of 10 per time point, and viral DNA was quantified by qPCR. Aphids of the four other groups were dissected (see above) and the
viral DNA was quantified from each pool of 10 organs (guts and heads) and 10 haemolymph samples. For each collection time, we obtained four independent values of the amount of viral DNA contained in 10 aphids, organs or haemolymph samples. The amount of DNA was not measured in the whole body at D12 because of a limited number of aphids still alive. All values were then divided by 10 to estimate the mean copy number of viral DNA per insect. As a control, individuals from the same rearing as those used for acquisition were analysed.
Minimum latent and inoculation periods (experiment 8)
Determining the latent period with transmission tests is chal-lenging because this period clearly overlaps with AAP and IAP. Therefore, its duration can only be estimated with the minimum duration of [AAP+IAP] that results in a successful transmission. Due to overlapping with AAP and IAP, the estimated latent period should be considered a maximum. In the first set of four transmission tests (tests 1–4), five to 10 young apterous adult aphids were given a 15 h AAP on ALCV- infected broad bean plants and then shifted to test plants for various IAP durations between 3 and 48 h. To estimate the inoculation period, five to 10 aphids were given AAPs of 48 or 72 h and then shifted to test plants for IAP of various durations between 1 and 120 h (tests 5–7). The number of plants in each treatment was between nine and 20. Infection success was determined with symptom observation and PCR detection of viral DNA.
Vertical transmission of ALCV (experiment 9)
In a first test, aphids were reared on ALCV- infected broad bean plants for 2 weeks. Apterous adult individuals were shifted into a transparent box for 6 h. Progenies produced in the box were given access to nine healthy plants (five nymphs per plant). As a positive control of ALCV transmission, adults from the box were given access to three healthy plants (five apterous adults per plant). The test was repeated indepen-dently 1 month later with eight healthy plants, each exposed to five nymphs. To complete the test, the vector competence of L1–L2 nymphs produced on ALCV- infected plants was tested. The nymphs were moved to broad bean test plants, five individuals per plant. Eight- day- old adults were similarly shifted to test plants as a control.
Vertical transmission was also evaluated by testing the pres-ence of viral DNA in two pools of 30 nymphs produced by viruliferous adults. Pools were from broad bean plants of the third sequential passage in the persistence test (experiment 7). Total DNA was extracted from each of the two pools of nymphs and the presence of viral DNA was determined by qPCR.
Effect of ALCV on aphid fitness (experiment 10) To determine whether ALCV could affect the fitness of its vector, we estimated the intrinsic rate of increase (rm), a parameter combining fecundity and developmental time
[57]. It was defined as rm=0.738.Loge(Md)/d, according to the simplified method of Wyatt and White [58] where d is the mean number of days from aphid birth to reproduction (i.e. pre- reproductive time), and Md the average number of progeny produced in a time equal to d. We also estimated: (i) the mean generation time (T), i.e. the mean length of aphid generation, calculated by the approximation of Wyatt and White [58] (T=d/0.738); and (ii) the doubling time (DT), i.e. the time required by the aphid population to double its size, which can be derived from the standard definition of rm as
DT=Loge [2]/rm (e.g. [59]). The experiment was conducted with two cohorts of 44 individuals prepared as follows: on day 0 (D0), 2- to 3- day- old young apterous females from a synchronized population were placed individually on healthy or infected broad bean seedlings for a 4 h laying, and removed after that. At day 4 (D4), nymphs were removed except one. From day 6 (D6), individuals were observed daily to detect the age at which each individual laid its first nymphs (i.e. to determine d, the pre- reproductive time). Then, the number of nymphs produced during a period of d days was counted for each individual. When nymphs retained for laying turned out to be alate, they were excluded from the test. Similarly, counts that were performed with adults that were not found at the end of the experiment, or that produced very few or no nymphs, were excluded from the statistical analysis to avoid interpretation bias. Due to this selection, six viruliferous and nine non- viruliferous individuals were excluded from the analysis. The rm value was estimated for each individual for comparison of mean differences, but the rm values presented in the results are the group values, and standard errors were calculated using the bootstrap technique [60].
Statistical analysis
All statistical analyses were conducted with the R software v3.6.1 [61].
To interpret the results from experiments 2, 5 and 6, we applied loess (an acronym for locally weighted regression) smoothing to fit a curve through points in each scatterplot [62]. With this non- parametric regression technique, no assumptions have to be made about the underlying distribu-tion of the data [63]. Smoothed curves were obtained using the loess method implemented in the ggplot2 package of R [function geom_point()], with default values for α=0.75 (this parameter determines the degree of smoothing, i.e. the proportion of all data that to be used in each local fit), and for λ=2 (i.e. the local regression fitting based on quadratic equations). In experiment 2, Kendall’s tau coefficient was used to measure the ordinal association between cumulative time in E2 and viral load. The test was performed with the
cor. test() function, method kendall. To interpret the results
from experiment 7, box- plots were used [function boxplot() of the package stats], and means were compared using the Kruskal–Wallis rank- sum test (function kruskal. test of the package stats). When the null hypothesis of mean equality was rejected at the 5 % threshold, the means of each pair of modalities were compared using the multiple comparison method based on the Benjamini and Yekutieli [64] procedure
[function pairwise. t. test() with P- value adjustment method: BY]. The means of the parameters estimated in experiment 10 were compared using the Wilcoxon rank- sum test [function
wilcox. test() of the package stats]. Standard errors of these
parameters were calculated using a bootstrap procedure with the boot() function of the boot package.
RESULTS
ALCV is phloem-restricted and heterogeneously distributed in this tissue compartment
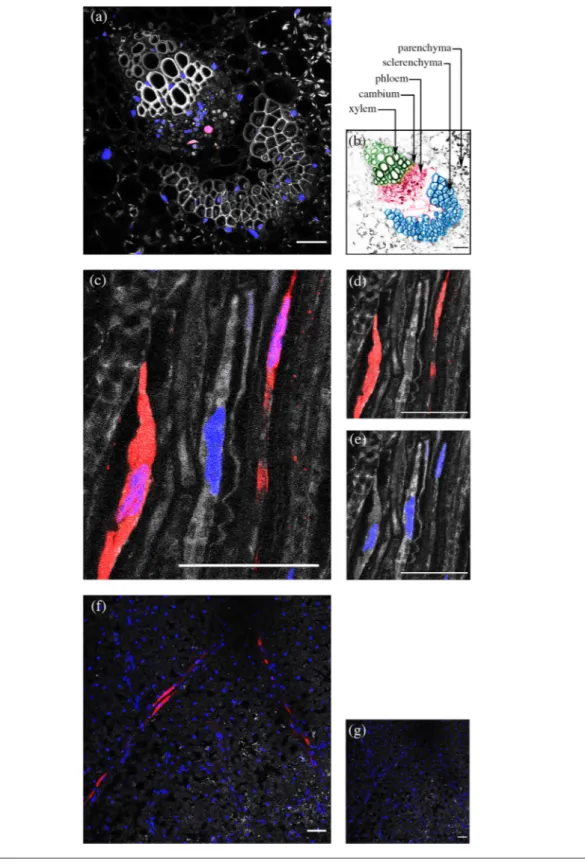
A fluorescent probe complementary to the CP gene of ALCV was used to localize ALCV in broad bean plants by FISH (Fig. 1). Fluorescent labelling was detected in petioles of plants agroinfected with ALCV (Fig. 1a) but not in petioles of mock- inoculated plants. Specific labelling co- localized with cell nuclei and was detected in relatively few cells, with a maximum of three labelled cells per cross- section. Specific labelling was restricted to areas located between xylem and sclerenchyma tissues, the location of phloem tissue (Fig. 1a, b). ALCV- specific labelling was also detected in the phloem of vascular tissues pulled from broad bean leaf lamina (Fig. 1c). The labelling was restricted to some sections of the vascular network and only some cells of these sections were labelled. The specifically labelled cells were nucleated and character-ized by an elongated shape typical of phloem parenchyma cells or companion cells.
Translaminar observations of ALCV- infected N. benthamiana leaves showed FISH labelling in phloem but not outside the vascular network (Fig. 1f). The results suggesting that ALCV cannot move to or from non- phloem cells are consistent with the fact that none of the mechanically inoculated plants were infected.
ALCV distribution was also investigated by characterizing plant tissues from which aphids can acquire the virus (experi-ment 1). To do this, we monitored the feeding behaviour of 54 aphid individuals on ALCV- infected plants by EPG. In most of the 24 individuals stopped before the E2 waveform, E1 was preceded with at least one pd (Fig. 2c) exhibiting the typical phloem- pd features described for M. persicae and R.
padi [49]. First, the magnitude of their potential drop was
the same as that recorded in phase E1 and lower than that observed on standard pds. Second, the frequency of intervals between their downward peaks in subphase II-2 was at least two- fold lower than that of standard pd (Fig. 2c). In spite of this phloem- pd, ALCV was not detected by qPCR in the 24 individuals stopped before E2. ALCV was also not detected in the 10 individuals for which no E1 or E2 waveforms were observed. Among the 20 individuals that reached E2, 14 were ALCV- positive by qPCR. Five ALCV- negative insects remained less than 20 min in phase E2, a duration that may have been too short to acquire a detectable amount of viral DNA. Nevertheless, one ALCV- negative aphid ingested sieve tube content for more than 150 min, suggesting that ALCV is not equally distributed in the sieve tube network. Although ALCV is present in companion cells and possibly
Fig. 1. Histological localization of ALCV DNA in plant tissues by FISH. The ALCV- specific DNA probe is labelled with red Alexa (568) fluorochrome. Nuclei are DAPI- blue- stained. Colour channels were merged in panels a, c, f and g, but not in panels d and e. (a) Cross- section of a petiole of an ALCV- infected broad bean plant, showing a vascular bundle. (b) Same as (a) but with artificial colours: xylem in green, cambium in yellow, phloem in pink, sclerenchyma in blue, parenchyma in grey. (c, d, e) Elongated cells of vascular bundles pulled from a leaf of an ALCV- infected faba bean plant. (d) Same as (c) but only with the red channel. (e) Same as (c) but only with the blue channel. (f) Translaminar view of a leaf sampled on an ALCV- infected Nicotiana benthamiana plant. (g) Same as (f) except that the leaf was collected from a healthy plant. Preparations were examined with confocal microscopy. Bars, 50 µm.
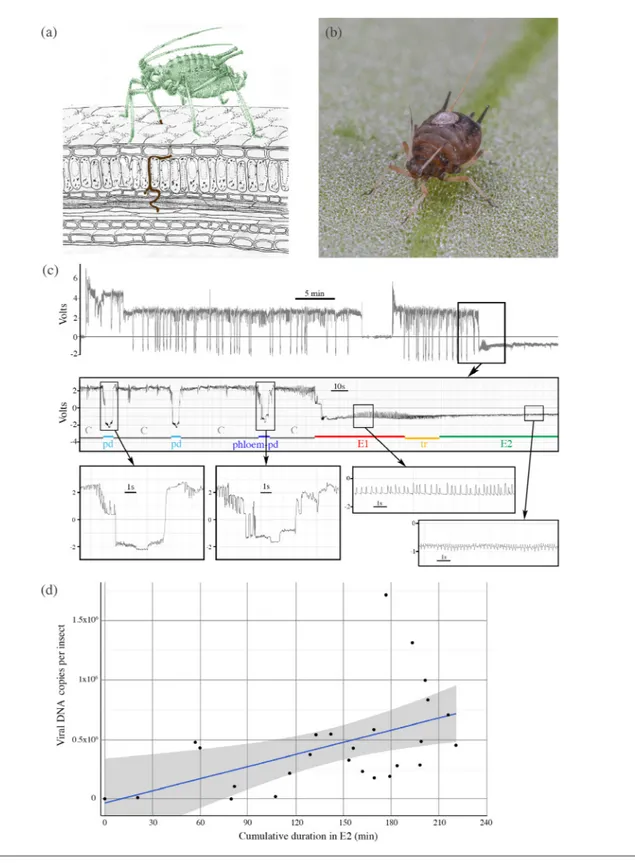
Fig. 2. EPG design, and A. craccivora feeding behaviour associated with ALCV acquisition. (a) Schematic illustration of an aphid in feeding position showing the intra- leaf route of its stylets until a vascular bundle. (b) A.craccivora adult with a thin gold wire glued to its dorsum with a small drop of silver print paint. (c) Overview of typical EPG waveforms produced by an apterous adult feeding for 1 h on a branch of a broad bean plant, and expanded views of the waveforms studied: pd (intracellular puncture in epidermis or mesophyll cell), E1 phase (salivation into sieve tube elements of the phloem), E2 phase (ingestion from sieve tube elements), and tr phase (transition between E1/ E2). (d) Cumulative duration in phase E2 of young apterous adults measured during 4 h EPG recordings on ALCV- infected branches of broad bean plants, plotted against their post- EPG viral DNA content (experiment 2). A smoothing method was used to add a regression line with 0.95 confidence interval shown in grey.
in parenchyma cells (FISH), ALCV was only acquired from sieve elements.
Efficiency of acquisition is dependent on the puncture site and AAP duration
Considering the heterogeneous phloem distribution of ALCV revealed by FISH and suggested by EPG, the efficiency of virus acquisition by aphids may depend on the puncture site. This hypothesis was validated with a set of adult aphids for which we accurately assessed both the duration of phloem ingestion by EPG (E2 waveform) and the acquired viral DNA content by qPCR (Fig. 2d). Indeed, there was no correlation between E2 cumulated time and the amount of virus ingested by the aphid (Kendall’s rank correlation thau, τ=0.0027). For example, two aphids for which the E2 waveform was recorded for about 1 h each acquired as many or more viral DNA copies
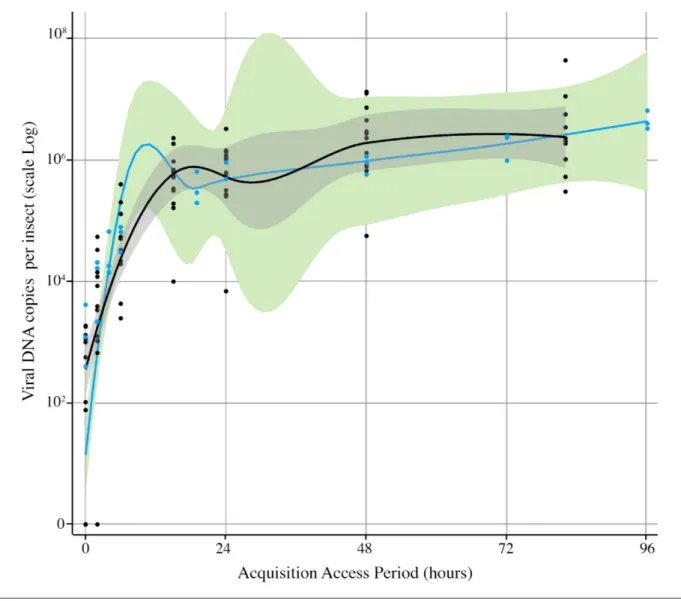
(0.5×10⁶) than aphids for which E2 recording lasted more than 150 min. Furthermore, one aphid for which E2 recording lasted almost 2 h acquired very little viral DNA. Neverthe-less, it is noteworthy that individuals that fed for more than 107 min were all qPCR- positive with more than 105 copies of viral DNA. This result suggests that despite the heterogeneous distribution, the virus is accessible throughout the phloem network and thus phloem- feeding durations and viral DNA accumulation may be positively correlated with longer AAP durations, irrespective of the feeding site. This prediction was validated by monitoring viral DNA accumulation in individuals that were given access to ALCV- infected plants for durations ranging between 2 and 96 h (Fig. 3). Aphids accumulate a large amount of virus in the first 15–19 h of acquisition. During this initial period, viral load per insect increased sharply up to 4–7×10⁵ viral DNA copies per insect.
Fig. 3. Kinetics of ALCV accumulation in A. craccivora. Viral accumulation was assessed by monitoring viral DNA contents with qPCR on individuals that were given AAPs of 2–82 h (black dots) or 2–96 h (blue dots). Black dots correspond to individuals analysed individually, and each blue dot corresponds to the average viral content of five individuals analysed by qPCR in a pool. For each set of dots, a smooth local regression was performed, in black for the black dots and in blue for the blue dots. A 0.95 confidence interval is displayed around the smoothed curve in grey and green colours respectively.
Thereafter, the viral increase was lower with only 10- fold increase to a plateau of about 2–7×10⁶ viral DNA copies per insect that was reached at 48 h (Fig. 3).
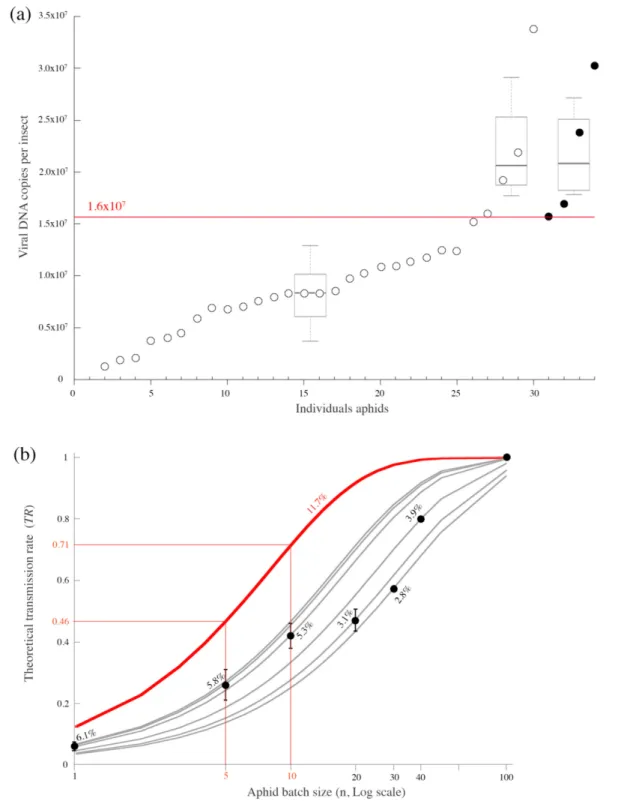
A high accumulation of ALCV is necessary for efficient transmission but not always sufficient The accumulation dynamics of ALCV in aphids revealed that viral DNA content reaches more than 106 viral DNA copies per insect after 2 days of AAP (Fig. 3). However, it was not known whether a threshold amount of acquired virus needs to be reached for an insect to transmit the virus. To test the threshold hypothesis, 43 individuals, following a 3 day AAP, were given access to test plants – one test plant per individual – to determine their ability to transmit the acquired virus (Fig. 4a). The viral amounts assessed by qPCR in the 34 individuals collected alive at the end of the 5 day IAP were consistent with the threshold hypothesis. Indeed, all individuals harbouring viral amounts below 1.6×10⁷ failed to transmit ALCV. Transmission was possible only when viral content was above this threshold. However, while eight individuals had a viral content above the threshold, only four transmitted ALCV. Of note, the average viral content of the four transmitters could not be distinguished from that of the four non- transmitters (see box- plots in Fig. 4a). Thus, although a minimum viral content is necessary, it is not a sufficient condition for transmission. Other parameters, yet to be determined, may also influence the efficiency of viral inoculation.
The individual transmission rate (pi⋍11.8 %; 4/34) is relatively low considering the long durations of AAP and IAP, 3 and 5 days respectively. Using pi⋍11.8 %, theoretical transmis-sion rates (TR) were estimated as a function of the number of individuals used per test plant according to the formula
TR=1−(1−pi)n (Fig. 4b, red curve). Surprisingly, the
trans-mission rates derived from transtrans-mission tests performed with different numbers of individuals per test plants (Table S1) were all below the expected rates (Fig. 4b). Indeed, the theoretical individual transmission rates derived from the observed transmission rates were between 2.8 and 6.1 %. To summarize, the individual transmission rate of ALCV by A.
craccivora is generally around 4–5 % with a maximum of
12 % when the transmission was performed with one insect per test plant. Although the increase of transmission rate is positively correlated with the increase of viruliferous individuals, transmission success cannot be easily predicted from individual transmission rates. However, given these results, transmission rates of 18–45 % can be expected with five or 10 individuals per test plant. These conditions were used for all subsequent tests because they allow the effects of other transmission parameters to be assessed using a minimum number of aphids and tested plants.
Optimal transmission rate needs a minimum AAP duration of 48 h
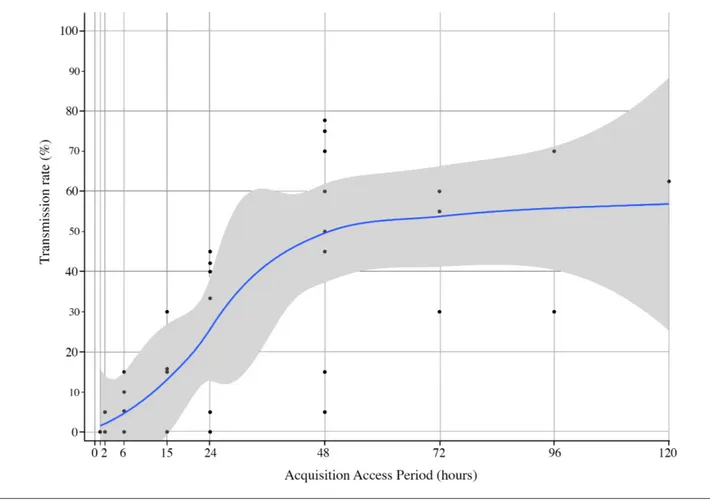
To determine the minimum AAP duration needed to reach an optimal transmission rate, five or 10 individuals per tested plant were used as defined above. Fig. 5 shows that
up to 48 h, the transmission rate is a quasi- linear function of acquisition time, reaching a maximum of about 50–60 %. Increasing acquisition time beyond 48 h did not increase the transmission rate, even up to 5 days. It is noteworthy that the maximum transmission rate was not reached following a 24 h AAP although the highest increase of virus accumu-lation was achieved in less than 24 h (Fig. 3). These results are consistent with the threshold hypothesis. Indeed, the moderate virus accumulation that occurs after the initial intensive virus accumulation (19 h) is critical for an optimal transmission rate. For unknown reasons, transmission rates were sometimes different between tests carried out under the same experimental conditions.
Contrasted ALCV persistence in aphid cellular compartments, and potential impact on virus inoculation
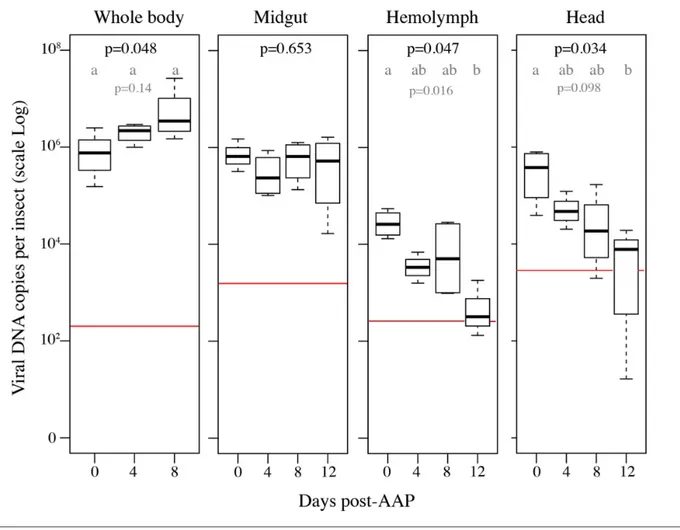
ALCV was previously reported to circulate and persist in A. craccivora based on the detection of ALCV DNA in midguts, heads and haemolymph 6 days after a 3- day AAP [10]. This result was confirmed and expanded upon by monitoring the dynamics of viral DNA content in these compartments up to 12 days after a 3- day AAP (Fig. 6). Viral DNA monitored in the whole body exhibited an increase between 0 and 8 days post- AAP and the effect of time was significant according to the Kruskal–Wallis test (P=0.048). However, the pairwise multiple comparison test did not reject the null hypothesis of equality of means estimated for the three post- AAP durations (P≥0.14). This apparent contradiction between the tests can be explained by the low number of repetitions (n=4) for each duration. We conservatively conclude that the viral load in the whole body did not increase after AAP, which is consistent with the midgut results in which no significant differences were detected between the samples collected over time (Kruskal– Wallis test, P=0.653). In haemolymph and heads, the viral amount exhibited a decrease over time (Kruskal–Wallis test, respectively P=0.047 and P=0.034). The pairwise multiple comparison test further supports this decrease in the haemolymph. Indeed, a significant difference in viral content was detected between 0 and 12 days AAP (P=0.016). For one of the four haemolymph samples collected at 12 days post- AAP, no viral DNA was detected. The pairwise test did not show any significant difference in viral content in the heads (P=0.098). Nevertheless, for one sample at each of the 9- and 12- day post- AAP sampling, no viral DNA was detected.
The decrease of viral content in the haemolymph and the head compartments was thought to limit the amount of virus that is potentially released from the insect through salivary glands, and hence, the transmission rate. To test the effect of IAP duration on the transmission rate, we used a 48- or 72- h AAP which, according to previous tests, produced viruliferous insects that exhibit optimal infectivity (Fig. 5). With these experimental conditions, it was expected that the virus accumulation would not be a limiting factor for virus inoculation. However, in spite of
Fig. 4. Transmission rate of ALCV by A. craccivora individuals and relationship with their viral amount (a) and the number of individuals per test plant (b). (a) Viral DNA amount assessed by qPCR in 34 individuals after a 3 day AAP on ALCV- infected broad bean plants and a 5 day IAP on healthy plants with one individual per test plant. Solid circles represent individuals that transmitted ALCV to their test plant, while open circles represent non- transmitters. Only individuals in which viral content was above 1.6×10⁷ viral DNA copies (red
horizontal line) transmitted ALCV. The box- plots apply respectively to the 25 individuals below this threshold, to the four individuals above the threshold that did not transmit and to the four transmitter aphids. (b) Transmission rates were determined experimentally (black dots with standard deviations) in seven independent transmission tests performed with one, five, 10, 20, 30, 40 and 100 individuals (experiment 4). For each aphid batch size, the mean individual transmission rate (pi) was deduced from TR=1−(1−pi)n, knowing TR and n
(values in % on the figure) (see also Table S1). The grey curves are the theoretical curves of TR as a function of n for these pi values. The
AAP durations compatible with high virus accumulation, the inoculation was successful only with an IAP duration of at least 24 h (Table 1).
Additional transmission tests were performed to investi-gate the minimum latent period. To do this we had to use individuals that were given an AAP that was long enough to produce infective aphids (Fig. 5) and short enough to limit the risk of exceeding the potential minimum time of the latent period during AAP. Using 15- h AAPs (Table 1), no virus transmission was obtained with IAPs of 3 h (0 out of 10 test plants), 5 h (0/40), 6 h (0/10) and 9 h (0/40). It was only with a 12- h IAP that transmission was observed (1/20), which indicates that the minimum latent period is, at most, 27 h. Additionally, with this latent period the minimum duration of successful IAPs was reduced to 12 h. No vertical transmission
Considering the relatively low efficiency of ALCV inocula-tion, it cannot be excluded that its fitness may depend also on vertical transmission. To test this hypothesis, nymphs produced by viruliferous aphids were tested either for virus presence or infectivity on broad bean plants. In the three
independent tests, nymphs were not detected as PCR- positive for ALCV DNA and did not induce ALCV infec-tion in broad bean plants. The viruliferous parental aphids which were tested as positive controls induced infection in two of the five test plants upon which they were fed. L1–L2 nymphs produced on ALCV- infected plants transmitted ALCV as efficiently as adults from the same plants, with transmission rates of 53 % (8/15) and 50 % (5/10), respec-tively (five individuals per test plant).
No ALCV-associated fitness cost in aphids
The fitness of viruliferous and non- viruliferous aphids was compared by estimating the intrinsic rate of natural increase (rm) (Table 2). The mean time of development of non- viruliferous individuals was not significantly different from that of viruliferous individuals (d=7.88 days versus 7.39 days, Wilcoxon test, P>0.1). Similarly, the average number of nymphs laid during a period equal to the time of development (d) was not significantly different between viruliferous and non- viruliferous individuals, with 55.17 and 49.79 nymphs, respectively. Hence, rm, the combination of both parameters,
Fig. 5. Relationship between AAP duration and transmission rate of ALCV by A. craccivora. Each dot corresponds to a transmission rate determined with AAP up to 5 days carried out with 19 or 20 test plants and with five or 10 individuals per test plant. The figure summarizes the results generated with eight independent transmission tests (experiment 6). A smooth local regression was performed, and the 0.95 confidence interval is displayed in grey.
was similar between non- viruliferous and viruliferous indi-viduals (0.418 versus 0.422 progenies per female per day).
DISCUSSION
It has only been in the last decade following the advent of metagenomics approaches that aphid- transmitted geminivi-ruses were discovered. The CNP transmission mechanism was demonstrated for ALCV, one of the members of the genus
Capulavirus in which these new geminiviruses were classified.
Here, we further described the transmission cycle of ALCV with a particular focus on parameters that are potentially associated with transmission efficiency.
ALCV is restricted to, and heterogeneously distributed in, phloem tissues
To monitor the tripartite interactions between the plant, the virus and the vector during the acquisition process of ALCV
by A. craccivora, we used an original approach comprising three complementary techniques. While FISH localized ALCV in nucleated phloem cells, EPG and qPCR analysis showed that it is acquired only by aphids having access to sieve elements (E2 aphid group). In spite of the phloem- pds, ALCV was not detected in individuals of the E1 aphid group. We assume that phloem- pds are too short (a few seconds) and their frequency too low [rarely more than three or four E1 phases preceded by phloem- pd(s) during the 4 h of recording] to enable ALCV acquisition at a qPCR- detectable level. Of note, the phloem- limited luteovirus BYDV was detected in individuals that were stopped before E1 or during E1 [48]. This inconsistency may be explained by the fact that BYDV is a RNA virus that replicates in the cytoplasm whereas the replication ofALCV takes place in the nuclei as a DNA virus. The short sucking during phloem- pds might be strong enough to acquire a cytoplasmic- replicating virus but not a nuclear- replicating virus.
Fig. 6. ALCV persistence in A. craccivora cellular compartments. The box- plots show the amount of ALCV DNA in whole bodies, midguts, haemolymph and heads of aphids following a 3- day AAP on ALCV- infected broad bean plants (D0), and after three sequential 4- day post- AAP feedings (i.e. D4, D8, D12). The content of ALCV DNA was determined by qPCR in four pools of 10 non- dissected individuals and four pools of 10 organs or haemolymph. Accumulations are reported as log10 of the number of viral DNA copies. The red lines represent the highest value obtained from individuals sampled before the 3- day AAP. The means for each duration were compared by a Kruskal–Wallis test. When the null hypothesis of mean equality was rejected (P<0.05, P- values in black), the means of each pair of modalities were compared using the multiple comparison method based on Benjamini and Yekutieli’s procedure. Different letters indicate significant differences at the level shown in grey.
Like the phloem restriction of ALCV, its heterogeneous distri-bution was also analysed with combined approaches. Thus, during a 4- h EPG monitoring of aphids, the lack of correlation between the duration of sieve tube probings (waveform E2) and the amount of acquired viral DNA assessed by qPCR is consistent with the heterogeneous distribution observed by FISH. Geminiviruses have previously been examined for their phloem restriction (e.g. [18]) but heterogeneous virus distri-bution within the phloem network was to our knowledge never mentioned although it may be implicit from previous reports. Thus, FISH labelling of TYLCV in longitudinal sections of infected plant tissues was not continuous along the vascular tissue, suggesting heterogeneous virus distribu-tion [65]. Moreover, the amount of TYLCV acquired by B.
tabaci whiteflies during a 4- h AAP was uneven [66]. In this
later report, however, it cannot be excluded that different durations of sieve tube probings may have contributed to the uneven amount of acquired virus, because, unlike in our study, whitefly probings were not monitored by EPG. Our results suggest that insects that accumulated the highest concentration of ALCV DNA punctured sieve elements close to virus- replicating phloem cells.
Heterogeneous intra-phloem distribution of ALCV does not prevent efficient acquisition
When the duration of probing in sieve elements (waveform E2) was beyond 100 min, aphids were all ALCV- positive, irrespective of their puncture site, suggesting generalized contamination of the sieve tube network. Hence, when AAPs were extended for 24 h, ALCV accumulation increased steadily on average. Such a correlation between AAP dura-tions and virus amount was detected with other geminiviruses and is a common feature of non- propagative transmission [67].
ALCV accumulation is in the same range as that of other geminiviruses, with 106 DNA copies per individual from 15- h AAP and in the range of 106 to 107 DNA copies per indi-vidual between 2 and 4 days of AAP. Indeed, these amounts are slightly higher than that of MSV in its leafhopper vector following a 6- day AAP (<106 DNA copies per individual) [68], and they were similar to those of TYLCV and watermelon chlorotic stunt virus (WmCSV) in their whitefly vector following AAPs of 5 days (about 5×10⁷ and 4×10⁶ DNA copies per individual respectively) [69].
Table 1. Description of the seven transmission tests designed to estimate the minimum latency and inoculation periods (experiment 8)
AAP (h) IAP (h) AAP+IAP
(h) Test 1, n=5 Test 2, n=5 Test 3, n=10 Test 4, n=10 Test 5, n=5 Test 6, n=10 Test 7, n=10
15 3 18 0/10 15 5 20 0/20 0/20 15 6 21 0/10 15 9 24 0/20 0/20 15 12 27 1/20 0/20 0/20 0/10 15 24 39 1/20 0/20 0/20 0/10 15 48 63 0/20 0/12 48 1 49 0/10 48 6 54 0/10 48 12 60 0/11 0/10 48 24 72 2/12 0/10 48 48 96 4/10 1/10 48 120 168 0/10 72 3 5 0/10 72 6 78 0/10 72 12 84 0/10 72 24 96 0/9 72 48 120 0/10 72 120 192 2/10
Ratios between the number of infected plants and the number of test plants are indicated for each test plant and transmission condition. Successful transmission rates are in bold. The infection status of the test plants was determined with symptoms and/or the detection of ALCV DNA by PCR. AAP, acquisition access period; IAP, inoculation access period; h, hour; n, number of aphid individuals per test plant.
Transmission success depends on a high threshold of virus amount in aphids
Previous transmission studies with geminiviruses showed that infectivity of viruliferous vectors correlates with AAP duration [70, 71]. These results suggest that insect infectivity depends on virus content, but to our knowledge, a threshold of virus concentration beyond which an infection is possible has not been reported. Here, we found that individual aphids with fewer than 1.6×10⁷ DNA copies were not infective. As this threshold was determined after 5 days of IAP, the esti-mated copy numbers of viral DNA correspond to persistent virus, probably internalized, and therefore relevant for infectivity. Interestingly, infection rates obtained with five or 10 individuals per test plant following increasing AAP dura-tions are consistent with a critical threshold of ALCV DNA content. Indeed, the maximum infection rate, around 50 %, was reached only from a 48- h AAP (Fig. 5), which according to the accumulation dynamics of ALCV in A. craccivora (Fig. 3) is the time needed for a majority of individuals to reach a virus content that is higher than 106 viral DNA copies. Thus, although the ALCV content of 24- h AAP individuals was only slightly lower than that of 48- h AAP individuals, the differential transmission rate was about 2 on average. The transmission tests performed with groups of increasing numbers of insects per test plant revealed that the virus accu-mulation threshold determined for individual transmission success could not be reached collectively just by the addition of the viral amounts delivered by individuals. The transmis-sion rates obtained with groups of individuals were lower than the expected (i.e. theoretical) rate calculated from the indi-vidual transmission rate (12 %). This result shows that when an insect is alone on a plant, its probability of transmitting
ALCV is higher than if it is in a group. This result may be explained by defence mechanisms to aphid feeding or virus infection which may be more effectively triggered by a group of aphids than by an individual.
Although necessary for infectivity, reaching the predicted concentration threshold is not sufficient because 50 % of the individuals that reached the threshold were not infective during the 5- day IAP. A similar conclusion was inferred from a study with the luteovirid PLRV [72]. Indeed, although PLRV accumulation assessed by ELISA post- IAP in non- transmitter
M. persicae aphids was in average significantly lower than
that of transmitters, some transmitter aphids accumulated less virus than non- transmitter aphids. As aphids are geneti-cally highly homogeneous due to their clonal multiplication, the contrasted infectivities may be associated with stochastic phenomena, such as the site of inoculation, a particular feeding behaviour, or particular physiological conditions influencing the virus distribution along the transmission route in the insect. The effects of aphid endosymbionts on insect probing behaviour [73] and possibly on ALCV move-ment in the insect could influence virus transmission. The low infectivity of aphids is associated with the low persistence of ALCV in haemolymph and head The highest transmission rate of ALCV using a single A.
crac-civora insect (individual transmission rate) was 12 %, much
lower than that of other circulatively transmitted viruses. For example, within the family Geminiviridae, MSV [30] and TYLCV [74] were respectively transmitted by their leafhopper and whitefly vectors with an individual transmission rate of 90 %. Similarly within the family Luteoviridae, the polerovirus PLRV was transmitted by the aphid M. persicae with an indi-vidual transmission rate of 60 % [75] and the luteovirus BYDV by R. padi with a rate of 94 % [14].
Since acquisition dynamics and maximum viral content of ALCV in A. craccivora individuals are similar to those of non- aphid transmitted geminiviruses, the low transmission rate of ALCV can be inferred to be associated with further stages of its circulation through the insect. The retention studies with dissected individuals show contrasted persis-tence. Whereas the virus content is stable in the midgut, it decreases in the haemolymph and heads. This decrease may be due to hindrance to virus flow from the gut to these compartments and/or degradation of viral DNA in these post- gut compartments due to insect- defence mechanisms such as autophagy, already described in the whitefly B. tabaci for TYLCV [76, 77]. Based on a recent report, the excretion from the salivary glands is not expected to account for much of the virus decrease in the post- gut compartments [40]. Indeed, using the same Robinia population of A. craccivora as here and a nanovirus clone of faba bean necrotic stunt virus (FBNSV), this study showed that although the accumulation of the two viruses were similar in the head compartment, the excretion of ALCV was far lower than that of FBNSV. Barriers to gut exit or post- gut barriers were associated with relatively low or no transmission in other insects/virus
Table 2. Comparison of the fitness of A. craccivora individuals that acquired ALCV to that of non- infected individuals
Estimated parameter Non- viruliferous aphids Viruliferous
aphids
N=35 N=38
d [day (se)] 7.00 (0.04) 6.74 (0.08)
Md [day (se)] 55.17 (2.63) 49.79 (2.69)
No. of nymphs [per day
(se)] 7.88 (0.38) 7.41 (0.40)
rm [progenies/femle/day
(se)] 0.418 (0.006) 0.422 (0.009)
T [day] 9.49 9.13
DT [day] 1.64 1.62
d: mean number of days from aphid birth to reproduction (i.e. pre-
reproductive time); Md: average number of progeny produced in a time equal to d; No. of nymphs: mean number of nymphs produced per day during a time equal to d; rm: intrinsic rate of increase; T: mean length of aphid generation; DT: time required by the aphid population to double its size; se: bootstrap estimator of standard error.
combinations. The non- transmission or non- efficient trans-mission of BYDV by Rhopalosiphum maidis (Fitch, 1856) and
R. padi, respectively, were associated with different penetration
efficiencies into the aphid salivary gland basal lamina (SGBL) [78]. The SGBL barrier was recently proposed to account for the absence of transmission of ALCV by a non- vector popula-tion of A. craccivora [10], but a barrier to gut exit or other post- gut barriers cannot be excluded. Macrosiphum
euphor-biae (Thomas, 1878) aphids transmitted the polerovirus PLRV
much less efficiently than M. persicae aphids [72]. As the low transmission of PLRV by M. euphorbiae could not be ascribed to failure to acquire or retain PLRV, or to degradation of virus particles in the aphids, the authors proposed that only a few PLRV particles pass from the haemolymph to saliva in this species. In one of the rare begomovirus/B. tabaci combina-tions in which no transmission occurred, tomato yellow leaf curl China virus (TYLCCNV) and the MED cryptic species, it was shown that the lack of transmission was associated with a very low virus penetration into the primary salivary glands (PSGs) as compared to that of whiteflies of the vector cryptic species, MEAM1 [79]. Consistent with this last result, TYLCCNV was not detected in the saliva of MED whiteflies. Ecology and evolution of capulaviruses
A previous study showed that the Robinia population of A.
craccivora used in this study exhibited the highest
transmis-sion rate of the agroinfectious clone of ALCV (7/13), in comparison to that of two other vector populations collected on common vetch (7/20) and alfalfa (1/20) [10]. The study also showed that the host preference of aphid populations has an impact on the transmission rate. Thus, whereas the transmission rate with the alfalfa population was much lower than that of the Robinia population on broad bean plants, when alfalfa was used as the recipient plant, the transmis-sion rate was similar to that of the Robinia population (5/8). Moreover, using the Alfalfa population, we showed with an ALCV isolate acquired from a naturally infected alfalfa plant collected near Montpellier that the transmission rate was not higher than that obtained with the agroinfectious clone (2/4) (unpublished results). Together, these previous results indicate that the low transmission rate of ALCV by A.
craccivora may not be due to a particular virus or aphid
popu-lation exhibiting an obvious defect to transmission. Hence, we presume that the low transmission rate is intrinsic to the combination ALCV–A. craccivora, although we do not know if it is only driven by ecological adaptation to the environment or if mechanical barriers to more efficient geminivirus circu-lation through aphid bodies are involved as well. Alfalfa, the major host of ALCV, is a hardy perennial plant that exhibits a high tolerance to non- biotic stresses such as drought and extreme temperatures. Hence, the window of opportunity for ALCV to be carried to a new plant is extremely wide and may extend over several years. Moreover, as alfalfa is hardier than other plants, it may be an aphid shelter in dry and hot periods. Thus, the low transmission rate of ALCV determined in controlled conditions is not incompatible with its survival and not even with the 13.4 % average prevalence of ALCV
determined in the south of France from a random collection of alfalfa plants (32/238) [80]. Indeed, as alfalfa can live for more than 10 years, disease prevalence can increase every year from the pool of plants infected in the previous years. If the low transmission efficiency of ALCV is due to intrinsic mechanical barriers of aphids to geminivirus circulation through aphid bodies, other capulaviruses would also be expected to exhibit low transmission rates. Preliminary results support this hypothesis. The incidence of french bean severe leaf curl virus (FbSLCV) in french bean is generally below 2 % (Mohammad Akram, pers. comm.), and plantago latent virus (PlLV) was the less prevalent virus in buckhorn plantain (Plantago lanceolata L.) among the viruses identified in a large survey using viral metagenomics [11]. Moreover, EcmLV was transmissible with 50 aphids per recipient plant (2/2) [10], whereas preliminary results show that transmis-sion was not possible with only 10 insects (0/2). Considering a co- divergence scenario in which geminiviruses co- diverged with plant–aphid complexes, only geminiviruses hosted in complexes that did not require high transmission efficiency may have survived. Of note, the hardy perennial feature of the ALCV host plant also applies to other capulavirus hosts such as Euphorbia caput- medusae L., the host of EcmLV, and prob-ably also to buckhorn plantain, the host of PlLV [10]. FbSLCV would seem to be an exception as it is the only capulavirus isolated from an annual host. However, as the incidence of FbSLCV in French bean is generally below 2 % (Mohammad Akram, pers. comm.), we assume that it is maintained in a perennial host yet to be determined, and that french bean is an occasional host. Consistent with a coevolution scenario, ALCV was not shown to affect the fitness of the aphid vector.
CONCLUSION AND PROSPECTS
This study, together with previous results [10, 40], shows that barriers to gut exit or post- gut barriers were responsible not only for the non- transmission of ALCV by a non- vector population of A. craccivora but also for the low transmis-sion of the vector population tested here. Interestingly, such barriers were detected in other virus–insect combinations in association with transmission defects. We hypothesize that the relatively low transmission efficiency detected for ALCV is a typical feature of geminivirus transmission by aphids due to a factor inherent to aphids. To further validate this hypothesis, transmission parameters should be analysed with other ALCV isolates and A. craccivora populations and with other capulaviruses.
Funding information
The study was carried out during the PhD project of Faustine Ryck-ebusch, funded by the Agropolis Fondation (E- Space flagship programme) grant number 1504-004. The authors received no financial support for the authorship and/or publication of this article.
Acknowledgements
We are grateful to Marie- Stéphanie Vernerey and Elodie Piroles for their assistance in the development of FISH and the use of the confocal microscope. We thank Michel Yvon, Sophie Le Blaye, Jean- Luc Macia, Sylvaine Boissinot, Véronique Brault and Romain