HAL Id: hal-03033541
https://hal.archives-ouvertes.fr/hal-03033541
Submitted on 1 Dec 2020HAL is a multi-disciplinary open access archive for the deposit and dissemination of sci-entific research documents, whether they are pub-lished or not. The documents may come from teaching and research institutions in France or abroad, or from public or private research centers.
L’archive ouverte pluridisciplinaire HAL, est destinée au dépôt et à la diffusion de documents scientifiques de niveau recherche, publiés ou non, émanant des établissements d’enseignement et de recherche français ou étrangers, des laboratoires publics ou privés.
Strategic conservation and management of coral reefs in
the Anthropocene
Emily Darling, Tim Mcclanahan, Joseph Maina, Georgina Gurney, Nicholas
Graham, Fraser Januchowski-Hartley, Joshua Cinner, Camilo Mora, Christina
Hicks, Eva Maire, et al.
To cite this version:
Emily Darling, Tim Mcclanahan, Joseph Maina, Georgina Gurney, Nicholas Graham, et al.. Strategic conservation and management of coral reefs in the Anthropocene. Nature Ecology & Evolution, Nature, 2019, 3 (9), pp.1341-1350. �10.1038/s41559-019-0953-8�. �hal-03033541�
Strategic conservation and management of coral reefs in the Anthropocene
Emily S. Darling1,2,3*, Tim R. McClanahan2, Joseph Maina4, Georgina G. Gurney5, 5
Nicholas A. J. Graham6, Fraser Januchowski-Hartley7,8, Joshua E. Cinner5, Camilo Mora9, Christina C. Hicks6, Eva Maire7, Marji Puotinen10, William J. Skirving11,12, Mehdi Adjeroud13,
Gabby Ahmadia14, Rohan Arthur15,16, Andrew G. Bauman17, Maria Beger18,19,
Michael Berumen20, Lionel Bigot21, Jessica Bouwmeester25, Ambroise Brenier22, Tom Bridge5,23, Eric Brown24, Stuart J. Campbell26,27, Sara Cannon28, Bruce Cauvin29, Chaolun Allen Chen30, 10
Joachim Claudet31, Vianney Denis32, Simon Donner28, E. Estradivari33, Nur Fadli34, David A. Feary35, Douglas Fenner36, Helen Fox14,37, Erik C. Franklin38, Alan Friedlander39,40,
James Gilmour10, Claire Goiran41, James Guest42, Jean-Paul A. Hobbs43, Andrew S. Hoey5, Peter Houk44, Steven Johnson45, Stacy Jupiter2,46, Mohsen Kayal47,48, Chao-yang Kuo5,30, Joleah Lamb49, Michelle A.C. Lee50, Jeffrey Low51, Nyawira Muthiga2, Efin Muttaqin26, 15
Yashika Nand52, Kirsty L. Nash53,54, Osamu Nedlic55, John M. Pandolfi56,57, Shinta Pardede26, Lucie Penin21, Lauriane Ribas-Deulofeu30,58, Zoe Richards43,59, T. Edward Roberts5, Ku'ulei S. Rodgers38, Che Din Mohd Safuan60, Enric Sala39, George Shedrawi61, Tsai Min Sin50,
Patrick Smallhorn-West5, Jennifer E. Smith62, Brigitte Sommer57,63, Peter D. Steinberg64,65, Makamas Sutthacheep66, Chun Hong James Tan60,67, Gareth J. Williams62,68, Shaun Wilson61,69, 20
Thamasak Yeemin70, John F. Bruno3, Marie-Josée Fortin1, Martin Krkosek1, and David Mouillot5,7
*Corresponding Author: Emily Darling, Wildlife Conservation Society, 2300 Southern Blvd,
Bronx, NY, USA 10460. +1 647 779-7637, edarling@wcs.org 25
Affiliations:
1Department of Ecology and Evolutionary Biology, University of Toronto, Toronto, Ontario M5S 3B2, Canada
2Wildlife Conservation Society, Global Marine Program, Bronx, New York 10460, USA 30
3Biology Department, University of North Carolina at Chapel Hill, Chapel Hill, North Carolina 27599, USA
4Department of Environmental Sciences, Macquarie University, North Ryde, New South Wales 2109, Australia
5Australian Research Council Centre of Excellence for Coral Reef Studies, James Cook 35
University, Townsville, Queensland 4811, Australia
7MARBEC, Univ. Montpellier, CNRS, Ifremer, IRD, Montpellier, France
8Department of Biosciences, Swansea University, Swansea, SA2 8PP, United Kingdom 9Department of Geography, University of Hawaii at Manoa, Honolulu, Hawaii 96822, USA 40
10Australian Institute of Marine Science, Indian Ocean Marine Research Centre, University of Western Australia, Crawley, Western Australia 6009, Australia
11Coral Reef Watch, US National Oceanographic and Atmospheric Administration, College Park, Maryland 20740, USA
12Global Science & Technology Inc., Greenbelt, Maryland 20770, USA 45
13Institut de Recherche pour le Développement, UMR 9220 ENTROPIE & Laboratoire d'Excellence CORAIL, Perpignan 66860, France
14Oceans Conservation, World Wildlife Fund, Washington DC 20037, USA 15Nature Conservation Foundation, Gokulam Park, Mysore 570002, India
16Centre d'Estudis Avançats de Blanes, Consejo Superior de Investigaciones Científicas, Blanes, 50
Girona 17300, Spain
17Experimental Marine Ecology Laboratory, Department of Biological Sciences, National University of Singapore, 117543, Singapore
18School of Biology, Faculty of Biological Sciences, University of Leeds, Leeds LS2 9JT, UK 19ARC Centre of Excellence for Environmental Decisions, The University of Queensland, 55
Brisbane, Queensland 4072, Australia
20Red Sea Research Center, King Abdullah University of Science and Technology, Thuwal 23955, Saudi Arabia
21Université de La Réunion, UMR 9220 ENTROPIE & Laboratoire d'Excellence CORAIL, St Denis, La Réunion 97715, France
60
22WCS Papua New Guinea, Goroka, Eastern Highlands 441, Papua New Guinea 23Queensland Museum, South Brisbane, Queensland 4101, Australia
24Kalaupapa National Historical Park, US National Park Service, Kalaupapa, HI 96742, USA 25Department of Biological and Ecological Sciences, College of Arts and Sciences, Qatar University, Doha, Qatar
65
26Wildlife Conservation Society, Indonesia Program, Bogor, West Java 16151, Indonesia 27Rare Indonesia, Bogor, West Java 16151, Indonesia
28Department of Geography, University of British Columbia, Vancouver, British Columbia V6T 1Z2, Canada
29GIP Réserve Naturelle Marine de la Réunion, La Saline, La Réunion 97434, France 70
31National Center for Scientific Research, PSL Research University, CRIOBE, USR 3278 CNRS-EPHE-UPVD, Paris 75005, France
32Institute of Oceanography, National Taiwan University, Taipei 106, Taiwan
33Coral Triangle Program Directorate, World Wildlife Fund Indonesia, Jakarta 12540, Indonesia 75
34Faculty of Marine and Fisheries, Syiah Kuala University, Banda Aceh, Aceh 23373, Indonesia 35MRAG Ltd, 18 Queen Street, London, W1J 5PN, United Kingdom
36Independent, douglasfennertassi@gmail.com
37National Geographic Society, Washington, D.C. 20036, USA
38Hawaii Institute of Marine Biology, School of Ocean and Earth Science and Technology, 80
University of Hawaii, Kaneohe, HI 96744, USA
39National Geographic Society, Pristine Seas Program, Washington, DC 20036, USA 40Fisheries Ecology Research Lab, Department of Biology, University of Hawaii, Honolulu, Hawaii 96822, USA
41ISEA, Université de la Nouvelle-Calédonie, Laboratoire d’Excellence CORAIL, BP R4, 85
Nouméa, New Caledonia 98851, France
42School of Natural and Environmental Sciences, Newcastle University, Newcastle upon Tyne NE1 7RU, UK
43Curtin University, Bentley, Perth, Western Australia, 6102, Australia 44Marine Laboratory, University of Guam, Mangilao, Guam 96923, USA 90
45College of Earth, Ocean and Atmospheric Sciences, Oregon State University, Corvallis, Oregon 97331, USA
46Wildlife Conservation Society, Melanesia Program, Suva, Fiji
47Centre de Formation et de Recherche sur les Environnements Méditerranéens, UMR 5110, Perpignan, 66860, France
95
48Institut de Recherche pour le Développement, UMR 9220 ENTROPIE & Laboratoire d’Excellence CORAIL, Nouméa, New Caledonia 98848, France
49Department of Ecology and Evolutionary Biology, University of California Irvine, California 92697, USA
50Tropical Marine Science Institute, National University of Singapore, 119223, Singapore 100
51National Biodiversity Centre, National Parks Board, 1 Cluny Road, Singapore 259569 52Wildlife Conservation Society, Fiji Program, Suva, Fiji
53Centre for Marine Socioecology, Hobart, TAS, 7000, Australia
54Institute for Marine and Antarctic Studies, University of Tasmania, Hobart, TAS 7000, Australia
55Kosrae Conservation and Safety Organization, Marine Program
56ARC Centre of Excellence for Coral Reef Studies, The University of Queensland, St Lucia, Queensland 4072, Australia
57School of Biological Sciences, The University of Queensland, St Lucia, Queensland 4072, Australia
110
58Biodiversity Program, Taiwan International Graduate Program, Academia Sinica, National Taiwan Normal University, Taipei, Taiwan
59Western Australian Museum, Welshpool, Western Australia 6106, Australia
60Institute of Oceanography and Environment, Universiti Malaysia Terengganu, Terengganu, Malaysia
115
61Western Australian Department of Biodiversity, Conservation and Attractions, Kensington, Western Australia 6151, Australia
62Scripps Institution of Oceanography, University of California San Diego, La Jolla, California 92037, USA
63School of Life and Environmental Sciences, The University of Sydney, New South Wales 120
2006, Australia
64School of Biological Sciences, Naynang Technological University, 637551, Singapore 65Sydney Institute of Marine Science, Mosman, New South Wales 2088, Australia
66Department of Biology, Ramkhamhaeng University, Krung Thep Maha Nakhon 10240, Thailand
125
67School of Marine and Environment Sciences, Universiti Malaysia Terengganu, Terengganu, Malaysia
68School of Ocean Sciences, Bangor University, Bangor, Anglesey LL59 5AB, UK
69Oceans Institute, University of Western Australia, Crawley, 6009, Western Australia, Australia 70Marine Biodiversity Research Group, Ramkhamhaeng University, Krung Thep Maha Nakhon 130
Abstract: Without drastic efforts to reduce carbon emissions and mitigate globalized stressors,
tropical coral reefs are in jeopardy (1, 2). Strategic conservation and management will require identifying the environmental conditions and socioeconomic characteristics associated with 135
scleractinian coral assemblages – the foundation species of coral reef ecosystems. Here, we compiled coral abundance from 2,584 Indo-Pacific sites to evaluate the influence of 21 climate, social, and environmental drivers on reef coral assemblages. Higher abundances of framework-building corals were typically associated with: weaker past thermal disturbances and longer recovery intervals from past bleaching events; slower human population growth; reduced access 140
to human settlements and markets; and less agricultural use. Given the variability in climate exposure faced by coral reefs (3), we used this information to propose a framework of three management strategies (protect – recover – transform) by considering if reefs were, (i) above or below a proposed threshold of >10% cover of coral taxa important for structural complexity and carbonate accretion, and (ii) their exposure to severe thermal stress during the 2014-2017 global 145
coral bleaching events. Based on our dataset, we identify a subset of reefs (n = 449, or 17.4%) that meet the criteria for protecting potential ecological refuges, amidst other locations that may ultimately be priorities for recovery actions (n = 1405, or 54.4%) or transformation away from reef-dependent livelihoods (n = 728, 28.2%). Our findings can guide urgent management efforts for coral reefs, by identifying key threats across multiple scales and strategic policy priorities 150
that might sustain a network of functioning reefs in the Indo-Pacific to avoid ecosystem collapse.
Main text: With the increasing intensity of human impacts from globalization and climate
change, tropical coral reefs have entered a new era of the Anthropocene (1, 4) and face unprecedented losses of up to 90% by mid-century (5). Against a backdrop of globalized 155
anthropogenic stressors, the impacts of climate change can transform coral communities (6) and reduce coral growth rates that are crucial to maintain structure and track rising sea levels (2). Under expectations of continued reef degradation and reassembly in the Anthropocene (4), time is growing short. Given such concerns about the long-term functional erosion of coral
communities, one conservation strategy is to prioritize protecting reefs that currently maintain 160
key ecological functions, i.e., reefs with abundant fast-growing and structurally-complex corals that can maintain net carbonate accretion and vertical reef growth (1, 2). However, efforts to
identify these potentially functioning reefs across large spatial scales are often hindered by a focus on total coral cover, an aggregate metric that can overlook taxa-specific differences in structural complexity and carbonate accretion (7, 8). To date, global empirical studies of 165
scleractinian coral communities – and their environmental and socioeconomic drivers – are rare, in part due to the absence of large-scale assemblage datasets – a key challenge that must be overcome in modern ecology. Here, we apply a method developed from trait-based approaches to evaluate regional patterns and drivers of Indo-Pacific coral assemblages.
We assembled the largest dataset of tropical scleractinian corals from 2,584 Indo-Pacific 170
reefs within 44 nations and territories and spanning 61° of latitude and 219° of longitude (see Methods). Surveys were conducted between 2010 and 2016, during continuous and repeated mass bleaching events, notably following the 1998 El Niño. A ‘reef’ was defined as a unique sampling location where coral genera and species-level community composition were evaluated on underwater transects using standard monitoring methods. Compared to coral reef locations 175
selected at random, our dataset is representative of most conditions: 78 out of 83 Indo-Pacific marine ecoregions with coral reef habitat are represented with <5% disparity, although there are exceptions of undersampled (Palawan/North Borneo and Torres Strait Northern Great Barrier Reef) and oversampled (Hawaii, Rapa-Pitcairn and Fiji Islands) ecoregions (Table S1).
On each reef, we evaluated total coral cover and the abundance of different coral life 180
history types previously developed from a trait-based approach with species characteristics of colony morphology, growth, calcification, and reproduction (9) (www.coraltraits.org, Table S2). The abundance of different coral taxa can affect key ecological processes for future reef
persistence, including the provision of reef structural complexity, carbonate accretion (the process by which corals and some other organisms lay down carbonate on the reef), and 185
ultimately reef growth (the vertical growth of the reef system resulting from the processes of carbonate accretion and erosion) (2, 7, 8, 10). Fast-growing, branching, plating and densely calcifying massive coral taxa that can maintain these processes are expected to be functionally important, not only by maintaining critical geo-ecological functions that coral reefs provide, but might also help reefs recover from climate disturbances, track sea level rise (2), and continue to 190
Here, we build on a previous classification of four coral life history types to evaluate Indo-Pacific patterns of total coral abundance and trait-based groups of corals, and their key socio-environmental drivers. Specifically, we consider four coral life histories (9) (Table S2): the ‘competitive’ life history describes fast-growing branching and plating corals that can accrete 195
structurally-complex carbonate reef architectures but are disproportionately vulnerable to multiple stressors; the ‘stress-tolerant’ life history describes large, slow-growing and long-lived massive and encrusting corals that can build complex high-carbonate reef structures to maintain coral-dominated, healthy and productive reefs, and often persist on chronically disturbed reefs; by contrast, ‘generalist’ plating or laminar corals may represent a subdominant group of deeper 200
water taxa, while smaller brooding ‘weedy’ corals typically have more fragile, lower-profile colonies that provide less structural complexity and contribute marginally to carbonate production and vertical growth (10, 12, 13). We therefore consider competitive and stress-tolerant life histories as key framework-building species given their ability to build large and structurally complex coral colonies. We hypothesize that the abundance of different life histories 205
within a coral assemblage provides a signal of past disturbance histories or environmental conditions (14–17) that may affect resilience and persistence to future climate impacts (18).
Across the 2,584 reefs, total hard coral cover varied from <1% to 100% (median +/- SD, 23.7 +/- 17.0%). Competitive and stress-tolerant corals were the dominant life history on 85.7% of reefs (competitive: 42.4%, n = 1,095 reefs; stress-tolerant: 43.3%, n = 1,118 reefs); generalist 210
and weedy taxa dominated only 8.8% and 5.6% of reefs respectively (Fig. 1a, b; Fig. S1). It is striking that the majority of reefs were able to achieve dominance by structurally-important corals even following the 1998 mass bleaching event, despite different histories of ongoing bleaching impacts and recovery (19, 20). Notably, these findings are in contrast to contemporary Caribbean reefs where very few reefs are dominated by key reef-building species and instead 215
comprised of weedy taxa with limited functional significance (8, 21). However, Indo-Pacific reefs varied in their absolute abundance of the four types (Fig. 1c), also suggesting the potential for dramatic structural and functional shifts away from expected historical baselines of highly abundant competitive branching and plating corals (22), a warning sign given recent community shifts in the Caribbean (23).
Drawing on theoretical and empirical studies of socio-economic and environmental drivers on coral reefs (24–26), we tested the influence of 21 social, climate, and environmental covariates on coral abundance, while controlling for sampling methodologies and biogeography (Table S3). These include: (i) social drivers (human population growth, management,
agricultural use, national development statistics, the ‘gravity’ of nearby markets, and human 225
populations that measure the size and accessibility of the nearest major market and human settlement, respectively), (ii) climate drivers (the intensity and time since past extreme thermal stress, informed by Degree Heating Weeks, DHWs), (iii) environmental characteristics (depth, habitat type, primary productivity, cyclone wave exposure, and reef connectivity), and (iv) sampling effects and biogeography (survey method, sampling intensity, latitude, and coral faunal 230
province). We fit hierarchical mixed-effects regression models using the 21 covariates to predict the percent cover of total coral cover and the four coral life history types individually. Models were fit in a Bayesian multilevel modelling framework and explain ~25-48% of the observed variation across total cover and the four life histories (Table S4). We also fit these models to four common coral genera (Acropora, Porites, Montipora, Pocillopora) as a complementary
235
taxonomic analysis (Fig. S2).
Climate variables describing the frequency and intensity of past thermal stress events strongly affected coral assemblages (Fig. 2). Total hard coral cover and the abundance of all four life histories increased with time since the strongest past thermal disturbance, providing
empirical support for the importance of recovery windows for corals (1). These results also 240
highlight the consequences of shrinking recovery windows for coral community structure, and its potential associations with ecosystem function as the abundance of live coral declines (1, 6). Reefs with more extreme past climate disturbances (assessed by maximum DHWs) had fewer competitive and generalist corals (Fig. 2), consistent with expectations that branching and plating corals are extremely vulnerable to temperature anomalies and bleaching (6, 15, 18). Stress-245
tolerant and weedy corals were less affected by the magnitude of past thermal stress, as
suggested by long-term studies in Kenya (15) and Indonesia (7) that have shown these corals can persist through acute disturbances. There was no effect of the magnitude of past thermal stress on patterns of total coral cover, likely because this composite metric overlooks differences in
species and trait responses. 250
Our results also reveal the important role of socioeconomic drivers on some life histories: reefs adjacent to human populations and agricultural use were associated with a lower abundance of stress-tolerant and generalist corals (Fig. 2). The mechanisms underpinning these relationships could include the overexploitation of grazing herbivorous fishes that control macroalgae,
declining water quality from agriculture and urban centers that can increase turbidity and 255
nutrients to smother corals and fuel algal overgrowth or disease, or increases in coral disease or mortality from destructive fishing practices, tourism or industrial activities (27, 28). We also observed two positive associations of coral abundance with human use: generalist corals with nearby agricultural land use, and weedy corals with market gravity. In some cases, these relationships may be complex and require further investigation; for example, the abundance of 260
generalists (e.g., deeper-water plating corals) was negatively associated with the expansion of nearby croplands between 2002-2012, but positively associated with a more croplands by 2012 (Fig. 2). Overall, we identify human gravity and agricultural use as key social drivers that can reduce the abundance of structurally-complex corals and increase the abundance of ‘weedier’ corals; drivers that could therefore be locally mitigated to promote structurally complex and 265
calcifying reefs that can sustain important ecological functions.
Local management actions in the form of no-take reserves or restricted management (e.g., gear restrictions) were associated with higher total coral cover, and greater abundance of stress-tolerant and weedy corals, but not competitive or generalist corals (Fig. 2). The finding that management did not increase the abundance of all coral life histories may be surprising, because 270
protection from local stressors is often expected to support coral resilience by increasing
herbivory and suppressing macroalgae, reducing coral disease, and providing chemical cues that facilitate coral recruitment (29, 30). However, our analyses did not account for reserve age, size, design, or compliance, which could influence these outcomes; for example, older marine
protected areas (MPAs) have been shown to reduce the loss of total coral cover (31). 275
Nevertheless, these results are also consistent with our findings that competitive and generalist corals are vulnerable to thermal stress, and with the argument that MPA effects can be swamped by the effect of climate change and bleaching mortality (32), especially for taxa that can be extremely sensitive to bleaching losses (12, 15). Our results also suggest that partial protection is associated with increases in coral abundance similar to fully no-take areas. For corals, any type 280
anchoring) can have benefits for coral survival and growth (28, 33), compared to global studies of reef fish that highlight the importance of compliant, no-take fisheries management (26, 34).
Environmental factors such as latitude, reef zonation (depth and habitat), primary productivity, wave exposure and cyclone intensity were also strongly associated with coral 285
abundance (Fig. 2). Competitive corals were more abundant on reef crests, shallower reefs and on reefs with higher wave exposure, compared to stress-tolerant corals that were more abundant on deeper reefs and reefs with lower wave exposure. Stress-tolerant, weedy and generalist corals were typically associated with higher latitudes, smaller reef areas, and deeper depths. Primary productivity and cyclone exposure were associated with a decrease in the abundance of 290
competitive, stress-tolerant and weedy corals, likely associated with unfavourable conditions for coral growth in areas of eutrophication and high productivity (35), or hydrodynamic breakage or dislodgement of coral colonies (36). These findings suggest that environmental conditions are important in predicting conservation baselines and guiding management investments, such as restoring or maintaining grazer functions when environmental conditions can support corals and 295
other calcifying organisms (37). After controlling for method and sampling effort in the models (Fig. 2), our results suggest that future comparative studies would benefit from standardized methods and replication to allow for faster comparative approaches for field-based monitoring, especially given the urgency of tracking changes to coral assemblages worldwide (38).
The livelihoods of millions of people in the tropics depend on healthy and productive 300
coral reefs (39), yet coral reefs worldwide are imperilled by climate change (1, 5, 6, 32). Previous studies have identified 10% hard coral cover as a minimum threshold for carbonate accretion on Caribbean (40) and Indo-Pacific (41, 42) reefs, where reefs around this threshold (or ‘boundary point’) are more likely to have a neutral carbonate budget and may succumb to reef submergence with rising sea levels (2). Here, we adapt this threshold as the live cover of 305
competitive and stress-tolerant corals (hereafter, ‘framework’ corals) as these are two life
histories that can build large, structurally-complex colonies to maintain carbonate production and vertical reef growth (10, 41). Prior to the third global bleaching event between 2014 and 2017, 71.8% of reefs (1,856 out of 2,584) maintained a cover of framework corals above 10% (Fig. 3a), suggesting the majority of reefs could sustain potential function. We then assessed the 310
third global bleaching event. Between 2014 and 2017, reefs were exposed to variable maximum thermal stress, ranging between 0 to 30.5 DHWs annually (Fig 3a; Methods); nearly three-quarters of the surveyed reefs (74.9%, n = 1935 reefs) were exposed to >4 DHWs, a common threshold for potential bleaching and mortality (43) (see also Fig. S3). Coral abundance, as 315
related to potential thresholds of function (10%; but see sensitivity analysis in Table S5), was independent of the thermal stress experienced in the 2014-2017 bleaching event. This creates the potential for three strategic types of management: 1) protect functioning reefs exposed to less intense and frequent climate disturbances, 2) recover reefs exposed to potential bleaching-level stress but above a potential functioning threshold before bleaching, and 3) on degraded reefs 320
exposed to potential bleaching-level thermal stress, assist societies to transform away from reef-dependent livelihoods (Fig. 3a).
A protect strategy was identified for 449 reefs (out of 2,584, or 17.4%), which were exposed to minimal bleaching-level stress (<4 DHWs during 2014-2017) and had >10% cover of framework corals (Fig. 3a; Table S5). These reefs were located throughout the Indo-Pacific (Fig. 325
3b, Fig. S4, Table S6) suggesting that it is currently possible to safeguard a regional network of functioning coral reefs (3). The conservation goal for protect reefs is to maintain reefs above functioning thresholds ideally through future potential bleaching events, i.e., through policies that can dampen the market and population impacts of nearby populations, or through
management that can include restrictions on fishing, development, tourism, pollution and run-off 330
(4, 27, 45, 46). The recover strategy comprised the majority of surveyed reefs: 1407 reefs (out of 2584, or 54.4%) exceeded 10% cover of framework corals, but were likely exposed to severe bleaching-level heat stress during 2014-2017 El Niño (i.e., >4 DHWs). As these reefs had recently maintained 10% cover, mitigating local stressors as described above alongside targeted investments in coral reef rehabilitation and restoration could help to accelerate natural coral 335
recovery. For the transform strategy, we identified 728 reefs (or 28.2%) below 10% cover that were likely on a trajectory of net erosion prior to the 2014-2017 bleaching event. Here, societies may ultimately need to transform away from dependence on coral reef livelihoods, which could be assisted with long-term social investments in livelihoods, education, and adaptive capacity; investments which can also accompany the protect and recover strategies (39, 44).
We also investigated how combinations of key drivers could affect the predicted cover of framework corals (Fig. 3c). While certain driver combinations were predicted to reduce cover below a 10% threshold (e.g., low recovery time from climate disturbances with high population or market gravity, or with high cyclone exposure; at levels of high gravity and high primary productivity; Fig. 3c), the majority of parameter space predicted coral cover above 10%. This is 345
hopeful in that even as the frequency of bleaching events is expected to increase, reducing the impact of local stressors may provide conditions that can sustain coral reefs (6). Our results show that while addressing global climate change is paramount, other factors such as recovery time from bleaching events, low to medium levels of net primary productivity (e.g., through improving water quality) or dampening the effects of nearby populations and markets should 350
help to maintain the cover of framework corals above 10% (Fig. 3c) at a minimum, and ideally sustain reefs at higher levels of coral cover.
Our dataset describes contemporary coral assemblages within a period of escalating thermal stress, notably following the 1998 bleaching event. However, patterns of coral bleaching vary spatially (1), and we can make no predictions about which reefs might escape future
355
bleaching events or mortality. The long-term persistence of corals within potential climate
refuges (i.e., the protect strategy) requires a better understanding of future climate conditions and tracking the long-term ecological responses of different reefs (38, 45). Predicting and managing coral reefs through a functional lens is challenging but necessary (10, 46). Here, we adapt previous estimates of 10% coral cover as a threshold of net-positive carbonate production. 360
However, this threshold is based on methods that estimate the three-dimensional structure of a reef (40), while our dataset consists of primarily planar two-dimensional methods that do not account for the vertical or three-dimensional components of complex colonies (47). Thus, the 10% threshold based on planar methods should be considered an uncertain, but potentially precautionary, threshold of net carbonate accretion. A sensitivity analysis considering this 365
threshold at 8% or 12% cover finds similar distributions of reefs across the three strategies (Table S5), suggesting a three-strategy framework is robust to uncertainty around thresholds of functionality. Future work can help refine these thresholds by considering species-specific contributions to complexity and carbonate production, as has been recently developed for Caribbean corals (8).
Facing an Anthropocene future of intensifying climate change and globalized
anthropogenic impacts, coral reef conservation can be more strategic by explicitly incorporating climate impacts and ecological functioning into priority actions (4). Given expectations that coral assemblages will shift towards smaller and simpler morphologies and slower growth rates to jeopardize reef function (6, 7, 15), our findings highlight the importance of urgently protecting 375
and managing reefs that support diverse assemblages of large, complex branching, plating and massive taxa (10). Our findings reveal key drivers of coral assemblages, and identify some locations where societies can immediately enact strategic actions of protect, recover, or
transform. Our framework also provides a way to classify reefs for management based on two
simple thresholds of their potential ecological function and recent exposure to thermal stress; 380
thresholds that have the potential to be incorporated into measurable indicators of global action under the Convention on Biological Diversity’s post-2020 Strategic Plan that will include a revised target for coral reefs. Local management alone, no matter how strategic, does not alleviate the urgent need for global efforts to control carbon emissions; the widespread persistence of functioning coral assemblages requires urgent and effective action to limit 385
warming to 1.5-2˚C (1, 5, 6). Our findings suggest there is still time for the strategic conservation and management of the world’s last functioning coral reefs, providing some hope for global coral reef ecosystems and the millions of people who depend on them.
Methods
390
We conducted coral community surveys along 8,209 unique transects from 2,584 reefs throughout the Indian and Pacific Oceans, covering ~277 km of surveyed coral reef. Our dataset provides a contemporary Indo-Pacific snapshot of coral communities between 2010 and 2016; surveys occurred during repeated mass bleaching events (e.g., 1998, 2005, 2010), but were not influenced by widespread mortality during the 2014-2017 global coral bleaching event. Surveys 395
spanned 61 degrees of latitude (32.7°S to 28.5°N) and 219.4 degrees of longitude (35.3°E to 105.4°W) and represented each of the 12 coral faunal provinces described for Indo-Pacific corals (48). A random subsampling method was used to evaluate the representation of our dataset across Indo-Pacific coral reefs, whereby we compared locations of empirical surveys to the global distribution of coral reefs by generating 2600 randomly selected Indo-Pacific coral reef 400
sites using the ‘dismo’ package (49) from a 500 m resolution tropical coral reef grid (50).
Comparing our empirical surveys (n = 2,584 reefs) to the randomly generated reefs allowed us to estimate ecoregions with relative undersampling or oversampling (Table S1).
Climate, social and environmental covariates were organized at three spatial scales, following the methods of (26):
405
(i) Reef (n = 2,584). Coral community surveys were conducted at the scale of “reefs”, defined as a sampling location (with a unique latitude, longitude and depth) and comprised of replicate transects. Surveys occurred across a range of depths (1-40 m; mean ± standard deviation, 8.9 ± 5.6 m), though the majority of surveys (98.8%) occurred at depths
shallower than 20 m. Surveys were conducted across a range of reef habitat zones, classified 410
to three major categories: reef flat (including back reefs and lagoons), reef crest, and reef slope (including offshore banks and reef channels).
(ii) Site (n = 967). Reefs within 4 km of each other were clustered into “sites”. The
choice of 4 was informed by the spatial movement patterns of artisanal coral reef fishing activities as used in a global analysis of global reef fish biomass (26). We generated a 415
complete-linkage hierarchical cluster dendrogram based on great-circle distances between each point of latitude and longitude. This provided a median of 2.0 reefs (+/- 2.83) per site. We then used the centroid of each cluster to estimate site-level social, climate and
environmental covariates (Table S3).
(iii) Country (n = 36). Reefs and sites were identified within geopolitical countries to
420
evaluate national-level covariates (GDP per capita, voice and accountability in governance, and Human Development Index). Overseas territories within the jurisdiction of the United States, United Kingdom and France were informed by their respective country.
Coral communities and life histories. At each reef, underwater surveys were conducted using
425
one of three standard transect methods: point-intercept transects (n = 1,628 reefs), line-intercept transects (n = 399 reefs) and photo quadrats (n = 557 reefs). We estimated sampling effort as the total number of sampled points during each reef survey. Line-intercept transects were estimated as having sampling points every 5 cm, since most studies only estimate the length of corals
greater than 3 or 5 cm (T. McClanahan, A. Baird pers. comm). On average, the number of 430
sampling points was 300.0 ± 750.0 (median ± SD), although effort ranged from 30 to 5,138 sampling points. Method and sampling effort were included as fixed effects in the models to control for their effects.
The absolute percent cover of hard corals was evaluated to the taxonomic level of genus or species for each transect. Surveys that identified corals only to broader morphological or life 435
form groups (e.g., branching, massive corals) did not meet the criteria for this study. The majority of surveys recorded coral taxa to genus (1506 reefs out of 2584, or 58.2%), and the remainder recorded some or all taxa to species level; a small proportion of corals that remained unidentified from species or genus surveys (0.30% of all surveyed coral cover) were excluded from further analyses. We estimated the total hard coral cover on each transect, and classified 440
each coral taxa to a life history type following the classification presented in (9); some species of
Pocillopora, Cyphastrea and Leptastrea were reclassified by expert coral taxonomists and
ecologists following the methods of (14). A representative list of species and their life history types are provided in Table S2, and original trait information is available from the Coral Traits Database (https://coraltraits.org/) (51). For genera-level monitoring that included species across 445
more than one life history classification (Hydnophora, Montipora, Pocillopora, Porites), we distributed coral cover of each genus proportional to the number of species within each life history, which was estimated separately for each faunal province based on available species lists. In total, we were able to classify 97.2% of surveyed coral cover to a life history, and then
summed coral cover for each of the four life histories on each reef. 450
Climate, social and environmental drivers. To evaluate the relative influence of climate, social
and environmental drivers on total hard coral cover and coral assemblages, we identified a suite of covariates at reef, site and country scales (Table S3). These covariates included: the frequency and intensity of thermal stress since 1982 as indicators of ocean warming and bleaching, local human population growth, market and settlement gravity (a function of human population size 455
and accessibility to reefs), management, nearby agricultural use, national Human Development Index, primary productivity, depth, reef habitat, wave exposure, cyclone history, and habitat connectivity. A full description of covariates, data sources and rationale can be found in the Supplementary Information.
Analysis of drivers. We first assessed multicollinearity among the different covariates by
460
evaluating variance inflation factors (Table S7) and Pearson correlation coefficients between each pairwise combination of covariates (Fig. S5). This led to the exclusion of four covariates: (i) local population size, (ii) national GDP per capita, (iii) national voice and accountability, and (iv) years since maximum annual extreme cyclone days. A final set of 16 covariates was
included in statistical models, whereby all pairwise correlations were less than 0.7 and all 465
variance inflation factors were less than 2.5 indicating that multicollinearity was not a serious concern (Table S7, Fig. S5).
To quantify the multi-scale social, human and environmental factors on hard coral assemblages, we modelled total percent cover of hard corals and the percent cover of each life history as separate responses. We fit mixed-effects Bayesian models of coral cover that represent 470
spatial organization as hierarchical random effects, where reef was nested within site, and site nested within country; we also included a random effect of coral faunal province to account for regional biogeographic patterns (48). For each response variable, we converted percent coral cover into a proportion response and fit linear models using a Beta regression, which is useful for continuous response data between 0 and 1 (52). We incorporated weakly informative priors: 475
Normal (mean 0, standard deviation 10) on the global intercept, Normal (mean 0, standard deviation 2) on slope parameters, and Student t (degrees of freedom 3, mean of 0, scale of 25) on the beta dispersion parameter. We fit our models with 5,000 iterations across four chains, and discarded the first 1,000 iterations of each chain as a warm-up; in total, the posterior sample was 16,000 for each model. We ensured chain convergence by visual inspection (Fig. S6), and 480
ensuring that Rhat (the potential scale reduction factor) was less than 1.05 and the minimum effective sample size (neff) was > 1000 for all parameters (53). We also conducted posterior predictive checks and estimated Bayesian R2 values for each model as an indication of the
proportion of variance explained (54). We fit models with Stan (55), brms (56) and R 3.5.2 (57). We applied the same modelling approach to the percent cover of four dominant coral 485
genera: Acropora, Porites, Montipora, and Pocillopora, in order to provide a comparison between life history and taxonomic responses (Fig. S2).
Strategic portfolios. We developed three conservation strategies (protect, recover and
reef’s previous observed ecological condition. To evaluate the potential thermal stress 490
experienced by the 2,584 reefs during the Third Global Bleaching Event, we estimated the maximum annual Degree Heating Weeks (DHWs) between 2014 and 2017 from two global satellite products: NOAA’s CoralTemp dataset (Coral Reef Watch version 3; see Drivers section) and NOAA’s Coral Reef Watch version 2 (https://coralreefwatch.noaa.gov). There was generally strong agreement in maximum annual DHWs experienced by each reef between the two datasets 495
(Pearson correlation, r = 0.68). Here, we use DHWs derived from the CoralTemp version 3 product, which provides more accurate SSTs although the climatologies to interpret bleaching-level stress DHW thresholds remain in development (W. Skirving, pers. comm). Potential bleaching-level thermal stress can occur at different thresholds, likely between 2 and 4 DHWs, and this range of thresholds also represents the lowest quintile of DHW exposure for the 2,584 500
reefs during the 2014-2017 El Niño (0-20th quintile: 0 - 3.2 DHW). Considerations of different thresholds were highly correlated and identified similar ‘no-regrets’ locations of limited thermal stress exposure between 2014 and 2017 (Fig. S3).
For ecological condition, we assessed whether each reef had the potential for a net positive carbonate budget prior to the 2014-2017 bleaching event based on 10% cover of competitive and 505
stress tolerant corals. We assumed that this threshold represents a potential tipping point (i.e. unstable equilibrium, or boundary point) for reef growth and carbonate accretion, whereby 10% hard coral cover is a key threshold above which reefs are more likely to maintain a positive carbonate budget and therefore net reef growth(40–42). Additionally, 10% coral cover is suggested to be a threshold for reef fish communities and standing stocks of biomass(58–60), 510
and also associated with some thresholds to undesirable algal-dominated states at low levels of herbivore grazing and coral recruitment(61). As a sensitivity analysis for the 10% coral cover threshold, we also considered how 8% and 12% coral cover thresholds would affect the
distribution of conservation strategies across the 2,584 reefs (Table S5). This sensitivity analysis helps account for the uncertainty in how two-dimensional planar estimates of percent cover 515
recorded during monitoring may affect three-dimensional processes on coral reefs, like carbonate production (47). Ultimately, applying thresholds of recent potential bleaching-level stress and reef condition (percent cover of competitive and stress tolerant corals) led to the proposed framework of three management strategies: protect, recover and transform, which we mapped across the Indo-Pacific based on the surveys in our dataset (Fig. 3, Fig. S4).
We also investigated how combinations of key drivers differentiated between reefs below or above 10% cover of competitive and stress-tolerant corals (Fig. 3C). Using the Bayesian
hierarchical models for competitive and stress-tolerant corals, we predicted coral cover across a range of observed values for five key covariates: population and market gravity, years since maximum DHW, primary productivity and cyclone exposure. For each covariate combination, 525
we kept all other parameters at their median values for continuous predictors, or their reference value for categorical predictors (management: fished; habitat: reef slope; method: PIT); we then added the median predicted cover of competitive and stress-tolerant corals from 10,000 posterior samples for an estimate of combined cover.
Data availability Data available on request from the authors.
530
Acknowledgements All data contributors would like to thank their monitoring partners and
funders; see additional supplementary acknowledgements. We thank A. Baird, E. Buthung, P. Chabanet, Y. Chancerelle, D. Harvell, A. Heyward, P. Jokiel, R. Komeno, R. Lawton, S. Maxin, M. Pratchett, B. Randriamanantsoa, C. Rodney, E. Rudi, C. Russo, S. Tasidjawa, B. Vargas-Angel, I. Williams, B. Willis, J. Zavatra for data collection. We thank S. Anderson, K. Fisher and 535
H. Beyer for assistance with analysis and data extraction. Major funding for this work was provided by a David H. Smith Conservation Research Fellowship from the Cedar Tree Foundation, a Banting Postdoctoral Fellowship from the Natural Sciences and Engineering Research Council of Canada, and the John D. and Catherine T. MacArthur Foundation through grants to the Wildlife Conservation Society.
540
Author contributions E.S.D. envisioned and led the project, performed all analyses, secured
funding, and wrote the manuscript. T.M., J.M., G.G., N.A.J.G., F. J.-H., J.E.C., C.M., C.H., M.-J. F., and M.K. contributed to the conceptual ideas, design, analysis, design and writing. All other authors contributed data, edited and approved the manuscript.
Competing interests The authors declare no competing interests.
References
1. Hughes TP, et al. (2018) Spatial and temporal patterns of mass bleaching of corals in the Anthropocene. Science 359:80–83.
550
2. Perry CT, et al. (2018) Loss of coral reef growth capacity to track future increases in sea level. Nature 558:396–400.
3. Beyer HL, et al. (2018) Risk-sensitive planning for conserving coral reefs under rapid climate change. Conservation Letters:e12587.
4. Hughes TP, et al. (2017) Coral reefs in the Anthropocene. Nature 546(7656):82–90. 555
5. Frieler K, et al. (2013) Limiting global warming to 2 °C is unlikely to save most coral reefs.
Nature Climate Change 3(2):165–170.
6. Hughes TP, et al. (2018) Global warming transforms coral reef assemblages. Nature 556(7702):492–496.
7. Denis V, Ribas-Deulofeu L, Sturaro N, Kuo C-Y, Chen CA (2017) A functional approach 560
to the structural complexity of coral assemblages based on colony morphological features.
Scientific Reports 7(1). doi:10.1038/s41598-017-10334-w.
8. González-Barrios FJ, Álvarez-Filip L (2018) A framework for measuring coral species-specific contribution to reef functioning in the Caribbean. Ecological Indicators 95:877– 886.
565
9. Darling ES, Alvarez-Filip L, Oliver TA, McClanahan TR, Côté IM (2012) Evaluating life-history strategies of reef corals from species traits. Ecology Letters 15(12):1378–1386. 10. Perry CT, Alvarez-Filip L (2019) Changing geo-ecological functions of coral reefs in the
Anthropocene. Functional Ecology In press. doi:10.1111/1365-2435.13247.
11. Robinson JPW, et al. (2018) Productive instability of coral reef fisheries after climate-570
driven regime shifts. Nature Ecology & Evolution. doi:10.1038/s41559-018-0715-z. 12. Alvarez-Filip L, Carricart-Ganivet JP, Horta-Puga G, Iglesias-Prieto R (2013) Shifts in
coral-assemblage composition do not ensure persistence of reef functionality. Scientific
Reports 3(1). doi:10.1038/srep03486.
13. Darling ES, et al. (2017) Relationships between structural complexity, coral traits, and reef 575
fish assemblages. Coral Reefs 36(2):561–575.
14. Zinke J, et al. (2018) Gradients of disturbance and environmental conditions shape coral community structure for south-eastern Indian Ocean reefs. Diversity and Distributions 24(5):605–620.
15. Darling ES, McClanahan TR, Côté IM (2013) Life histories predict coral community 580
disassembly under multiple stressors. Global Change Biology 19(6):1930–1940.
16. Graham NAJ, Chong-Seng KM, Huchery C, Januchowski-Hartley FA, Nash KL (2014) Coral reef community composition in the context of disturbance history on the Great Barrier Reef, Australia. PLoS ONE 9(7):e101204.
17. Sommer B, Harrison PL, Beger M, Pandolfi JM (2014) Trait-mediated environmental 585
filtering drives assembly at biogeographic transition zones. Ecology 95(4):1000–1009. 18. Kayal M, et al. (2018) Predicting coral community recovery using multi-species population
dynamics models. Ecology Letters 21(12):1790–1799.
19. Gilmour JP, Smith LD, Heyward AJ, Baird AH, Pratchett MS (2013) Recovery of an isolated coral reef system following severe disturbance. Science 340(6128):69–71. 590
20. Graham NAJ, Jennings S, MacNeil MA, Mouillot D, Wilson SK (2015) Predicting climate-driven regime shifts versus rebound potential in coral reefs. Nature 518(7537):94–97. 21. Green D, Edmunds P, Carpenter R (2008) Increasing relative abundance of Porites
astreoides on Caribbean reefs mediated by an overall decline in coral cover. Marine
Ecology Progress Series 359:1–10.
595
22. Montaggioni LF (2005) History of Indo-Pacific coral reef systems since the last glaciation: Development patterns and controlling factors. Earth-Science Reviews 71(1–2):1–75. 23. Jackson J, Donovan M, Cramer K, Lam V (2015) Status and trends of Caribbean coral
reefs: 1970-2012 (Global Coral Reef Monitoring Network, IUCN, Gland, Switzerland).
24. Duffy JE, Lefcheck JS, Stuart-Smith RD, Navarrete SA, Edgar GJ (2016) Biodiversity 600
enhances reef fish biomass and resistance to climate change. Proceedings of the National
Academy of Sciences 113(22):6230–6235.
25. Kittinger JN, Finkbeiner EM, Glazier EW, Crowder LB (2012) Human dimensions of coral reef social-ecological systems. Ecology and Society 17(4):17.
26. Cinner JE, et al. (2016) Bright spots among the world’s coral reefs. Nature 535(7612):416– 605
419.
27. Pollock FJ, et al. (2014) Sediment and turbidity associated with offshore dredging increase coral disease prevalence on nearby reefs. PLoS ONE 9(7):e102498.
28. McManus JW, Reyes BR, Nañola CL (1997) Effects of some destructive fishing methods on coral cover and potential rates of recovery. Environmental Management 21:69–78. 610
29. Lamb JB, et al. (2016) Reserves as tools for alleviating impacts of marine disease.
Philosophical Transactions of the Royal Society B: Biological Sciences
30. Dixson DL, Abrego D, Hay ME (2014) Chemically mediated behavior of recruiting corals and fishes: A tipping point that may limit reef recovery. Science 345(6199):892–897. 615
31. Selig ER, Bruno JF (2010) A global analysis of the effectiveness of marine protected areas in preventing coral loss. PLoS ONE 5(2):e9278.
32. Bruno JF, Côté IM, Toth LT (2019) Climate change, coral loss, and the curious case of the parrotfish paradigm: why don’t marine protected areas improve reef resilience? Annual
Review of Marine Science 11:307–334.
620
33. Mangi SC, Roberts CM (2006) Quantifying the environmental impacts of artisanal fishing gear on Kenya’s coral reef ecosystems. Marine Pollution Bulletin 52(12):1646–1660. 34. Edgar GJ, et al. (2014) Global conservation outcomes depend on marine protected areas
with five key features. Nature 506(7487):216–220.
35. Costa OS, Leão ZMAN, Nimmo M, Attrill MJ (2000) Nutrification impacts on coral reefs 625
from northern Bahia, Brazil. Island, Ocean and Deep-Sea Biology, eds Jones MB, Azevedo JMN, Neto AI, Costa AC, Martins AMF (Springer Netherlands, Dordrecht), pp 307–315. 36. Madin JS, Connolly SR (2006) Ecological consequences of major hydrodynamic
disturbances on coral reefs. Nature 444(7118):477–480.
37. Robinson JPW, et al. (2018) Environmental conditions and herbivore biomass determine 630
coral reef benthic community composition: implications for quantitative baselines. Coral
Reefs 37(4):1157–1168.
38. Edmunds P, et al. (2019) Why more comparative approaches are required in time-series analyses of coral reef ecosystems. Marine Ecology Progress Series 608:297–306. 39. Cinner JE, et al. (2018) Building adaptive capacity to climate change in tropical coastal 635
communities. Nature Climate Change 8(2):117–123.
40. Perry CT, et al. (2013) Caribbean-wide decline in carbonate production threatens coral reef growth. Nature Communications 4:1402.
41. Januchowski-Hartley FA, Graham NAJ, Wilson SK, Jennings S, Perry CT (2017) Drivers and predictions of coral reef carbonate budget trajectories. Proceedings of the Royal Society 640
B: Biological Sciences 284(1847):20162533.
42. Perry CT, et al. (2016) Remote coral reefs can sustain high growth potential and may match future sea-level trends. Scientific Reports 5(1). doi:10.1038/srep18289.
43. Heron SF, Maynard JA, van Hooidonk R, Eakin CM (2016) Warming trends and bleaching stress of the world’s coral reefs 1985–2012. Scientific Reports 6:38402.
645
44. Sen A (2013) The ends and means of sustainability. Journal of Human Development and
45. Maina J, McClanahan TR, Venus V, Ateweberhan M, Madin J (2011) Global gradients of coral exposure to environmental stresses and implications for local management. PLoS
ONE 6(8):e23064.
650
46. Guest JR, et al. (2018) A framework for identifying and characterising coral reef “oases” against a backdrop of degradation. Journal of Applied Ecology 55(6):2865–2875.
47. Bellwood DR, Streit RP, Brandl SJ, Tebbett SB (2019) The meaning of the term ‘function’ in ecology: a coral reef perspective. Functional Ecology In press.
doi:10.1111/1365-2435.13265. 655
48. Goatley CHR, Bellwood DR (2011) The roles of dimensionality, canopies and complexity in ecosystem monitoring. PLoS ONE 6(11):e27307.
49. Keith SA, Baird AH, Hughes TP, Madin JS, Connolly SR (2013) Faunal breaks and species composition of Indo-Pacific corals: the role of plate tectonics, environment and habitat distribution. Proceedings of the Royal Society B: Biological Sciences 280(1763):20130818. 660
50. Hijmans, Robert J., Phillips, S., Elith, J. (2017) dismo: Species Distribution Modeling. R package version 1.1-4. Available at: https://CRAN.R-project.org/package=dismo. 51. Burke, L. M., Reytar, K., Spalding, M., Perry, A. (2011) Reefs at Risk Revisited (World
Resources Institute, Washington, DC).
52. Madin JS, et al. (2016) The Coral Trait Database, a curated database of trait information for 665
coral species from the global oceans. Scientific Data 3:160017.
53. Ferrari S, Cribari-Neto F (2004) Beta regression for modelling rates and proportions.
Journal of Applied Statistics 31(7):799–815.
54. Gelman A, et al. (2013) Bayesian Data Analysis (Chapman and Hall/CRC).
55. Gelman A, Goodrich B, Gabry J, Ali I (2017) R-squared for Bayesian regression models. 670
Available at: http://www.stat.columbia.edu/~gelman/research/unpublished/bayes_R2.pdf. 56. Stan Development Team (2018) Stan Modeling Language Users Guide and Reference
Manual, Version 2.18.0 Available at: http://mc-stan.org.
57. Bürkner P-C (2017) brms: An R Package for Bayesian Multilevel Models Using Stan.
Journal of Statistical Software 80(1). doi:10.18637/jss.v080.i01.
675
58. R Core Team (2018) R: A language and environment for statistical computing. (R Foundation for Statistical Computing, Vienna, Austria.) Available at: https://www.R-project.org/.
59. Lamy T, Galzin R, Kulbicki M, Lison de Loma T, Claudet J (2016) Three decades of recurrent declines and recoveries in corals belie ongoing change in fish assemblages. Coral 680
60. Beldade R, Mills SC, Claudet J, Côté IM (2015) More coral, more fish? Contrasting snapshots from a remote Pacific atoll. PeerJ 3:e745.
61. Harborne AR, et al. (2018) Modelling and mapping regional-scale patterns of fishing impact and fish stocks to support coral-reef management in Micronesia. Diversity and 685
Distributions. doi:10.1111/ddi.12814.
62. Mumby PJ (2017) Embracing a world of subtlety and nuance on coral reefs. Coral Reefs 36(3):1003–1011.
Fig. 1. Indo-Pacific patterns of reef coral assemblages. (A) Percent cover of four coral life
histories from 2,584 reef surveys in 44 nations and territories; colour indicates life history and 695
circle size indicates percent cover. Circles are semi-transparent; locations with many surveyed reefs are darker than locations with fewer surveyed reefs. (B) Example of life histories, from left to right: fast-growing competitive; slow-growing and long-lived massive stress-tolerant; sub-dominant generalists; fast-growing brooding weedy taxa. (C) Distribution of abundance (percent cover) for each life history; dotted line identifies 10% cover, a potential threshold for
net-700
Fig. 2. Relationship between climate, social, environment and methodology variables with total
coral cover and life history type. Standardized effect sizes are Bayesian posterior median values 705
with 95% Bayesian credible intervals (CI; thin black lines) and 80% credible intervals (coloured thicker lines); filled points indicate the 80% CI does not overlap with zero and open circles indicate an overlap with zero and a less credible trend. DHW indicates Degree Heating Weeks; HDI indicates the national statistic Human Development Index. For the effects of population gravity on stress-tolerant and weedy corals which can appear to intersect zero, there was a 96.0% 710
(15,362 out of 16,000 posterior samples) and 98.0% (15,670 out of 16,000) probability,
respectively, of a negative effect; for market gravity and competitive corals, there was a 90.2% (14,424 out of 16,000 posteriors) probability of a negative effect. Models of dominant coral genera are shown in Fig. S2.
715 ● ● ● ● ● ● ● ● ● ● ● ● ● ● ● ● ● ● ● ● ● ● ● ● ● ● ● ● ● ● ● ● ● ● ● ● ● ● ● ● ● ● ● ● ● ● ● ● ● ● ● ● ● ● ● ● ● ● ● ● ● ● ● ● ● ● ● ● ● ● ● ● ● ● ● ● ● ● ● ● ● ● ● ● ● ● ● ● ● ● ● ● ● ● ● ● ● ● ● ● Total coral cover Competitive Stress−tolerant Generalist Weedy
Climate Social En vironment Methods −0.5 0.0 0.5 1.0 −0.5 0.0 0.5 1.0 −0.5 0.0 0.5 1.0 −0.5 0.0 0.5 1.0 −0.5 0.0 0.5 1.0 Maximum DHW
Years since maximum DHW
Restricted management No−take closures National HDI Croplands growth Total croplands Market gravity Population gravity Habitat, crest Habitat, flat Depth Primary productivity Wave exposure Cyclone exposure Reef area Latitude, from equator
Sampling points Photo quadrats Line intercept transects
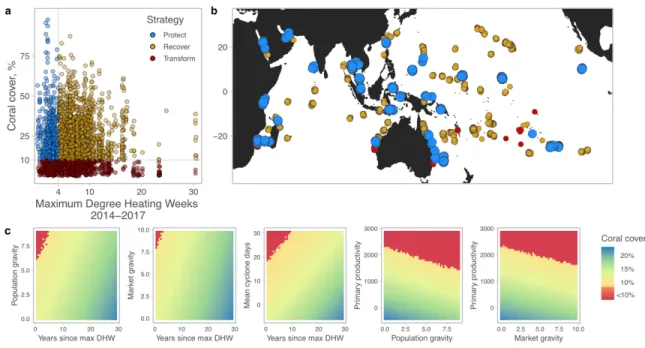
Fig. 3. Strategic management approaches of protect – recover – transform across Indo-Pacific
coral reefs. (A) The 2,584 reefs varied in their exposure to maximum annual DHWs during the 2014-2017 Third Global Coral Bleaching Event. Reefs previously above a 10% threshold of framework corals (combined cover of stress tolerant and competitive corals, associated with net 720
positive carbonate budgets), and with limited exposure to potential bleaching-level thermal stress (<4 DHWs, see Fig. S4) may be potential refuges of ecological function to protect (blue dots, n = 449, or 17.4%). Recovery could be a priority for reefs that have recently maintained cover above 10% but were then exposed to severe potential bleaching stress in 2014-2017 (>4 DHWs, orange dots; n = 1407, or 54.5%). Societies may ultimately need to transform away from reef-dependent 725
livelihoods as coral cover falls below potential accretion thresholds (<10% hard coral cover, dark red dots; n = 728, or 28.2%). (B) The three management strategies are distributed throughout the Indo-Pacific (Fig. S4, Table S6), suggesting there remain opportunities to sustain a network of functioning reefs while supporting coral recovery or social transformations for the majority of reefs. (C) Combinations of key drivers that differentiate between reefs below (red) and above 730
10% cover of framework corals (yellow to blue gradient), based on model predictions (see Methods). Coral cover refers to the combined cover of competitive and stress-tolerant corals; gravity estimates are reported as log(values).