HAL Id: hal-02880016
https://hal.archives-ouvertes.fr/hal-02880016
Submitted on 24 Jun 2020HAL is a multi-disciplinary open access archive for the deposit and dissemination of sci-entific research documents, whether they are pub-lished or not. The documents may come from teaching and research institutions in France or abroad, or from public or private research centers.
L’archive ouverte pluridisciplinaire HAL, est destinée au dépôt et à la diffusion de documents scientifiques de niveau recherche, publiés ou non, émanant des établissements d’enseignement et de recherche français ou étrangers, des laboratoires publics ou privés.
COMBINED EFFECTS OF TEMPERATURE,
IRRADIANCE AND PH ON TELEAULAX
AMPHIOXEIA (CRYPTOPHYCEAE) PHYSIOLOGY
AND FEEDING RATIO FOR ITS PREDATOR
MESODINIUM RUBRUM (CILIOPHORA)
Sylvain Gaillard, Aurélie Charrier, Florent Malo, Liliane Carpentier, Gaël
Bougaran, Helene Hegaret, Damien Réveillon, Philipp Hess, Véronique Sechet
To cite this version:
Sylvain Gaillard, Aurélie Charrier, Florent Malo, Liliane Carpentier, Gaël Bougaran, et al.. COM-BINED EFFECTS OF TEMPERATURE, IRRADIANCE AND PH ON TELEAULAX AMPHIOX-EIA (CRYPTOPHYCEAE) PHYSIOLOGY AND FEEDING RATIO FOR ITS PREDATOR MESO-DINIUM RUBRUM (CILIOPHORA). Journal of Phycology, Wiley, 2020, 56 (3), pp.775-783. �10.1111/jpy.12977�. �hal-02880016�
1
COMBINED EFFECTS OF TEMPERATURE, IRRADIANCE AND PH ON TELEAULAX 1
AMPHIOXEIA (CRYPTOPHYCEAE) PHYSIOLOGY AND FEEDING RATIO FOR ITS
2
PREDATOR MESODINIUM RUBRUM (CILIOPHORA)1 3
Sylvain Gaillard2 IFREMER, Laboratoire Phycotoxines, rue de l’Ile d’Yeu, F-44311 Nantes 03, 4
France 5
Aurélie Charrier IFREMER, Laboratoire Physiologie et Biotechnologie des Algues (PBA), rue de 6
l’Ile d’Yeu, F-44311 Nantes 03, France 7
Florent Malo IFREMER, Laboratoire Phycotoxines, rue de l’Ile d’Yeu, F-44311 Nantes 03, 8
France 9
Liliane Carpentier IFREMER, Laboratoire Phycotoxines, rue de l’Ile d’Yeu, F-44311 Nantes 03, 10
France 11
Gaël Bougaran IFREMER, Laboratoire Physiologie et Biotechnologie des Algues (PBA), rue de 12
l’Ile d’Yeu, F-44311 Nantes 03, France 13
Hélène Hégaret IUEM-UBO, Laboratoire des sciences de l’environnement marin (LEMAR), 14
Technopôle Brest Iroise, 29280 Plouzané, France 15
Damien Réveillon IFREMER, Laboratoire Phycotoxines, rue de l’Ile d’Yeu, F-44311 Nantes 03, 16
France 17
Philipp Hess IFREMER, Laboratoire Phycotoxines, rue de l’Ile d’Yeu, F-44311 Nantes 03, 18
France 19
Véronique Séchet IFREMER, Laboratoire Phycotoxines, rue de l’Ile d’Yeu, F-44311 Nantes 03, 20
France 21
1
22
2 Author for correspondence: e-mail sylvain.gaillard@ifremer.fr Tel +33 (0)2 403 743 76, Fax
23
+33 (0)2 40 37 42 41 24
2 Running title
25
Factorial design Teleaulax and predator feeding 26
27
Abstract 28
The cryptophyte Teleaulax amphioxeia is a source of plastids for the ciliate Mesodinium rubrum 29
and both organisms are members of the trophic chain of several species of Dinophysis. It is 30
important to better understand the ecology of organisms at the first trophic levels before assessing 31
the impact of principal factors of global change on Dinophysis spp.. Therefore, combined effects 32
of temperature, irradiance and pH on growth rate, photosynthetic activity and pigment content of 33
a temperate strain of T. amphioxeia were studied using a full factorial design (central composite 34
design 23*) in 17 individually controlled bioreactors. The derived model predicted an optimal
35
growth rate of T. amphioxeia at a light intensity of 400 µmol photons · m-2 · s-1, more acidic pH 36
(7.6) than the current average and a temperature of 17.6 °C. An interaction between temperature 37
and irradiance on growth was also found, while pH did not have any significant effect. 38
Subsequently, to investigate potential impacts of prey quality and quantity on the physiology of 39
the predator, M. rubrum was fed two separate prey: predator ratios with cultures of T. amphioxeia 40
previously acclimated at two different light intensities (100 and 400 µmol photons · m-2 · s-1). M. 41
rubrum growth appeared to be significantly dependant on prey quantity while effect of prey
42
quality was not observed. This multi-parametric study indicated a high potential for a significant 43
increase of T. amphioxeia in future climate conditions but to what extent this would lead to 44
increased occurrences of Mesodinium spp. and Dinophysis spp. should be further investigated. 45
46
47
Key index words 48
3
Dinophysis; ecophysiology; full factorial design; global change; Mesodinium rubrum; Teleaulax
49 amphioxeia 50 51 Abbreviations 52
Chl c, chlorophyll c; Fv/Fm, maximum quantum yield of the photosystem II; HL, high light; L: D,
53
light: dark; LL, low light; TChl a, total chlorophyll a; TCarotenoids, total carotenoids; µmax, 54
maximum growth rate 55 56 57 58 59 60 61 62 63 64 65 66 67 68 69 70 71 Introduction 72
4
The cryptophyte Teleaulax amphioxeia (Conrad) Hill (Hill 1992) is observed worldwide and has 73
been reported to forms red tides in coastal waters (Yoo et al. 2017). This organism is a prey and a 74
source of plastids for the mixotrophic ciliate Mesodinium rubrum (Lohmann 1908, = Myrionecta 75
rubra Jankowski 1976), which is also known to form red-colored blooms in coastal ecosystems
76
(Lindholm 1985). The ingested plastids and nuclei of T. amphioxeia are incorporated in M. 77
rubrum (Yih et al. 2004, Johnson and Stoecker 2005, Johnson et al. 2007) and remain
78
photosynthetically and transcriptionally active to sustain growth of the ciliate (Johnson et al. 79
2007, Kim et al. 2017). Cryptophytes, as T. amphioxeia, play an important role in ecosystem 80
dynamics as they are a ‘common food organism’ (Yih et al. 2004) of several protists (Smith and 81
Hansen 2007, Peterson et al. 2013). Interestingly, the mixotrophic and harmful species of the 82
dinoflagellate genus Dinophysis (Ehrenberg 1841) exhibit chloroplasts of cryptophyte origin, 83
obtained by ingestion of M. rubrum (Park et al. 2006, Wisecaver and Hackett 2010). A both 84
relationship between T. amphioxeia and M. rubrum and between M. rubrum and occurrence of 85
Dinophysis spp. has been suggested in natural environments (Herfort et al. 2011, Peterson et al.
86
2013, Hamilton et al. 2017). The influence of M. rubrum concentration on growth (Park et al. 87
2006, Kim et al. 2008, Nagai et al. 2011, Tong et al. 2011, Hattenrath-Lehmann and Gobler 2015, 88
Smith et al. 2018) and toxin production (Gao et al. 2017) of Dinophysis spp. was even observed 89
in lab experiments. M. rubrum growth depends on cryptophytes including T. amphioxeia (Yih et 90
al. 2004, Johnson 2011) but also on abiotic factors, such as light (Moeller et al. 2011), pH (Smith 91
and Hansen 2007) or temperature (Basti et al. 2018). However few studies have focused on the 92
physiology of T. amphioxeia and its effects on growth and pigment content of M. rubrum. Such 93
studies are thus required to improve knowledge on the bottom of the food chain of Dinophysis 94
spp., and consequently on the understanding of environmental dynamics of both M. rubrum and 95
Dinophysis spp. growth and blooms. It is widely recognized that climate change modifies
5
harmful algal bloom duration and frequency (Glibert et al. 2014, Gobler et al. 2017) and in this 97
context, according to Wells et al. (2015), temperature, light and pH appear to be key variables. 98
Therefore, we investigated the effects of these three parameters on the ecophysiology of T. 99
amphioxeia. First, a full factorial design (central composite design 23*) was applied to assess the 100
direct combined effects of temperature, irradiance and pH as well as their interactions on the 101
maximum growth rate, pigment content and maximum quantum yield of the photosystem II 102
(Fv/Fm). The central composite design 23* required 15 experimental conditions with triplicate
103
cultures for the central condition (Lundstedt et al. 1998). A culture device composed of 17 photo-104
bioreactors, previously developed by Marchetti et al. (2012), was used to perform the factorial 105
design. This approach minimizes the number of experiments that need to be carried out to assess 106
the effects of parameters on a specific response. Also, this design easily allows for the 107
development of statistical models of the maximum growth rate, pigment quantity and Fv/Fm.
108
Finally, M. rubrum was fed two photo-acclimated cultures (100 and 400 µmol photons · m-2 · s-1) 109
of T. amphioxeia displaying different pigment contents and at two different prey: predator ratios 110
to study the effect of prey physiology and quantity on the ciliate. 111
112
Materials and methods 113
Full factorial design experiment on T. amphioxeia
114
Culture of T. amphioxeia 115
The cryptophyte Teleaulax amphioxeia (AND-A0710) was cultivated in L1 medium without 116
silicate (L1-Si) at salinity 35 (Guillard and Hargraves 1993). Cultures were maintained at 17.8 ± 117
0.6 °C, a light intensity of ~ 100 µmol photons · m-2 · s-1 provided by cool-white and pink 118
fluorescent tubes (fluora and cool-white fluorescent light, Osram, Munich, Germany) and a 12: 119
12 light: dark (L: D) cycle (Table S1). T. amphioxeia was maintained in a semi-continuous 120
6
culture (i.e. bi-weekly dilutions), allowing for constant physiological conditions. Cultures were 121 not axenic. 122 123 Factorial design 124
The direct effects, interactions and optima of temperature, irradiance and pH on the maximum 125
growth rate (µmax), the maximum quantum yield of the photosystem II (Fv/Fm) and the pigment
126
content of T. amphioxeia were studied using a central composite design (23*, Appendix S1). Five 127
levels were used for each factor to estimate the second order quadratic component of the 128
relationship between a factor and the three parameters. After the determination of a central value, 129
limits and axial points (i.e. star points) for each factor (Table 1), the 17 required measurements 130
(i.e. 15 experimental conditions with a triplicate for the central one) were performed thanks to a 131
culture device consisting of 17 photo-bioreactors placed in a software-controlled incubator. Each 132
photo-bioreactors was thermo-regulated by a heater connected to a temperature sensor, light was 133
supplied by a xenon lamp and pH was measured using a pH electrode (Mettler-Toledo®) and 134
controlled by CO2 injections (Marchetti et al. 2012). As pH was only controlled by injection of
135
CO2, it was only possible to limit the increase in pH during the light period; overall variations in
136
pH did not exceed the regulated pH by 0.5 unit. 137
The day of the experiment, the photo-bioreactors were sterilized with a solution of 0.5% of 138
DEPTIL PA 5 (Hypred SAS, Dinard, France) and thoroughly rinsed with culture medium. The 139
photo-bioreactors were thereafter filled with 150 mL of inoculum at a concentration of 3.5 × 10⁵ 140
cells mL-1 and randomly placed in the culture device with a 12: 12 (L: D) cycle. A bi-daily
141
sampling of 1 mL of each culture was used for cell counting. During the exponential growth 142
7
phase, 10 mL of each photo-bioreactor were sampled for pigment analysis and Fv/Fm
143
measurements. 144
Effect of the prey on Mesodinium rubrum
145
Photo-acclimation of T. amphioxeia 146
Semi-continuous cultures in flasks were established in order to acclimate T. amphioxeia to two 147
light conditions (Wood et al. 2005). The low light (LL; 100 µmol photons · m-2 · s-1) and high 148
light (HL; 400 µmol photons · m-2 · s-1) conditions were chosen based on the results of the 149
factorial design experiment (Appendix S1 and Table S2) to induce contrasting µmax, Fv/Fm and
150
pigment contents. Temperature was set according to the optimal growth rate conditions (i.e. 17.6 151
°C) and pH was uncontrolled as previous experiments indicated that pH did not significantly 152
influence µmax, Fv/Fm and pigment contents. Growth was monitored every day and cultures were
153
diluted every two days by adding fresh L1-Si medium. The maximum growth rate, pigment 154
content and Fv/Fm were measured to monitor the acclimation of the cultures (Wood et al. 2005).
155
156
Feeding experiment 157
The ciliate Mesodinium rubrum (AND-A0711) was routinely maintained in sterilized sea water in 158
the same conditions as T. amphioxeia (Table S1) and fed three times a week at a ratio of 1: 1 159
(prey: predator). The ciliates were starved one week before the experiment to reduce the number 160
of plastids. The day of the experiment, 80 mL M. rubrum cultures at a concentration of 5 × 10³ 161
cells mL-1 were fed T. amphioxeia acclimated at LL or HL conditions and at a prey: predator 162
ratio of 1: 1 (low fed LL or HL) or 10: 1 (high fed LL or HL). In addition, three controls were 163
used, one unfed culture of M. rubrum and two cultures of T. amphioxeia previously acclimated to 164
LL and HL conditions but maintained in sterilized sea water (i.e. without L1-Si medium 165
8
enrichment) as for M. rubrum. All the cultures were placed in a culture chamber at a temperature 166
of 17.6 °C and an irradiance of 100 µmol photons · m-2 · s-1 (i.e. corresponding to the LL 167
condition). The monitoring of cell growth, pigment content and Fv/Fm was performed during the
168
exponential growth phase of M. rubrum and for the control cultures. 169
170
Experimental set-up
171
Counting and growth rate 172
Counting of T. amphioxeia during the factorial design experiment was directly performed on 173
fresh samples by flow cytometry on a Accuri C6 flow cytometer (Becton Dickinson Accuri™) 174
equipped with blue and red lasers (488 and 640 nm), detectors of forward (FSC) and side (SSC) 175
light scatter, and fluorescence detectors: 585 ± 20 nm (FL2 and 675 ± 12.5 nm (FL4). FL2 vs 176
FL4 channel density plots, corresponding to phycoerythrin and chlorophyll a, were used to count 177
T. amphioxeia, using Accuri™ C6 software. Counting during the semi-continuous experiment
178
and the feeding experiment were performed on a particle counter equipped with a 100 µm 179
aperture tube (Multisizer 3, Coulter Counter, Beckman, Paris, France). 180
The maximum growth rates were calculated from the slope of the linear regression for the natural 181
logarithm-transformed values of population size during the time interval of exponential growth 182
phase (i.e. ranging from 2 to 4 days for both species) (Guillard 1973). 183
184
The maximum quantum yield of the photosystem II (Fv/Fm)
185
Fv/Fm is considered to be a proxy of algal health (Woźniak et al. 2002, Kromkamp and Forster
186
2003, Moeller et al. 2011) and was assessed with the Pulse Amplitude Modulation (PAM) 187
method (Schreiber et al. 1986) in a Phyto-PAM (Walz GmbH, Effeltrich, Germany). 188
9 189
Pigment analysis 190
Pigment concentrations were measured by filtering 3 mL of cultures onto 25 mm Whatman GF/F 191
filters (Whatman, Sigma-Aldrich, Maidstone, UK). Filters were immediately frozen in liquid 192
nitrogen and stored in the dark at -80 °C (Zapata et al. 2000). The analysis of pigments was 193
performed by using HPLC with UV or fluorescence detection as previously described by Ras et 194
al. (2008). Total chlorophyll a (TChl a) (sum of chlorophyll a and chlorophyllid a), chlorophyll c 195
(Chl c) and total carotenoids (TCarotenoids) (sum of alloxanthin, crocoxanthin and α-carotene) 196
were expressed on a per cell basis (pg · cell-1) of T. amphioxeia or M. rubrum. The hydrosoluble
197
phycoerythrin, which is a typical pigment of Cryptophyceae (Jeffrey et al. 2011), was not 198
measured in this work. 199
200
Statistical analyses
201
Statgraphics v 18.1.02 was used to analyze the full factorial design experiment and statistical 202
analyses were computed on RStudio v 1.1.463. After checking the assumptions of independence 203
(Durbin-Watson test), homoscedasticity (Bartlett test) and normality (Shapiro-Wilk test) of the 204
residuals, direct effects of temperature, irradiance and pH and their interactions were investigated 205
using two-way ANOVA for the factorial design experiment. For the other experiments, t-test or 206
one-way ANOVA followed by a Tukey post hoc test were performed. Otherwise Mann-Withney 207
U or Kruskal-Wallis tests were used, followed by a Conover test. Differences were considered 208
statistically significant when P < 0.05, for a significance level of α = 0.05. Values are expressed 209
as mean ± SD. Experiments were performed in triplicate. 210
10 211
Results 212
Direct effects, interactions and optimum of temperature, irradiance and pH on the physiology of
213
T. amphioxeia 214
Effect on the maximum growth rate 215
According to the 23* experimental design, the model of µmax (µmax th) explained 90% of the
216
observed variability (regression coefficients and equation of the model for µmax th are shown
217
AppendixS1 and Table S2). Both significant linear and quadratic effects of temperature (one-way 218
ANOVA, F2,14 = 9.51, P = 0.02) and irradiance (one-way ANOVA, F2,14 = 7.31, P = 0.03) were
219
observed on µmax (Figure 1 A) while pH was not significant across the experimental domain 220
(Figure 1 A-B). In addition, a significant interaction (two-way ANOVA, F2,14 = 10.93, P = 0.01)
221
between temperature and irradiance (Figure 1 C) was noted, with a positive effect of temperature 222
on µmax at low irradiance and the opposite effect under high irradiance. The predicted value of 223
µmax for T. amphioxeia was 0.88 d-1, obtained for a temperature of 17.6 °C, a pH of 7.6 and an
224
irradiance of 400 µmol photons · m-2 · s-1 under a circadian cycle 12: 12 (L: D) (Figure 1 D). 225
After the experiment, µmax th was checked under the predicted optimal conditions using three
226
photo-bioreactor replicates in the same culture device and the µmax obtained was in very good 227
agreement with the predicted growth rate (0.873 ± 0.003 d-1). 228
229
Effect on the Fv/Fm and the pigment content
230
Models of maximum quantum yield of the photosystem II (Fv/Fm th), total chlorophyll a (TChl a
231
th), chlorophyll c (Chl c th) and total carotenoids (TCarotenoids th) explained 98%, 69%, 69% and
232
67% of the observed variability, respectively. Briefly, across the experimental domain Fv/Fm th
11
was influenced by the same factors as µmax (i.e. optimal Fv/Fm th at intermediate temperature and
234
irradiance) whereas optimum of TChl a th and Chl c th were obtained at low irradiance (Figure
235
S1). We further checked independently and in triplicate the accuracy of predicted modeled values 236
using the conditions corresponding to µmax th. The measured values were in good agreement
237
with predicted ones for Fv/Fm th, TChl a th and Chl c th but not for TCarotenoids th. Regression
238
coefficients and equation of the models for Fv/Fm th, TChl a th and Chl c th were shown in
239
Appendix S1 and Table S2. 240
241
Light acclimation of T. amphioxeia
242
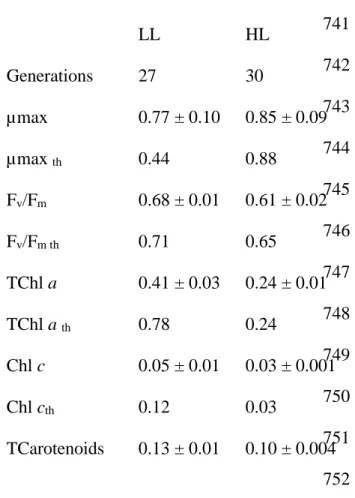
After 27-30 generations, µmax of LL and HL-acclimated T. amphioxeia cultures were stable but 243
significantly higher in HL condition (0.85 ± 0.09 vs. 0.77 ± 0.10 d-1, t-test, T
1,14 = 2.30, P = 0.03;
244
Table 2). However, TChl a and Chl c contents were significantly (t-test, T1,1 = 9.75 and 9.27
245
respectively, P = 0.001) ca. twice higher in T. amphioxeia grown in LL while similar 246
TCarotenoids contents were observed between the two light conditions (Table 2). Fv/Fm were
247
high for both photo-acclimated T. amphioxeia (> 0.6) but significantly higher for the LL-248
acclimated condition (t-test, T1,1 = 4.53, P = 0.01; Table 2). The maximum growth rate, TChl a,
249
Chl c and Fv/Fm of the HL-acclimated culture of T. amphioxeia were close to the modeled values,
250
whereas for the LL-acclimated culture, µmax was 1.75-fold higher and around 2-fold lower TChl 251
a and Chl c than modeled values (Table 2).
252
253
Feeding experiment
254
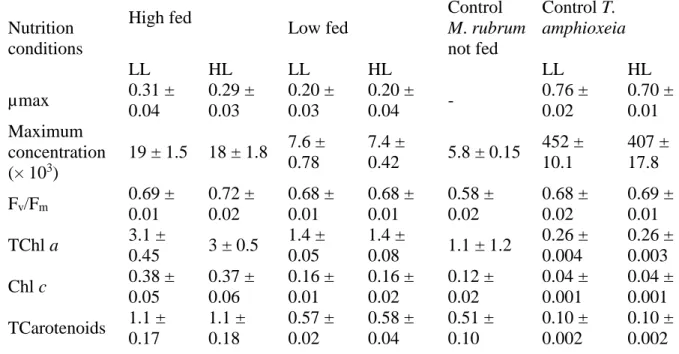
The maximum growth rates, maximum cellular concentrations and pigment contents of M. 255
rubrum were not significantly different when using LL or HL-acclimated T. amphioxeia cultures
12
(Table 3). However, these responses depended significantly on the nutrition ratio applied. Indeed, 257
high-fed condition resulted in 1.5-fold higher µmax (t-test, T1,9 = 4.99, P = 0.001), 2.5 times
258
higher maximum cellular concentrations (t-test, T1,9 = 15.09, P < 0.001) and twice as high TChl
259
a, Chl c and TCarotenoids (t-test, T1,4 = 8.89, 9.15 and 7.08, respectively, P < 0.001; Table 3). 260
The Fv/Fm ranged from 0.68 ± 0.01 to 0.72 ± 0.02 and were not significantly different among the
261
nutrition conditions. The unfed control of M. rubrum did not show a positive growth and had a 262
significantly lower maximum cellular concentration Fv/Fm, TChl a, Chl c and TCarotenoids
(one-263
way ANOVA, F2,9 = 19.54, 55.18, 65.67, 70.48 and 37.22, respectively, P < 0.001, Table 3). The
264
two T. amphioxeia controls maintained in sterilized sea water and previously acclimated to LL 265
and HL conditions had similar µmax, Fv/Fm, TChl a, Chl c and TCarotenoids contents after three
266
days of growth in LL condition. When compared to the semi-continuous cultures, the control LL 267
culture of T. amphioxeia possessed 1.5 times less TChl a (t-test, T1,4 = 9.40, P = 0.001) and the
268
control HL culture had a 1.2-fold lower µmax (t-test, T1,16 = 3.59, P = 0.002) whereas its Fv/Fm
269
increased (t-test, T1,4 = 5.71, P = 0.005) (Tables 2 and 3).
270
271
Discussion 272
Full factorial design experiment on T. amphioxeia and photo-acclimation in semi-continuous
273
culture
274
The present study first investigated the effect of temperature, irradiance, pH and their interactions 275
on the growth of Teleaulax amphioxeia thanks to a factorial design experiment. Beforehand, we 276
tested a wide range of values for each factor (temperature 13-30 °C, irradiance 20-800 µmol 277
photons · m-2 · s-1, pH 6-10) and tried to determine the factor levels (Table 1) as conditions 278
allowing for growth in order to increase the robustness of obtained models. 279
13
Results of the 23* full factorial design underlined the importance of temperature and irradiance on
280
growth, while pH was not significant on the strain AND-A0710 of T. amphioxeia (direct effects). 281
Interestingly, a significant interaction between the two factors temperature and irradiance was also 282
observed for the maximum growth rate. Generally, the interaction between these two factors results 283
in µmax increasing with temperature under light saturation (Ojala 1993, Edwards et al. 2016, Wirth 284
et al. 2019). However, our results showed that µmax was strongly affected at temperatures higher 285
than the optimal one when irradiance was high. Hence the increase of temperature did not allow 286
the strain to better cope with photoinhibition. The decrease in µmax beyond 400 µmol photons · 287
m-2 · s-1 may suggest photoinhibition of the photosystem II. It has been shown for microalgae that 288
an increase of temperature can reduce the carboxylase activity of the Rubisco (i.e. the catalytic 289
enzyme of photosynthesis) while promoting the production of oxygen radicals that lead to 290
oxidation of lipids and reaction centers of photosystem II (Ras et al. 2013, Kale et al. 2017) and 291
ultimately to photoinhibition. We hypothesized that with our conditions of culture and especially 292
because of the wide range of temperatures we applied, the increase of temperature here enhanced 293
the effect of photoinhibition but further work is needed to understand how this interaction impacts 294
T. amphioxeia.
295
The optimal maximum growth rate for this temperate strain was obtained for intermediate tested 296
irradiance (400 µmol photons · m-2 · s-1) and temperature (17.6 °C), whereas a deviation towards 297
high temperature and irradiance (>22.6 °C and 646 µmol photons · m-2 · s-1) led to lower µmax. 298
The maximum growth rate was ca. 0.88 d-1 according to the factorial design and values measured 299
from the independent triplicate verification. 300
As far as we know, the same strain of T. amphioxeia was used in two other studies with similar 301
culture conditions. In the first one, Rial et al. (2013) found a maximal µmax of 0.98 and 1.6 d-1 at 302
14
70 and 200 µmol photons · m-2 · s-1, respectively, also suggesting a high impact of light on growth
303
under stress conditions, i.e. without photo-acclimation. In the other study, García-Portela et al. 304
(2018) photo-acclimated the cultures and did not observe a significant difference of µmax between 305
200 and 650 µmol photons · m-2 · s-1. This is similar to what we observed for our photo-acclimated 306
cultures, as µmax at 100 and 400 µmol photons · m-2 · s-1 were only 10% different (but still 307
significantly different). The differences in µmax between the current study and the previous ones 308
(Rial et al. 2013, García-Portela et al. 2018) are likely explained by a different experimental setup. 309
Nevertheless, our results and those from García-Portela et al. (2018) confirmed the high photo-310
acclimation ability of T. amphioxeia. 311
T. amphioxeia can also tolerate or acclimate to other abiotic factors. Indeed, Lee et al. (2019)
312
reported that several strains of T. amphioxeia isolated from cold and temperate waters (i.e. 5.4 to 313
28.9 °C) can all be acclimated to the same temperature in the lab (i.e. 20 °C). Our results also 314
showed that T. amphioxeia was able to grow under stress conditions across all the experimental 315
domain except under high temperature (> 22.6 °C), high irradiance (> 646 µmol photons · m-2 · s
-316
1) or the combination of both (i.e. n°13, 4, 11 and 16 in Table S3).
317
In addition, a previous lab study on a Danish strain of T. amphioxeia reported a positive growth at 318
elevated pH 9.4 (Smith and Hansen 2007). Our results suggested a high tolerance to pH of the T. 319
amphioxeia strain used, including for values already occasionally found in some coastal waters
320
(e.g. < 8) (Feely et al. 2008). According to some predictions, in 2100, average pH in the world 321
ocean would be around 7.7 (Haugan and Drange 1996, Brewer 1997, Orr et al. 2005, Gattuso and 322
Hansson 2011) and would thus not significantly impact the growth of T. amphioxeia. Altogether, 323
these results suggest an important plasticity of the species which may explain why T. amphioxeia 324
is found in diverse ecological niches. 325
15
It should be noted that we observed some discrepancies between values predicted by the surface 326
response and values really observed during the factorial design experiment and for the photo-327
acclimated cultures. For the HL-acclimated condition, the experimental µmax, Fv/Fm and pigment
328
content fitted well with the predicted modeled values. However, for the LL-acclimated condition, 329
observed and predicted values of µmax, TChl a and Chl c were not in agreement (Table 2). These 330
differences may arise from the fact that this type of factorial design is performed to determine 331
optimal conditions across an experimental domain and not extreme values (Lundstedt et al. 332
1998). Indeed, while there was almost no difference for the central points between predicted and 333
measured values in the factorial design, we noted for the irradiance star point (Table S3 n°6) a 334
difference of 57%, 5%, 30% and 29% for µmax, Fv/Fm, TChl a and Chl c, respectively. These
335
levels of difference were reflected in the LL-acclimated culture between predicted and observed 336
values. In addition, experiments were performed in stress condition while the semi-continuous 337
cultures led to acclimation as reflected by the stable µmax, Fv/Fm and pigment contents after
338
more than 27 generations. The presence of bacteria in the cultures of T. amphioxeia cannot be
339
excluded. T. amphioxeia can feed on bacteria (Yoo et al. 2017), especially in light-limited
340
conditions (Marshall and Laybourn-Parry 2002), thus its mixotrophic ability might also explain
341
the discrepancies observed in LL on growth rate and pigment content
342
The factorial design experiment helped to better understand the physiological responses of the 343
temperate strain of T. amphioxeia which belongs to the Teleaulax/Plagioselmis/Geminifera clade 344
(Hansen et al. 2012). T. amphioxeia is an important donor of plastids to M. rubrum (Peterson et 345
al. 2013, García-Portela et al. 2018, Hernández-Urcera et al. 2018, Johnson et al. 2018) and thus 346
indirectly to Dinophysis spp. (Park et al. 2006).Low light conditions (< 100 µmol photons · m-2 · 347
s-1) coupled with intermediate tested temperature resulted in limited growth of T. amphioxeia 348
(while maintaining high pigment content and Fv/Fm) and helped prevent the organism
16
“outgrowing” M. rubrum and Dinophysis spp. in routine laboratory cultures. Furthermore, 350
controlling the pH of T. amphioxeia cultures may be not necessary as this species appears to 351
tolerate pH from 6.0 (this study, data not shown) up to 9.4 (Smith and Hansen 2007). Thanks to 352
the factorial design experiment, the present study determined the optimal conditions to obtain a 353
large biomass that may be useful to exploit the beneficial role of T. amphioxeia as a food 354
enrichment (Peltomaa et al. 2018 and Lee et al. 2019). This approach also provided information 355
on factors driving the bloom initiation of T. amphioxeia. In natural environments, T. amphioxeia 356
has been found in higher concentration several meters below the surface (Peterson et al. 2013), 357
indicating that the species easily moves in the water column. This field observation coincides 358
with our experimental observation that high light intensity diminishes µmax. We thus 359
hypothesized that T. amphioxeia can perform photosynthesis at a water depth of several meters 360
and can thus escape conditions of higher light intensity at surface. Nonetheless, the intraspecific 361
variability of the species should be explored, including strains from polar and temperate regions. 362
363
Feeding experiment of M. rubrum
364
M. rubrum is a mixotrophic organism which acquires and maintains photosynthesis by ingestion
365
of cryptophyte plastids (Gustafson et al. 2000, Yih et al. 2004, Johnson et al. 2006) and 366
cryptophyte nuclei (Johnson et al. 2007, Kim et al. 2017). As the contribution of carbon fixation 367
through photosynthesis appears higher than the contribution of prey (Moeller et al. 2011), the aim 368
of the nutrition experiment was to assess the effect of the physiology of the prey on its predator 369
M. rubrum.
370
We first photo-acclimated T. amphioxeia in semi-continuous cultures and obtained a LL-371
acclimated culture with higher pigment content and Fv/Fm compared to the HL-acclimated
372
culture. The pigment profile of photo-acclimated T. amphioxeia was similar to the ones observed 373
17
by Rial et al. (2013) and García-Portela et al. (2018) with the major lipophilic pigments being 374
Chl a and alloxanthin. Alloxanthin to TChl a ratio was higher in HL-acclimated culture, as 375
already shown for Rhodomonas salina (Schlüter et al. 2000), but in our study it was due to a 376
decrease in TChl a, thus not supporting the reported photoprotection role of alloxanthin in T. 377
amphioxeia (Laviale and Neveux 2011, Roy et al. 2011). Values of Fv/Fm suggested a good
378
cellular health (Moeller et al. 2011) in both LL and HL acclimations, with a significantly higher 379
value in the LL-acclimated compared to the HL-acclimated culture (0.68 ± 0.01 and 0.61 ± 0.02), 380
as already observed by García-Portela (2018) with the same strain of T. amphioxeia. Overall, 381
differences obtained in terms of pigment contents and Fv/Fm suggested that the LL-acclimated
382
culture of T. amphioxeia may be a better quality food source in term of photosynthetic capacity 383
for M. rubrum 384
However, feeding with prey of different physiology (i.e. LL or HL-acclimated T. amphioxeia) 385
yielded no significant effect on µmax, Fv/Fm and pigment content of M. rubrum. Unfortunately,
386
the control of T. amphioxeia acclimated to the HL condition had already converted its pigment 387
content to a content equivalent to the LL condition after 3 days. Therefore the difference of 388
physiological status of the preys was not maintained during all the feeding experiment and to 389
what extent this influenced the results should be further elucidated. Interestingly, this observation 390
highlights another evidence of the plasticity of T. amphioxeia, which can easily acclimate to 391
different light conditions. 392
This study clearly confirmed the positive effect of prey quantity on M. rubrum, i.e. a high feeding 393
ratio 10: 1 (prey: predator) yielded significantly higher µmax, maximum cellular concentrations, 394
Fv/Fm and pigment contents compared to the low feeding ratio 1: 1. Indeed, prey quantity had
395
been shown to be beneficial for M. rubrum growth (Peltomaa and Johnson (2017), with a 75% 396
increase in µmax for a feeding ratio of 44: 1 compared to 1: 1. These experimental studies 397
18
corroborate the occurrence of Mesodinium spp. in situ being quantitatively related to the presence 398
of T. amphioxeia (Herfort et al. 2011, Peterson et al. 2013, Hamilton et al. 2017). However, in the 399
environment, different factors may also contribute to bloom development of Mesodinium spp. For 400
instance, in the Columbia River estuary, development and structure of M. rubrum blooms may 401
also be explained by changes in abiotic factors (e.g. increases of light intensity and dissolved 402
organic compounds, a decrease of turbulence), or biotic factors (e.g. prey preference and 403
availability), or a combination of those factors (Herfort et al. 2011, Peterson et al. 2013). 404
Nonetheless, the impact of nutrient limitations and ratios on growth and photosynthetic activity
405
of T. amphioxeia should be further investigated, as they also appeared to drive M. rubrum bloom
406
initiation (Peterson et al. 2013, Hamilton et al. 2017) and directly impact growth of M. rubrum 407
(Hattenrath-Lehmann and Gobler 2015).
408
The preponderant effect of feeding ratio was also evident on pigment content, which was twice as 409
concentrated in the high fed M. rubrum. Comparing maximal pigment contents between both M. 410
rubrum and T. amphioxeia, the ciliate had around 8 times more pigments per cell. This
411
observation is consistent with the 6 to 36 plastids of T. amphioxeia harbored by M. rubrum 412
(Hansen and Fenchel 2006). However, there is probably a high intra-specific variability between 413
strains of M. rubrum in terms of behavior, size and prey preference, possibly related to different 414
haplotypes (Herfort et al. 2011), thus extrapolation of results should be done with care. 415
416
Conclusion 417
This study shows the impact of two key variables of global change (temperature and irradiance) 418
on the physiology of the cryptophyte T. amphioxeia, which is one of the first level organism of 419
the trophic chain of Dinophysis spp.. Also, importantly, pH appeared to not impact on growth of 420
at least the strain in this study. While a slight increase of irradiance and temperature would lead 421
19
to an increased concentration of T. amphioxeia, a negative interaction was observed for high 422
temperature combined with high irradiance. It is not evident whether such a condition is of high 423
environmental relevance for an organism which has been observed to occur at several meter 424
water depth. This study suggests that future climate conditions appear not detrimental to T. 425
amphioxeia. An increase of T. amphioxeia abundance would favour M. rubrum growth and
426
pigment content, which in turn might lead to increased occurrence of Dinophysis spp.. 427
428
Acknowledgements 429
This work was funded by the project CoCliME which is part of ERA4CS, an ERA-NET initiated 430
by JPI Climate, and funded by EPA (IE), ANR (FR), BMBF (DE), UEFISCDI (RO), RCN (NO) 431
and FORMAS (SE), with co-funding by the European Union (Grant 690462). We thank Beatriz 432
Reguera for T. amphioxeia and M. rubrum strains, Céline Dimier and Joséphine Ras from the 433
SAPIGH analytical platform of the Laboratoire d’Océanographie de Villefranche (CNRS-434 France). 435 436 437 Conflict of interest 438
Authors declare no conflicts of interest. 439
References 440
Basti, L., Suzuki, T., Uchida, H., Kamiyama, T. & Nagai, S. 2018. Thermal acclimation affects 441
growth and lipophilic toxin production in a strain of cosmopolitan harmful alga Dinophysis 442
acuminata. Harmful Algae. 73:119–28.
443
20
Brewer, P.G. 1997. Ocean chemistry of the fossil fuel CO2 signal: The haline signal of “business 445
as usual.” Geophys. Res. Lett. 24:1367–9. 446
447
Edwards, K.F., Thomas, M.K., Klausmeier, C.A. & Litchman, E. 2016. Phytoplankton growth and 448
the interaction of light and temperature: A synthesis at the species and community level. Limnol. 449
Oceanogr. 61:1232–44.
450
451
Ehrenberg, C.G. 1841. Über noch jetzt zahlreich lebende Thierarten der Kreidebildung und den 452
Organismus der Polythalamien. In Abhandlungen Der Königlichen Akademie Der Wissenschaften 453
Zu Berlin 1839. p. 81–174.
454
455
Feely, R.A., Sabine, C.L., Hernandez-Ayon, J.M., Ianson, D. & Hales, B. 2008. Evidence for 456
upwelling of corrosive “acidified” water onto the continental shelf. Science. 320:1490–92. 457
458
Gao, H., An, X., Liu, L., Zhang, K., Zheng, D. & Tong, M. 2017. Characterization of Dinophysis 459
acuminata from the Yellow Sea, China, and its response to different temperatures and Mesodinium
460
prey. Oceanol. Hydrobiol. Stud. 46:439-50 461
462
García-Portela, M., Riobó, P., Reguera, B., Garrido, J.L., Blanco, J. & Rodríguez, F. 2018. 463
Comparative ecophysiology of Dinophysis acuminata and D. acuta (Dinophyceae, Dinophysiales): 464
21
effect of light intensity and quality on growth, cellular toxin content, and photosynthesis1. J.
465
Phycol. 54:899-917
466
467
Gattuso, J.-P. & Hansson, L. 2011. Ocean acidification. Oxford University. Oxford. 326 pp. 468
469
Glibert, P.M., Icarus Allen, J., Artioli, Y., Beusen, A., Bouwman, L., Harle, J., Holmes, R. & Holt, 470
J.2014. Vulnerability of coastal ecosystems to changes in harmful algal bloom distribution in 471
response to climate change: projections based on model analysis. Glob. Chang. Biol. 20:3845–58. 472
473
Gobler, C.J., Doherty, O.M., Hattenrath-Lehmann, T.K., Griffith, A.W., Kang, Y. & Litaker, R.W. 474
2017. Ocean warming since 1982 has expanded the niche of toxic algal blooms in the North 475
Atlantic and North Pacific oceans. Proc. Natl. Acad. Sci. 114:4975–80. 476
477
Guillard, R. & Hargraves, P. 1993. Stichochrysis immobilis is a diatom, not a chrysophyte. 478
Phycologia. 32:234–6.
479
480
Guillard, R.R.L. 1973. Division rates. In Stein, J. R. [Ed.] Handbook of Phycological Methods: 481
Culture Methods and Growth Measurements. Cambridge University Press, Cambridge, pp. 289–
482
311. 483
22
Gustafson, D.E., Stoecker, D.K., Johnson, M.D., Van Heukelem, W.F. & Sneider, K. 2000. 485
Cryptophyte algae are robbed of their organelles by the marine ciliate Mesodinium rubrum. Nature. 486
405:1049–52. 487
488
Hamilton, M., Hennon, G.M.M., Morales, R., Needoba, J., Peterson, T.D., Schatz, M., Swalwell, 489
J., Armbrust, E.V. & Ribalet, F. 2017. Dynamics of Teleaulax -like cryptophytes during the decline 490
of a red water bloom in the Columbia River Estuary. J. Plankton Res. 39:589–99. 491
492
Hansen, P.J. & Fenchel, T. 2006. The bloom-forming ciliate Mesodinium rubrum harbours a single 493
permanent endosymbiont. Mar. Biol. Res. 2:169–77. 494
495
Hansen, P.J., Moldrup, M., Tarangkoon, W., Garcia-Cuetos, L. & Moestrup, Ø. 2012. Direct 496
evidence for symbiont sequestration in the marine red tide ciliate Mesodinium rubrum. Aquat. 497
Microb. Ecol. 66:63–75.
498
499
Hattenrath-Lehmann, T. & Gobler, C.J. 2015. The contribution of inorganic and organic nutrients 500
to the growth of a North American isolate of the mixotrophic dinoflagellate, Dinophysis acuminata. 501
Limnol. Oceanogr. 60:1588–603.
502
503
Haugan, P.M. & Drange, H. 1996. Effects of CO2 on the ocean environment. Energy Convers. 504
Manag. 37:1019–22.
23 506
Herfort, L., Peterson, T.D., McCue, L.A., Crump, B.C., Prahl, F.G., Baptista, A.M., Campbell, V., 507
Warnick, R., Selby, M., Roegner, G.C. & Zuber, P. 2011. Myrionecta rubra population genetic 508
diversity and its cryptophyte chloroplast specificity in recurrent red tides in the Columbia River 509
estuary. Aquat. Microb. Ecol. 62:85–97. 510
511
Hernández-Urcera, J., Rial, P., García-Portela, M., Lourés, P., Kilcoyne, J., Rodríguez, F., 512
Fernández-Villamarín, A. & Reguera, B. 2018. Notes on the Cultivation of Two Mixotrophic 513
Dinophysis Species and Their Ciliate Prey Mesodinium rubrum. Toxins. 10:505.
514
515
Jeffrey, S.W., Wright, S.W. & Zapata, M. 2011. Microalgal classes and their signature pigments. 516
In Roy, S. [Ed.] Phytoplankton Pigments: Characterization, Chemotaxonomy and Applications in 517
Oceanography. Cambridge University Press, Cambridge, pp. 3–77.
518
519
Johnson, M.D. 2011. Acquired phototrophy in ciliates: A review of cellular interactions and 520
structural adaptations. J. Eukaryot. Microbiol. 58:185–95. 521
522
Johnson, M.D., Oldach, D., Delwiche, C.F. & Stoecker, D.K. 2007. Retention of transcriptionally 523
active cryptophyte nuclei by the ciliate Myrionecta rubra. Nature. 445:426–8. 524
24
Johnson, M.D. & Stoecker, D.K. 2005. Role of feeding in growth and photophysiology of 526
Myrionecta rubra. Aquat. Microb. Ecol. 39:303–12.
527
528
Johnson, M.D., Tengs, T., Oldach, D. & Stoecker, D.K. 2006. Sequestration, performance, and 529
functional control of cryptophyte plastids in the ciliate Myrionecta rubra (Ciliophora). J. Phycol. 530
42:1235–46. 531
532
Kim, S., Kang, Y.G., Kim, H.S., Yih, W., Coats, D.W. & Park, M.G. 2008. Growth and grazing 533
responses of the mixotrophic dinoflagellate Dinophysis acuminata as functions of light intensity 534
and prey concentration. Aquat. Microb. Ecol. 51:301–10. 535
536
Kim, M., Drumm, K., Daugbjerg, N. & Hansen, P.J. 2017. Dynamics of sequestered cryptophyte 537
nuclei in Mesodinium rubrum during starvation and refeeding. Front. Microbiol. 8:423 538
539
Kromkamp, J.C. & Forster, R.M. 2003. The use of variable fluorescence measurements in aquatic 540
ecosystems: Differences between multiple and single turnover measuring protocols and suggested 541
terminology. Eur. J. Phycol. 38:103–12. 542
543
Laviale, M. & Neveux, J. 2011. Relationships between pigment ratios and growth irradiance in 11 544
marine phytoplankton species. Mar. Ecol. Prog. Ser. 425:63–77. 545
25 546
Lee, B.I., Kim, S.K., Kim, J.H., Kim, H.S., Kim, J.I., Shin, W., Rho, J.-R. & Yih, W. 2019. 547
Intraspecific variations in macronutrient, amino acid, and fatty acid composition of mass-cultured 548
Teleaulax amphioxeia (Cryptophyceae) strains. Algae. 34:163–75.
549
550
Lindholm, T. 1985. Mesodinium rubrum - a unique photosynthetic ciliate. Adv Aquat. Microb. 8:1– 551
48. 552
553
Lohmann, H. 1908. Untersuchungen zur Feststellung des vollständigen Gehaltes des Meeres an 554
Plankton. In Plankton. Wiss. Meeresunters. Abt. Kiel. N.F. Schmidt & Klaunig, p. 131–370. 555
556
Lundstedt, T., Seifert, E., Abramo, L., Thelin, B., Nyström, Å., Pettersen, J. & Bergman, R. 1998. 557
Experimental design and optimization. Chemom. Intell. Lab. Syst. 42:3–40. 558
559
Marchetti, J., Bougaran, G., Le Dean, L., Mégrier, C., Lukomska, E., Kaas, R., Olivo, E., Baron, 560
R., Robert, R. & Cadoret, J.P. 2012. Optimizing conditions for the continuous culture of Isochrysis 561
affinis galbana relevant to commercial hatcheries. Aquaculture. 326–329:106–15.
562
563
Marshall, W. & Laybourn-Parry, J. 2002. The balance between photosynthesis and grazing in 564
Antarctic mixotrophic cryptophytes during summer. Freshw. Biol. 47:2060–70. 565
26 566
Moeller, H. V, Johnson, M.D. & Falkowski, P.G. 2011. Photoacclimation in the phototrophic 567
marine ciliate Mesodinium Rubrum (Ciliophora). J. Phycol. 47:324–32. 568
569
Nagai, S., Suzuki, T., Nishikawa, T. & Kamiyama, T. 2011. Differences in the production and 570
excretion kinetics of okadaic acid, dinophysistoxin-1, and pectenotoxin-2 between cultures of 571
Dinophysis acuminata and Dinophysis fortii isolated from western Japan. J. Phycol. 47:1326–37.
572
573
Ojala, A. 1993. Effects of temperature and irradiance on the growth of two freshwater 574
photosynthetic Cryptophytes. J. Phycol. 29:278–84. 575
576
Orr, J.C., Fabry, V.J., Aumont, O., Bopp, L., Doney, S.C., Feely, R.A., Gnanadesikan, A., Gruber, 577
N., Ishida, A., Joos, F., Key, R.M., Lindsay, K., Maier-Reimer, E., Matear, R., Monfray, P., 578
Mouchet, A., Najjar, R.G., Plattner, G.-K., Rodgers, K.B., Sabine, C.L., Sarmiento, J.L., Schlitzer, 579
R., Slater, R.D., Totterdell, I.J., Weirig, M.-F., Yamanaka, Y. & Yool, A. 2005. Anthropogenic 580
ocean acidification over the twenty-first century and its impact on calcifying organisms. Nature. 581
437:681–6. 582
583
Park, M.G., Kim, S., Kim, H.S., Myung, G., Yi, G.K. & Yih, W. 2006. First successful culture of 584
the marine dinoflagellate Dinophysis acuminata. Aquat. Microb. Ecol. 45:101–6. 585
27
Peltomaa, E. & Johnson, M.D. 2017. Mesodinium rubrum exhibits genus-level but not species-587
level cryptophyte prey selection. Aquat. Microb. Ecol. 78:147–59. 588
589
Peltomaa, E., Johnson, M.D. & Taipale, S.J. 2018. Marine cryptophytes are great sources of EPA 590
and DHA. Mar. Drugs. 16:1–11. 591
592
Peterson, T.D., Golda, R.L., Garcia, M.L., Li, B., Maier, M.A., Needoba, J.A. & Zuber, P. 2013. 593
Associations between Mesodinium rubrum and cryptophyte algae in the Columbia River estuary. 594
Aquat. Microb. Ecol. 68:117–30.
595
596
Ras, J., Uitz, J. & Claustre, H. 2008. Spatial variability of phytoplankton pigment distributions in 597
the Subtropical South Pacific Ocean: comparison between in situ and modelled data. 598
Biogeosciences. 5:353–69.
599
600
Rial, P., Garrido, J.L., Jaén, D. & Rodríguez, F. 2013. Pigment composition in three Dinophysis 601
species (Dinophyceae) and the associated cultures of Mesodinium rubrum and Teleaulax 602
amphioxeia. J. Plankton Res. 35:433–7.
603
604
Roy, S., Llewellyn, C.A., Egeland, E.S. & Johsen, G. 2011. Phytoplankton pigments: 605
characterization, chemotaxonomy and applications in oceanography. Cambridge University Press,
606
New York. 890 pp. 607
28 608
Schlüter, L., Møhlenberg, F., Havskum, H. & Larsen, S. 2000. The use of phytoplankton pigments 609
for identifying and quantifying phytoplankton groups in coastal areas: Testing the influence of light 610
and nutrients on pigment/chlorophyll a ratios. Mar. Ecol. Prog. Ser. 192:49–63. 611
612
Schreiber, U., Schliwa, U. & Bilger, W. 1986. Continuous recording of photochemical and non-613
photochemical chlorophyll fluorescence quenching with a new type of modulation fluorometer. 614
Photosynth. Res. 10:51–62.
615
616
Smith, J.L., Tong, M., Kulis, D. & Anderson, D.M. 2018. Effect of ciliate strain, size, and 617
nutritional content on the growth and toxicity of mixotrophic Dinophysis acuminata. Harmful 618
Algae. 78:95–105.
619
620
Smith, M. & Hansen, P.J. 2007. Interaction between Mesodinium rubrum and its prey: Importance 621
of prey concentration, irradiance and pH. Mar. Ecol. Prog. Ser. 338:61–70. 622
623
Tong, M., Kulis, D.M., Fux, E., Smith, J.L. & Hess, P. 2011. The effects of growth phase and light 624
intensity on toxin production by Dinophysis acuminata from the northeastern United States. 625
Harmful Algae. 10:254–64.
626
29
Wells, M.L., Trainer, V.L., Smayda, T.J., Karlson, B.S.O., Trick, C.G., Kudela, R.M., Ishikawa, 628
A., Bernard, S., Wulff, A., Anderson, D.M. & Cochlan, W.P. 2015. Harmful algal blooms and 629
climate change: Learning from the past and present to forecast the future. Harmful Algae. 49:68– 630
93. 631
632
Wirth, C., Limberger, R. & Weisse, T. 2019. Temperature × light interaction and tolerance of high 633
water temperature in the planktonic freshwater flagellates Cryptomonas (Cryptophyceae) and 634
Dinobryon (Chrysophyceae). J. Phycol. 55:404–14.
635
636
Wisecaver, J.H. & Hackett, J.D. 2010. Transcriptome analysis reveals nuclear-encoded proteins 637
for the maintenance of temporary plastids in the dinoflagellate Dinophysis acuminata. BMC 638
Genomics. 11:366.
639
640
Wood, M.A., Everroad, B.R.C. & Wingard, C.L.M. 2005. Measuring growth rates in microalgal 641
cultures. In Andersen, R. A. [Ed.] Algal Culturing Techniques. Elsevier A. Amsterdam, pp. 269– 642
85. 643
644
Woźniak, B., Dera, J., Ficek, D., Ostrowska, M. & Majchrowski, R. 2002. Dependence of the 645
photosynthesis quantum yield in oceans on environmental factors. Oceanologia. 44:439–59. 646
30
Yih, W., Hyung, S.K., Hae, J.J., Myung, G. & Young, G.K. 2004. Ingestion of cryptophyte cells 648
by the marine photosynthetic ciliate Mesodinium rubrum. Aquat. Microb. Ecol. 36:165–70. 649
650
Y.D.,Yoo, Y., Seong, K.A., Jeong, H.J., Yih, W., Rho, J.-R., Nam, S.W. & Kim, H.S. 2017. 651
Mixotrophy in the marine red-tide cryptophyte Teleaulax amphioxeia and ingestion and grazing 652
impact of cryptophytes on natural populations of bacteria in Korean coastal waters. Harmful Algae. 653
68:105–17. 654
655
Zapata, M., Rodríguez, F. & Garrido, J.L. 2000. Separation of chlorophylls and carotenoids from 656
marine phytoplankton: A new HPLC method using a reversed phase C8 column and pyridine-657
containing mobile phases. Mar. Ecol. Prog. Ser. 195:29–45. 658
659
660
Captions 661
Table 1: Factor levels in the factorial design experiment, where α is the axial distance between star 662
points and the center of the experimental domain 663
664
Table 2: Comparison between observed values of maximum growth rate (µmax, d-1), maximum 665
quantum yield of the photosystem 2 (Fv/Fm), total chlorophyll a (TChl a, pg · cell-1), chlorophyll c
666
(Chl c, pg · cell-1) and total carotenoids (TCarotenoids, pg · cell-1) of T. amphioxeia acclimated to 667
31
low light (LL) and high light (HL) conditions, and modeled values (marked with th) according to
668
the factorial design experiment. Values are expressed as mean ± SD 669
670
Table 3: Comparison between maximum growth rate (µmax, d-1), maximum cellular
671
concentration (cells · mL-1), maximum quantum yield of the photosystem 2 (Fv/Fm), chlorophyll a
672
total (TChl a, pg · cell-1), chlorophyll c (Chl c, pg · cell-1) and carotenoids total (TCarotenoids, pg 673
· cell-1) of M. rubrum fed at different prey: predator ratios; high fed and low fed of T. amphioxeia 674
itself acclimated to low light (LL) and high light (HL) conditions, and M. rubrum and T. 675
amphioxeia controls. Values are expressed as ± SD. No significant differences were found when
676
LL and HL feeding were compared two by two among each nutrition ratio 677
678
Figure 1: (A) Standard Pareto chart the model of the maximum growth rate. Linear and quadratic 679
effects of factors on growth are represented by single or double parameters, respectively. (B) 680
Direct effect of T, pH and I on growth rate of T. amphioxeia. (C) Interaction plots of growth rate; 681
+ and - correspond to the maximum and minimum values of the second factor. (D) Surface plot 682
of the modeled growth rate. T = temperature (°C) and I = irradiance (µmol photons · m-2 · s-1).
683
Significant effects are marked with an asterisk 684
685
Table S1: Culture conditions of strains used in this study 686
a Cultures were subjected to light in the PAR domain during a circadian cycle 12 h: 12 h (light:
687
dark) 688
32 689
Table S2: Regression coefficients for the models of maximum growth rate (µmax th), maximum
690
quantum yield of the photosystem II (Fv/Fm th), total chlorophyll a (TChl a th) and chlorophyll c
691
(Chl c th), where β0 is the model error, 1 is for temperature, 2 for pH and 3 for irradiance
692
693
Table S3: Maximum growth rate (µmax), maximum quantum yield of the photosystem II (Fv/Fm),
694
total chlorophyll a (TChl a), chlorophyll c (Chl c th) and total carotenoids (TCarotenoids) for the
695
different conditions in the factorial design experiment 696
697
Figure S1: Standard Pareto charts for (A) the model of maximum quantum yield of the 698
photosystem II, (B) total chlorophyll a and (C) chlorophyll c. Linear and quadratic effects of 699
factors on growth are represented by single or double parameters, respectively. T = temperature 700
(°C) and I = irradiance (µmol photons · m-2 · s-1) 701
702
Appendix S1: The general quadratic model fitted to the data for theoretical maximum growth rate 703 (µmaxth) 704 705 706 707 708 709 710
33 Tables & figures
711
Table 1: Factor levels in the factorial design experiment, where α is the axial distance between star 712
points and the center of the experimental domain 713 714 715 716 717 718 719 720 721 722 723 724 725 726 727 728 729 730 731 732 Factors - α - 1 0 + 1 + α Temperature (°C) 13.0 15.4 19.0 22.6 25.0 pH 6.5 6.9 7.6 8.3 8.6
34
Table 2: Comparison between observed values of maximum growth rate (µmax, d-1), maximum
733
quantum yield of the photosystem 2 (Fv/Fm), total chlorophyll a (TChl a, pg · cell-1), chlorophyll c
734
(Chl c, pg · cell-1) and total carotenoids (TCarotenoids, pg · cell-1) of T. amphioxeia acclimated to 735
low light (LL) and high light (HL) conditions, and modeled values (marked with th) according to
736
the factorial design experiment. Values are expressed as mean ± SD 737 738 739 740 741 742 743 744 745 746 747 748 749 750 751 752 753 754 Acclimation conditions LL HL Generations 27 30 µmax 0.77 ± 0.10 0.85 ± 0.09 µmax th 0.44 0.88 Fv/Fm 0.68 ± 0.01 0.61 ± 0.02 Fv/Fm th 0.71 0.65 TChl a 0.41 ± 0.03 0.24 ± 0.01 TChl a th 0.78 0.24 Chl c 0.05 ± 0.01 0.03 ± 0.001 Chl cth 0.12 0.03 TCarotenoids 0.13 ± 0.01 0.10 ± 0.004
35
Table 3: Comparison between maximum growth rate (µmax, d-1), maximum cellular
755
concentration (cells · mL-1), maximum quantum yield of the photosystem 2 (Fv/Fm), chlorophyll a
756
total (TChl a, pg · cell-1), chlorophyll c (Chl c, pg · cell-1) and carotenoids total (TCarotenoids, pg 757
· cell-1) of M. rubrum fed at different prey: predator ratios; high fed and low fed of T. amphioxeia 758
itself acclimated to low light (LL) and high light (HL) conditions, and M. rubrum and T. 759
amphioxeia controls. Values are expressed as ± SD. No significant differences were found when
760
LL and HL feeding were compared two by two among each nutrition ratio. 761 762 Nutrition conditions High fed Low fed Control M. rubrum not fed Control T. amphioxeia LL HL LL HL LL HL µmax 0.31 ± 0.04 0.29 ± 0.03 0.20 ± 0.03 0.20 ± 0.04 - 0.76 ± 0.02 0.70 ± 0.01 Maximum concentration (× 103) 19 ± 1.5 18 ± 1.8 7.6 ± 0.78 7.4 ± 0.42 5.8 ± 0.15 452 ± 10.1 407 ± 17.8 Fv/Fm 0.69 ± 0.01 0.72 ± 0.02 0.68 ± 0.01 0.68 ± 0.01 0.58 ± 0.02 0.68 ± 0.02 0.69 ± 0.01 TChl a 3.1 ± 0.45 3 ± 0.5 1.4 ± 0.05 1.4 ± 0.08 1.1 ± 1.2 0.26 ± 0.004 0.26 ± 0.003 Chl c 0.38 ± 0.05 0.37 ± 0.06 0.16 ± 0.01 0.16 ± 0.02 0.12 ± 0.02 0.04 ± 0.001 0.04 ± 0.001 TCarotenoids 1.1 ± 0.17 1.1 ± 0.18 0.57 ± 0.02 0.58 ± 0.04 0.51 ± 0.10 0.10 ± 0.002 0.10 ± 0.002 763