On the Evolution and Physiology of Cable Bacteria
Kasper U. Kjeldsen, Lars Schreiber, Casper A. Thorup, Thomas Boesen, Jesper T. Bjerg, Tingting Yang, Morten S. Dueholm, Steffen Larsen, Nils Risgaard-Petersen, Marta Nierychlo, Markus Schmid, Andreas Bøggild, Jack van de Vossenberg, Jeanine S.
Geelhoed, Filip J. R. Meysman, Michael Wagner, Per H. Nielsen, Lars Peter Nielsen, and Andreas Schramm
Supporting Information
Methods
Filament extraction, whole genome amplification, and sequencing of marine cable bacteria. Single filaments were extracted with custom-made glass hooks from Aarhus Bay sediment enriched for cable bacteria as described previously (1). Individual filaments were transferred into PCR tubes containing 5 μL of filter- (0.22 µm) and UV-sterilized TE buffer (10 mM Tris-HCl, 1 mM EDTA, pH 7.5). Four microliters of PCR water were added and samples were stored at -80°C.
Filaments were lysed by ultrasonic bead-beating: glass beads (diameter, 0.1 mm; PowerLyzer PowerSoil DNA Isolation kit, Qiagen) were heat-sterilized at 220°C for 12 h and subsequently suspended in one volume of filter- and UV-sterilized TE buffer. Approximately 2 µL of glass bead suspension were added to the filament sample. The sample was sonicated on ice (Sonoplus HD2070, Bandelin; sonication parameters: 3 min, continuous mode, amplitude setting: 30% ≈ 21 W). Genomes were amplified using the GenomePlex® Single Cell Whole Genome Amplification Kit (Sigma–Aldrich). Sequencing of the amplified genomic material was performed on an Ion Torrent PGM™ sequencer (Life Technologies) using 316v1 chips and 200 or 400 bp chemistry. Quality trimming and adapter clipping of reads was done using prinseq-lite.pl (2) and Seqclean (https://sourceforge.net/projects/seqclean/), respectively.
Reconstruction of a high-quality draft genome of Candidatus Electrothrix aarhusiensis MCF. The genome of Ca. E. aarhusiensis MCF was reconstructed from two filaments that shared identical 16S rRNA gene sequences and ITS regions. Sequences from both filaments were assembled with gsAssembler version 2.6 (Roche 454 Life Sciences) and 10 different settings: minimum overlap settings of 50 or 100 bp, respectively, and minimum sequence identity values of 96-100% with 1% steps. In parallel, reads were assembled using the CLC Genomics Workbench version 5.5.1 (CLCbio) with standard settings for Ion Torrent reads (automatic word and bubble size) and SPAdes version 2.2.1 (3) with the settings: -only-assembler -k 21,33,55. All assemblies were performed on separate data sets for both filaments as well as on a combined data set. In addition to the full-sized assemblies, 10 assemblies of reduced complexity were generated, where 500,000 randomly-selected reads from the combined data set where assembled using gsAssembler (100 bp minimum overlap; 98% minimum sequence identity). In total, 46 assemblies were generated. All assembled sequence data were combined and then separated into contigs longer than 5000 bp (long contigs data set), and those between 1,000 and 5,000 bp (short contigs data set) in length. Contigs shorter than 1,000 bp were excluded from further analysis. As sequence data from both filaments contained contaminations from other bacteria presumably attached to the cable bacteria filaments, the genome of Ca. E. aarhusiensis MCF was reconstructed in a multi-step binning approach designed to eliminate contamination from the assembly:
1) Seed identification and extension: Two contigs (8 and 9.8 kbp long) that with high certainty originated from cable bacteria (anchor contigs) were identified in a gsAssembler assembly (98%
sequence identity; 50 bp minimum overlap). The contigs contained phylogenetic marker genes (among others dnaG, rplC, rplD, and rplE), which showed a high sequence similarity to genes of Desulfobulbus propionicus – the closest fully sequenced relative of cable bacteria. Contigs featuring regions with a sequence identity of >97% over a stretch of more than 200 bp to either of the two anchor contigs were extracted from the long contig data set using BLASTn (4) and BioPerl (5). These extracted contigs and the anchor contigs were merged and manually curated using Sequencher version 5.0.1 (Genecodes). This extended the anchor contigs to lengths of 39 kbp and 54 kbp, respectively.
2) K-mer binning: Additional contigs of cable bacteria were identified using k-mer based binning (6): tetra- and tri-nucleotide Z-scores as well as GC contents of the 39 kbp and 54 kbp anchor contigs and contigs from the long contig dataset were determined using a custom-made Perl script. Contigs were added to the cable bacteria bin, if their tetra-nucleotide Z-score correlation coefficient (Rtetra) with one of the anchor contigs exceeded 0.9. Contigs not meeting this threshold,
but exceeding a lower threshold of RTetra>0.7 and a tri-nucleotide Z-score correlation coefficient
of RTri>0.85, and whose GC content differed by no more than 2% from one of the anchor contigs
were also added to the bin. All binned contigs were assembled together with the anchor contigs using Sequencher (Dirty Data Algorithm; 98% minimum sequence identity; 100 bp minimum overlap).
3) Undirected contig extension: Contigs showing a sequence identity of >97% over a stretch of at least 100 bp to one of the bin contigs were extracted from long contig data set using blastn and custom Perl scripts. The extracted contigs were merged with the binned contigs and subsequently manually curated using Sequencher. This step was repeated four times after which no further contigs of the long contig data set met the extraction criteria.
4) Extension of contigs ends using short contig data set: Contigs showing a sequence identity of >97% over a stretch of at least 100 bp to the terminal 500 bp of a binned contig were extracted from the short contig data set using blastn and custom Perl scripts. The extracted contigs were merged with the binned contigs and subsequently manually curated using Sequencher. This step was repeated 8 times, after which no significant increase of the overall assembly size could be achieved.
5) Reassembly: The iterative extension of the target genome contigs may result in accumulation of assembly errors and redundancy in the data set. In order to correct for this, sequencing reads were mapped onto the contigs contained in the final bin using bowtie2 (7) with the parameters: -very-sensitive-local –score-min L,0,1.7. The score-min parameters ensured that only reads showing a sequence identity of at least 95% to binned contigs were mapped. All correctly mapped reads were extracted from the read data set. The extracted reads were error corrected using SPAdes version 2.3 (single cell mode, k-mer values 21, 33, 55; (3)) and subsequently assembled using gsAssembler (100 bp minimum overlap; 98% minimum sequence identity). The resulting 211 contigs, representing 3.7 Mbp of sequence information, represented version 1 of the Ca. E. aarhusiensis MCF genome.
6) Annotation based stitching of contigs: The Ca. E. aarhusiensis MCF genome was annotated using the IMG-ER pipeline (8). Truncated genes at contig termini were identified manually. The closest related homologs (amino acid similarity >40%) of the truncated genes were retrieved from GenBank (9) using blastp (4) If two truncated genes showed a high similarity (amino acid-based) to the same retrieved GenBank sequence, the two truncated genes were aligned to the reference sequence using CLUSTALW (10). If the alignment indicated that both truncated genes were part of the same gene, the corresponding contigs were tentatively stitched together. The gap between the contigs was estimated based on the alignment to the reference sequence. Sequencing reads were aligned to the stitched contigs using cross-match (11). The resulting alignments were manually inspected and used to fill gaps between stitched contigs using Consed version 23.0 (11).
7) Gap closure using Sanger sequencing: For cases where read mapping could not confirm the tentative contig stitching, primer pairs were designed to bridge stitched contig ends using the CLC Genomics Workbench version 5.5.1. The resulting PCR products were directly sequenced by Sanger sequencing (Macrogen).
8) rRNA operon ambiguity resolution: The ITS regions between 16S rRNA and 23S rRNA genes were identified by PCR amplification and sequencing of fragments spanning this region from the filament genome amplification products. This was done with the 16S rRNA gene primers DSBB+1297F (reverse-complement of DSBB+1297R (12)) and DBB1237F (reverse complement of DBB1237 (13,14) in combination with the 23S rRNA gene primers ITSReub_DBB (5’-GCA TCC GCC GTC AGC C-3’; this study) and 126R_DBB (5’-CCG GGT TTC CCC ATT AGG-3’; this study). PCR reaction mixtures of 50 µL volume contained: 0.5 µM of each primer, 0.6 g L-1
bovine serum albumin, 1x HotStar Taq Master Mix (Qiagen) and 1–10 ng of template DNA. Thermal cycling included: an initial denaturing step at 95°C for 15 min; 30 cycles of denaturation at 94°C for 30 s, annealing at 55°C for 1 min, elongation at 72°C for 3 min and a final elongation step at 72°C for 10 min. The resulting PCR products were purified (GenElute PCR CleanUp kit, Sigma), cloned (TOPO TA cloning Kit for sequencing, Invitrogen), and finally Sanger sequenced (GATC-biotech). Genomic regions adjacent to the 16S and 23S rRNA genes were identified by thermal asymmetric interlaced (TAIL)-PCR (15) For regions adjacent to the 16S rRNA gene, the primers SRB385 (16), DSBAC355R_mod (5’-CCA TTG CGC AAT ATT CCT CAC TG-3’ [modified reverse complement of DSBAC355 (17)]), and DBB121R_mod (5’-RGA CAG GTT ATC TAC GCG TTA CTC-3’ [modified reverse complement of DBB121 (14) were used sequentially. For regions adjacent to the 23S rRNA gene, the primers 2490f_long (5’-GTT TGG CAC CTC GAT GTC GGC-3’ [modified reverse complement of 2490r (18)]), DSB2600f (5’-ACA GTT TGG TCC TTA TCT GTT GCG-3’ [this study]), and DSB2628f (5’-GCA GGA TAT TTG AGG AGA TCT TTC C-3’ [this study]) were sequentially used. The resulting PCR products were purified, and directly Sanger sequenced (Macrogen). The obtained Sanger reads of ITS regions of regions adjacent to rRNA operons were merged with the genome using Sequencher. The resulting assembly represented version 2 of the Ca. E. aarhusiensis MCF genome.
9) Binning based on taxonomic classification: All contigs of the long and short contig data sets were taxonomically classified using MetaWatt 3.1.1 (19) based on best DIAMOND BLASTx hits (20) to the MetaWatt reference genome database supplemented with all available Desulfobulbaceae genomes (Table S2).
10) Merging of results of taxonomic binning with previous genome: Contigs classified as Desulfobulbaceae genome fragments were extracted and matched against the genome assembly using Sequencher (Dirty Data Algorithm; 98% minimum sequence identity; 50 bp minimum overlap). The resulting assembly represented version 3 of the Ca. E. aarhusiensis MCF genome. To preserve the existing IMG annotation (step 6), annotations from version 1 of the genome were transferred to version 3 using RATT (21). Already annotated regions (i.e. regions already present in genome version 1) were masked using a custom Perl script. Open reading frames (ORFs) were predicted in the non-masked regions using Prodigal 2.6.1 (22) as implemented in the PROKKA annotation pipeline (23), and added to the transferred annotation.
11) Final consolidation: For the final version of the MCF genome (Table S1), all contigs shorter than 1,000 bp were removed. The remaining contigs of version 3 of the Ca. E. aarhusiensis MCF genome were re-inspected using k-mer based binning in relation to the original anchor contigs (step 2) and using MetaWatt taxonomic binning (step 9). Only contigs either falling into the k-mer-based bin or taxonomically classified as Desulfobulbaceae were retained for the final version of the Ca. E. aarhusiensis MCF draft genome.
Genome reconstructions for Ca. E. communis A1, Ca. E. marina A2, Ca. E. marina A3, and Ca. E. marina A5. Quality- and adapter-trimmed reads were assembled using
gsAssembler version 2.6 with 10 different settings: minimum overlap of 50 or 100 bp, and minimum sequence identity values of 96-100% with 1% steps. In parallel, reads were assembled using SPAdes version 3.5.0 (3) with the settings: -k 21,33,55 -sc. Additionally, a set of 10 low-complexity assemblies was generated, where 500,000 randomly-selected reads from the combined data set where assembled using gsAssembler with a minimum overlap of 100 bp and a minimum sequence identity of 98%. The resulting 21 genome assemblies of a given filament sample were then combined. Contigs shorter than 1,000 bp were excluded from further analysis. Contigs were taxonomically classified using MetaWatt 3.1.1 (19) based on best DIAMOND blastx hits (20) to the MetaWatt reference genome database supplemented with all available Desulfobulbaceae genomes (Table S2). Contigs classified as Desulfobulbaceae were extracted for further processing and formed the initial cable bacteria bins. ORFs were identified using FragGeneScan version 1.19 (24). ORFs putatively coding for ribosomal proteins or enzymes of the canonical sulfate-reduction pathway were identified and extracted using MEGAN version 4.70.4 (25) based on blastp hits to NCBI’s nr database (January 25th, 2015 version). The extracted ORFs were inspected manually for correct annotation. Contigs carrying confirmed ribosomal protein or sulfate-reduction genes originating from Desulfolbulbaceae were used as anchors for k-mer-based binning of additional contigs from the combined assembly data set as done for the genome of Ca. E. aarhusiensis MCF. Contigs with a sequence identity of at least 99% over a stretch of 100 bp to one of the bin contigs were extracted from the combined assembly data set using blastn and a custom Perl script, and added to the cable bacteria bins. Sequencing reads were mapped (96% minimum sequence identity) onto the cable bacteria bins and extracted using BBMap version 34.94 (sourceforge.net/projects/bbmap/). Extracted reads were assembled using SPAdes version 3.5.0 with the settings: -k 21,33,55 -sc. This was followed by a re-assembly using Sequencher with the Dirty Data Algorithm, a minimum sequence identity of 98%, and a minimum overlap of 100 bp. For the final versions of the genomes, all contigs shorter than 1,000 bp were removed. The remaining contigs were re-inspected using k-mer based binning in relation to the original anchor contigs and by using MetaWatt to confirm their taxonomic classification. Only contigs either falling into the k-mer-based bin or taxonomically classified as Desulfobulbaceae were retained for the final draft genome versions (Table S1).
Establishment and metagenomic sequencing of a Ca. Electronema sp. GS enrichment culture. Ca. Electronema sp. GS was enriched by whole core incubations of sediment from a freshwater pond in Vennelystparken, Aarhus, Denmark (56.164796, 10.207805). Repeated transfer of a single cable bacterium filament to autoclaved sediment facilitated the establishment of a stable sediment enrichment culture containing no other cable bacteria than the clonal strain Ca. Electronema sp. GS. This enrichment was used for genomic and proteomic analyses of Ca. Electronema sp. GS. A total of five enrichment cores were sampled in three different ways to obtain cable bacteria biomass: Samples GS1, GS2 and GS5 were obtained from cores on which sterilized sand had been sequentially added on top of the sediment for 7 days, thus forcing the cable bacteria to migrate into the sand due to oxygen limitation. The resulting cable bacteria-enriched sand layer was harvested. Sample GSC consisted of filaments isolated from a core with glass hooks as described previously (26). Sample GSL was obtained collecting cable bacteria that migrated from sediment onto a glass slide as described in Bjerg et al. (27). DNA was extracted using the PowerLyser® DNA Isolation Kit (MoBio Inc.). Libraries for metagenomic sequencing of the extracted DNA were prepared using the Nextera DNA Library Preparation Kit (Illumina), and sequenced using the Illumina MiSeq kit v3. Reads were quality checked using FastQC version 0.11.4 (https://www.bioinformatics.babraham.ac.uk/projects/fastqc/) and trimmed using Trimmomatic v. 0.33 (28).
Genome reconstruction of Ca. Electronema sp. GS. The genome of Ca. Electronema sp. GS was extracted from a metagenome reconstructed from the pooled reads of five metagenomic
sequence libraries (GS1, GS2, GS5, GSC and GSL, see above) using the assembly program IDBA v 1.1.1 (29) with the following parameters: --mink 60 --maxk 120 --min_contig 500. The metagenome was binned using mmGenome v. 0.6.3 (30). Contigs were taxonomically classified using blastp against the NCBI RefSeq Database release 73. Coverage files for the differential coverage analysis were generated by separately mapping the reads from the five samples onto the metagenome using BBMap version 35.82 with a minimum sequence identity threshold of 95 %. Contigs shorter than 5000 bp were excluded from the analysis. A bin classified within the Desulfobulbaceae family was identified as a cable bacterium genome. The Desulfobulbaceae contigs were binned twice in two successive steps to reduce contamination: The coverage files of samples GS1 and GSL were used for an initial lenient binning, followed by a second, more strict binning using the coverage files of samples GS2 and GSC. Reads were re-mapped with a 98 % minimum sequence identity threshold onto the resulting Desulfobulbaceae bin and the mapped reads were re-assembled using SPAdes v. 3.6.2 (3) with settings: -careful -kmer 21,33,55,77,99,127. The resultant assembly was retained for the final draft genome version of Ca. Electronema sp. GS (Table S1).
Estimation of genome completeness and genome annotation. Genome completeness was estimated using CheckM 1.0.7 (31), which tested for the 320 conserved single copy genes (CSCGs) of the order Desulfobacterales. Cable bacteria draft genomes were annotated using the IMG-ER pipeline (8).
Comparative genomics and last common ancestor analysis. Amino acid and nucleotide sequences of protein-coding genes of Desulfobulbaceae (Table S2) and cable bacteria were retrieved from IMG-ER (8). De novo prediction and clustering of protein families, respectively, was performed using the Integrated Toolkit for Exploration of microbial Pan-genomes (ITEP) (32) version 1.1. Initial generation of the ITEP SQL database was done using standard cutoff values for blastp (e-value cutoff: 1E-5) and blastn (e-value cutoff: 1). Genes were clustered based on bidirectional-best blast hits (based on the “maxbit” metric) and using MCL (33) as integrated in ITEP. MCL clustering was performed using an inflation value of 2.0 and a cutoff value of 0.4. Core and pan-genome analyses were performed using R (34) and were based on the presence/absence table of genes families that was generated by ITEP.
Last common ancestor (LCA) analysis of the genes in the Ca. E. aarhusiensis MCF genome was performed using MEGAN version 4.70.4 (25) based on blastp hits to NCBI’s nr database (January 25th, 2015 version). LCA assignment was performed using MEGAN’s standard settings (min support: 5; min score: 50; top percent: 10; win score: 0; min complexity: 0.44).
Phylogenetic analysis. Phylogenetic analysis was based on a set of single copy genes generally conserved within Bacteria (31). Genes not present in the draft genome of Ca. E. aarhusiensis MCF were removed. The resulting set contained 31 CSCGs primarily associated with the bacterial translation machinery (e.g. ribosomal proteins, tRNA synthetases, RNA polymerases) and with the following associated PFAM models: PF00164, PF00177, PF00181, PF00189, PF00203, PF00237, PF00238, PF00252, PF00276, PF00281, PF00297, PF00298, PF00312, PF00318, PF00333, PF00366, PF00380, PF00410, PF00411, PF00466, PF00572, PF00573, PF00623, PF00673, PF00687, PF00831, PF00861, PF01509, PF02978, PF03719, PF03946, PF03947, PF04561, PF04565, PF04997, PF05000, PF11987. The inferred amino acid sequences for each gene from cable bacteria, Desulfobulbaceae reference genomes (Table S2), and two ‘outgroup species’ (Thermodesulfatator indicus DSM15286, IMG taxon ID: 2505119042; Thermodesulfobacterium geofontis OPF15, IMG taxon ID 2506520012) were retrieved using IMG-ER’s Gene Export feature (8). The retrieved sequences were individually aligned per gene using MAFFT (version 7; (35)) with the “E-INS-i” option. The resulting alignments were concatenated yielding a final superalignment with 10,786 amino acid positions. For phylogenetic
analysis, deletions and highly variable regions were masked by using a 30% positional conservatory filter as implemented in the ARB software environment (36). The filter left a total of 9,491 alignment positions. The phylogeny of the Desulfobulbaceae was reconstructed by maximum likelihood analysis using RAxML version 8.2.4 (37) with a Γ model of rate heterogeneity and the JTT protein evolution model. Node stability of the calculated phylogeny was evaluated by 1,000 bootstrap replicates.
Proteome analysis. For protein extraction, 500 µL sediment from the Ca. Electronema sp. GS enrichment culture was mixed with 500 µL of buffer (10 µM Tris-HCl, pH 8.0), and transferred to a 2 mL lysing matrix E tube (MP Biomedicals). Cells in the sample were lysed by bead beating (4x 20s, 6.0 m/s) in a FastPrep-24 instrument (MP Biomedicals). The sample was kept on ice for 2 min between each bead beating to prevent sample heating. Large particulate material was allowed to settle by gravity for 5 min and aliquots of 50 µL of supernatant were transferred to six 2 mL microcentrifuge tubes. The samples were lyophilized, and suspended in pure water or 20, 40, 60, 80 or 100% formic acid, which is known to depolymerize strong polymers such as amyloids (38) and membrane proteins at high concentrations (39). The samples were lyophilized again to remove formic acid and water and subjected to SDS-PAGE using a loading buffer containing 8M urea (40). Samples were then analyzed by label-free quantitative mass-spectrometry as previously described (39) using a Q-Exactive mass spectrometer (Thermo Fisher Scientific) with a nano-high pressure liquid chromatography system (Ultimate3000 UHPLC, Thermo Fisher Scientific). Protein identification and quantification were done by comparison against the annotated Ca. Electronema sp. GS draft genome using the open-source software MaxQuant v1.5.8.3. A custom CDS database based on the Ca. Electronema sp. GS draft genome was used as reference. Besides the standard settings, LFQ was activated in MaxQuant. This included a peptide and protein false discovery rate of 1%. Reversed sequences as decoys and contaminant sequences were added automatically by MaxQuant. The minimum ratio count for LFQ was set to one. The reverse and contaminant sequences were removed from the MaxQuant output, and unique identifiers (gene names or id numbers) were created for each protein. Detailed parameters are listed in the file ‘parameters.txt’ under Project PXD012775 in the EMBL-EBI database, where the mass spectrometry proteomics data have been deposited at the ProteomeXchange Consortium (http://www.proteomexchange.org) via the PRIDE partner repository (41).
PCR validation of the cytochrome-hemoglobin fusion protein. An approx. 1,560 bp-long gene fragment encoding the cable bacteria-unique cytochrome-hemoglobin domain fusion protein was PCR amplified from DNA extracted from Aarhus Bay sediment enriched with cable bacteria. Primers F-5'-CAGTGTGAAGGBTGTCATAC-3' and R- 5'-CCTGCTGAAYAAGCTCGTC-3' were custom designed to target positions 301-320 and 1,849-1,867 of the 1,914 bp-long gene H206_00640 of Ca. E. aarhusiensis MCF, and thus span both cytochrome and globin domains. PCR reaction mixtures of 25 µL volume included 12.5 µL Ex Taq HS polymerase (Takara), 2.5 µL 10x Ex Taq buffer (Takara), 0.5 µL BSA (10 mg mL-1), 0.5 µL of each primer (10 pmol µL -1), and 1 µL undiluted DNA extract as template. Thermal cycling consisted of 95oC for 3 min, and
35 cycles of 95°C for 30 sec, 54°C for 40 sec, 72°C for 90 sec. The cycling was completed by an elongation step of 72°C for 10 min. PCR products were evaluated by agarose gel electrophoresis, purified (GenElute PCR Clean-Up Kit, Sigma) and cloned using the pGEM-T Easy vector system (Promega). Eleven clones representing the target gene were Sanger sequenced on both strands with M13 vector primers (Macrogen).
MAR-FISH. Marine sediment was collected from Aarhus Bay (Marselisborg Marina, Denmark; 56.138377, 10.215787, water depth 4 m) using a Kajak corer (KC Denmark A/S). The upper 10 cm of the sediment were discarded, and the underlying sulfidic sediment was passed through a sieve (pore size: 0.5 mm) to remove macrofauna before homogenization and incubation in small
glass chambers. These chambers were constructed using two microscopy slides (1 mm thick; 75 mm long; 25 mm wide) separated by two pieces of glass slide (1 mm thick; 75 mm long; 10 mm wide), leaving a 5 mm wide hollow space at the center. All glass-glass surfaces were lubricated with silicone fat to minimize oxygen penetration by convection through the junctions and to help the chamber stick together. The chamber was held together using plastic tape. The bottom of the chamber was sealed using a butyl rubber stopper in order to prevent oxygen penetration from below. The chamber was filled with sediment and incubated in the dark with overlying air-saturated Aarhus Bay seawater (25 ‰) at 15°C.
After two weeks the sediment contained a fully developed population of cable bacteria as evaluated by microsensor measurements, and 14C-labelled bicarbonate was added to a final
concentration of 10 μCi mL-1: labeled substrate with a concentration of 100 μCi mL-1 was added
to the sediment in three tracks 2-3 mm apart using a needle syringe. Control samples were killed by adding 2% formaldehyde (final conc.) together with the labeled substrate. After 8 h of incubation the chambers were dismantled and sediment samples were fixed in 4 % formaldehyde for exactly 3 h in order to avoid fixation biases (42). The fixed samples were washed with glycine buffer (pH 3) to remove excess bicarbonate followed by two washes with phosphate-buffered saline (PBS; 130 mM NaCl, 10 mM NaPi, pH 7.4). Samples were stored in 50% ethanol in PBS
at 5°C until further processing.
The fixed and washed sediment samples containing cable bacteria filaments were transferred to gelatin coated coverslips. In addition, single cable bacterial filaments were picked from sediment samples and negative controls using a hand-made glass hook, transferred to a water droplet on a gelatin-coated cover slip, and left for air-drying. FISH identification was performed as described previously (1). Microscopic analysis was performed using an Axioskop epifluorescence microscope (Carl Zeiss). MAR procedures and quantification of silver grains was done as described previously (42, 43). Image overlays were done using ImageJ (44).
Analysis of isoelectric points and of pI bias values. Protein-coding genes of cable bacteria, alkaliphilic Desulfobulbaceae (optimal growth at pH ≥ 9.5; Desulfurivibrio alkaliphilus AHT2, Deltaproteobacterium MLMS-1) and neutrophilic Desulfobulbaceae (optimal growth at pH 6.7-7.5; Desulfobulbus elongatus, Desulfobulbus japonicus, Desulfobulbus mediterraneus, Desulfobulbus propionicus, Desulfocapsa sulfexigens, Desulfocapsa thiozymogenes, Desulfotalea psychrophila, Desulfofustis glycolicus, Desulfopila aestuarii, Desulforhopalus singaporensis) were retrieved from IMG-ER (Table S2) (8). The isoelectric points (pI) of the retrieved genes were calculated iteratively with the bisection method (http://isoelectric.ovh.org) and a custom Perl script. For each species the pI bias (45) was calculated for periplasm-exposed proteins, which were identified by the presence of signal peptides or transmembrane helices as predicted by the IMG-ER pipeline (8). The “pI bias” describes the asymmetry of the bimodal distribution of pI, and ranges from -100% (all proteins have an acidic pI) to 100% (all proteins have a basic pI) (45).
Bioorthogonal Noncanonical Amino Acid Tagging (BONCAT). Sediment was collected from Aarhus Bay (Løgten beach, 56.288472, 10.382986), Denmark. The upper 5 cm of the sediment was discarded to minimize bioturbation; remaining sediment was mixed and distributed into glass beakers and incubated for 19 days in the dark in an aquarium circulating seawater from the sampling site at 15 °C to enrich for cable bacteria. Before initiating the BONCAT experiment, oxygen and sulfide porewater concentration profiles were measured by microsensors (1). The profiles indicated the successful enrichment of cable bacteria, as oxygen penetrated ~ 3 mm in the sediment, while sulfide began to accumulate only at ~ 15 mm depth.
For the BONCAT experiment, five transparent plastic straws (5.5 cm in length, 7 mm in diameter) were inserted into the sediment of a single beaker. The top of these mini cores was just below the surface water layer. Following the procedure of Hatzenpichler et al. (46), 17 µL of 100 mM
L-homopropargylglycine (HPG) was mixed into 200 µL sterile-filtered (0.2 µm pore size) seawater and 50 µL of the diluted HPG solution was gently injected into 4 of the mini cores from the bottom to the top using a Hamilton syringe fitted with a thin needle. The remaining core served as non-HPG control. The final concentration of non-HPG reached ~ 500 µM in each mini core. After injection, the beaker was sealed with parafilm and incubated for 19 hours at 15 °C. After incubation, O2 and
H2S porewater concentrations were profiled again. The oxic layer extended from 0-3 mm, the
suboxic sulfide-free layer from 3-12 mm, and the sulfidic layer started at 12 mm depth. The mini cores were removed and sectioned accordingly into oxic, suboxic and sulfidic zones.
Cable bacteria filaments were picked by custom-made thin glass hooks (1) from oxic, suboxic and sulfidic layers of all mini cores, and were transferred to drops of sterile seawater on clean glass slides. Microscopic examination showed that the filaments were motile at this point and thus metabolically active. Cable bacteria filaments were immobilized at 45°C for 30 min, fixed in formaldehyde (3.7%) for 5 hours, and after three consecutive washes in PBS dehydrated in an ethanol series (50%, 80% and 96% ethanol; 3 min each).
The cells incorporating HPG were fluorescently labeled by click chemistry as described previously (46). In short, Cu(I) click solution was prepared by mixing and incubating 5 µL 20 mM CuSO4, 10 µL 50 mM THPTA (Sigma) solution, and 1.2 µL 1 mM FAM-azide dye in the
dark for 3 min at room temperature. This dye premix was gently mixed with a solution consisting of 50 µL 100 mM sodium ascorbate, 50 µL 100 mM aminoguanidine hydrochloride and 884 µL PBS. The dehydrated filaments on the microscope slides were covered in aliquots (60 µL) of the resultant click solution and incubated in the dark at 100% humidity for 30 min. The slides were washed 3 times with PBS, air-dried and stained with DAPI (1 mg mL-1) for 5 min in the dark,
then washed and air dried anew. Finally, FISH was performed as described previously (1), and slides were observed on an Axiovert 200M epifluorescence microscope (Carl Zeiss).
Transmission electron microscopy (TEM), scanning electron microscopy (SEM) and energy-dispersive X-ray spectroscopy (EDX). For electron microscopy analyses, cable bacteria were collected with custom-made glass hooks, transferred onto TEM/SEM copper 220-230 mesh grids, and air dried at room temperature. TEM was performed on a Tecnai Spirit microscope (120kV). SEM was performed on a NanoSEM (FEI, Nova 600 NanoSEM) operated in low-vacuum and low-voltage (3 kV) mode for acquisition of charge contrast imaging data. EDX analysis of selected areas identified by SEM was performed with an integrated EDX with 20 keV beam energy. For SEM-EDX, gold-coated TEM grids were mounted on an aluminum stage or a silicon chip using carbon tape. The element mapping signals were collected for ~ 5 hours.
SI Discussion
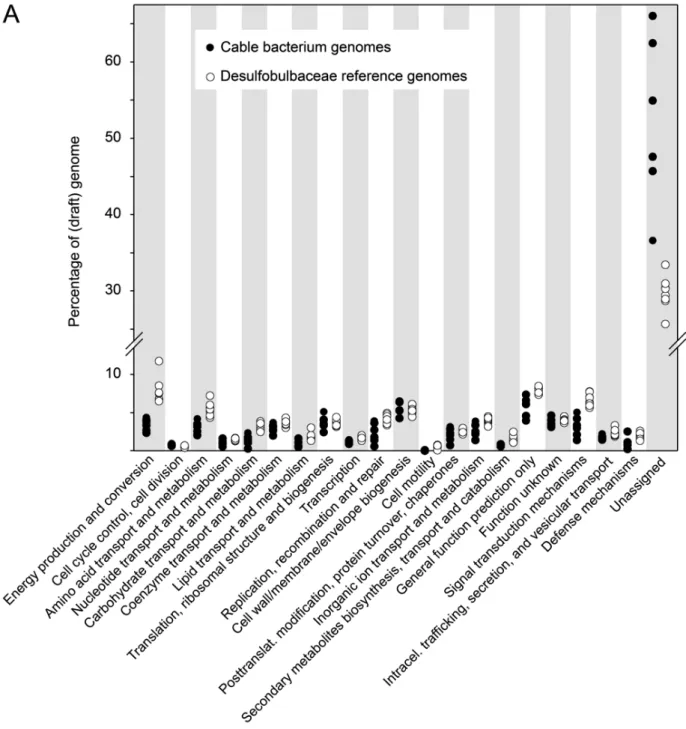
COG-based profiling of gene function in cable bacteria genomes. A large fraction (37-66%) of the coding regions of the cable bacteria genomes compared to other Desulfobulbaceae (median: 31%) could not be assigned to any COG. Correspondingly, most COG functional categories appear underrepresented in cable bacteria (Fig. S1). However, the categories “energy production and conversion” (category C), “amino acid transport and metabolism” (category E), “carbohydrate transport and metabolism” (category G) and “signal transduction mechanisms” (category T) show particular low representation (Fig. S1A). This likely reflects a limited organotrophic catabolic potential as discussed in the main text. The underrepresentation of signal transduction mechanisms is not clear; notably cable bacteria generally harbor the same COG profile within this category as other Desulfobulbaceae but with fewer occurrences of the individual COGs (see also Fig. S11).
COG functional gene categories seemingly enriched in the cable bacteria genomes compared to other members of the family Desulfobulbaceae include the categories M (cell wall-membrane-envelope biogenesis), J (translation, ribosomal structure and biogenesis), O (posttranslational modification, protein turnover, chaperones), V (defense mechanisms), and D (cell cycle control, cell division, chromosome partitioning) (Fig. S1A). The number of genes belonging to the categories M, J, O in cable bacteria genomes resemble those in other Desulfobulbaceae, and in accordance many genes in these categories encode essential cell functions. In contrast, overrepresentation of categories V and D may be an ecological adaptation (see discussion on virus attack below).
Sulfide oxidation. Physiological studies of various deltaproteobacterial sulfate reducers, including Desulfobulbus species, suggest that some sulfate-reducing bacteria can oxidize sulfide aerobically via a two-step process by which sulfide is first oxidized to elemental sulfur which is then disproportionated to sulfide and sulfate (47). In cable bacteria (see below), and in Desulfurivibrio alkaliphilus (48), a sulfide:quinone oxidoreductase (SQR) is the candidate enzyme to catalyse the intial oxidation of sulfide. However, we were unable to identify genes encoding SQR in the genomes of characterized sulfide-oxidizing members of the genus Desulfobulbus (Table S2); therefore, multiple mechanisms for sulfide oxidation may exist within the family Desulfobulbaceae. The genomes of Ca. Electronema sp. GS and Ca. E. aarhusiensis MCF encode SQR (H206_01218, Ga0183576_101211), and it was also detected in the proteome of Ca. Electronema sp. GS (SI Data 2). SQR is a periplasmic enzyme that catalyzes the oxidation of sulfide to zerovalent sulfur coupled to the reduction of quinones in the membrane (49). The cable bacteria SQRs belong to the type 3 group of SQR enzymes (Fig. S2). Members of this group are generally poorly functionally characterized (49), but available experimental evidence suggests that they function as bona fide SQRs (50, 51). SQRs, including the one of the cable bacteria, have no membrane spanning regions but interact with the membrane through their C-terminal region (49). The cable bacteria SQR carries an N-terminal signal peptide sequence and thus has a predicted periplasmic localization. During extensive microscopic analyses of cable bacteria, sulfur inclusions were never observed (1, 27, 52), indicating that the sulfur produced by SQR is rapidly consumed, or released and dissolved as hydrophilic polysulfides. In some aerobic sulfide oxidizers, zerovalent sulfur produced by SQR-dependent sulfide oxidation is oxidized to sulfite via rhodanese and a sulfur deoxygenase (53,54). A rhodanese with a predicted periplasmic localization is encoded in the genomes of both Ca. Electronema sp. GS and Ca. E. aarhusiensis MCF (H206_00301, Ga0183576_12525), and it is abundant in the proteome of Ca. Electronema sp. GS (SI Data 2). Sulfur dioxygenases which belong to the metallo-lactamase super-family (IPR001279) generally have a low degree of sequence conservation, and are thus difficult to identify bioinformatically (53). The cable bacteria genomes encode members of this superfamily, however the function of these proteins remains hypothetical. The Ca. E. aarhusiensis MCF genome encodes a protein (H206_01737) with fused N-terminal rhodanese and C-terminal metallo-lactamase super-family domains. Homologs of this protein are also present in the genomes of other marine cable bacteria (Ca. E. communis A1, Ca. E. marina A2, Ca. E. marina A5) and various Desulfobulbus species. Their function may resemble that of sulfur dioxygenase proteins in Burkholderia, which have a fused rhodanese and dioxygenase domain (55). However, as discussed in the main text, rhodanese domain proteins may alternatively be involved in the transfer of zerovalent sulfur from the periplasm to the cytoplasm where it is oxidized.
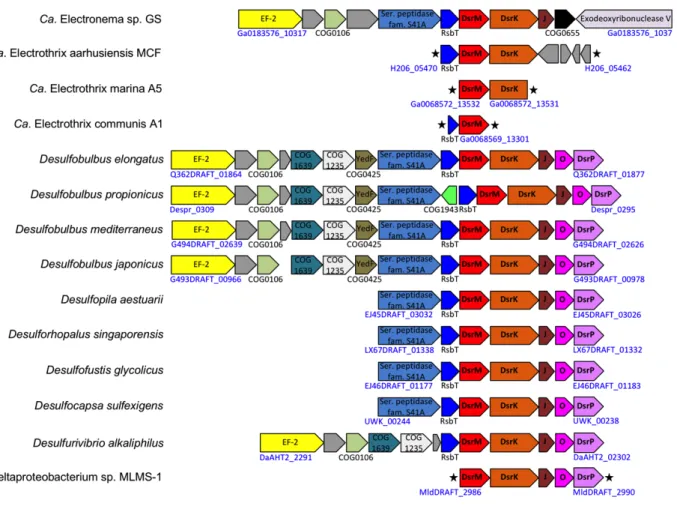
The enzymatic pathway for disproportionation of elemental sulfur is generally poorly resolved (56), but in D. alkaliphilus it seems to involve the enzymes of the canonical sulfate reduction pathway (48). Notably, the capacity for sulfur disproportionation and for autotrophic growth appears to coincide with the presence of a conserved gene cluster encoding a heterodisulfide reductase (HdrC), a methyl-viologen-reducing hydrogenase (mvhD), and a methylene-tetrahydrofolate reductase-like protein (Fig. S10). This set of genes is fully conserved in autotrophic, sulfur disproportionating members of the family Desulfobulbaceae as well as in
non-deltaproteobacterial sulfur disproportionators but is absent in heterotrophic relatives; it also occurs in cable bacteria, which lends support to their sulfur disproportionation capacity, even though the function of this gene cluster in disproportionation or autotrophy remains to be unraveled.
As discussed in the main text, our model of sulfide oxidation and sulfur disproportionation in cable bacteria proposes that elemental sulfur produced by the activity of SQR in the periplasm is partly reduced to sulfide by the activity of a energy-conserving polysulfide reductase and partly transported into the cytoplasm, where it is oxidized to sulfate by a reversal of the canonical sulfate-reduction pathway (main text, Fig. 3). The initial step in the latter pathway is the reaction of sulfur (or possibly sulfide) with DsrC (main text Fig. 3). The cable bacteria genomes encode a single DsrC homolog with a CBX10CA conserved cysteine structure associated with the sulfate reduction
pathway (57) and its reversal in sulfide oxidizing-prokaryotes (48, 58). Similar to D. alkaliphilus, cable bacteria genomes do not encode DsrEFH, which is likely essential for the sulfide oxidation pathway involving reverse-type DsrAB (rDSR) enzymes (58) but do encode DsrD adjacent to DsrAB, which is considered indicative for a reductive type dissimilatory sulfur metabolism (59). The genomic content together with the sulfide oxidizer phenotype of D. alkaliphilus and cable bacteria questions the use of dsrAB and dsrD as functional marker genes for sulfate reduction. In deltaproteobacterial sulfate reducers DsrMK is part of the membrane bound complex DsrMKJOP (60). DsrMK forms a module that mediates electron transfer between the cytoplasm and the quinone pool while DsrJOP forms a module involved in electron transfer between the quinone pool and the periplasm (61,62). DsrJOP appears absent in cable bacteria (Fig. S3) and is evidently not essential for the functioning of DsrMK since DsrJOP is also absent in Gram positive dissimilatory sulfate reducers (63). The cable bacteria also lack other membrane complexes such as Tmc, Hmc, Qrc, and Och that mediate electron transfer between the periplasm and cytoplasm in SRM (62). In this way cable bacteria resemble a cytochrome-poor dissimilatory sulfate reducer (64) even though the cable bacteria genomes encode several periplasmic cytochromes (Table S5), some of which are abundant in the proteome of Ca. Electronema sp. GS (SI Data 2). As also discussed in the main text we suspect that this reflects a need for cable bacteria to tightly control the exchange of electrons between cytoplasm and periplasm.
Electron transfer from the membrane quinone pool to the periplasm. In Geobacter electron transfer from the quinone pool to the periplasm is facilitated by the membrane-bound, proton-translocating cytochrome bc complex that delivers electrons to soluble periplasmic cytochromes (65,66). The canonical bc1 complex consists of a membrane-bound Rieske Fe-S domain protein and membrane-bound cytochromes b and c1 (67,68). The genomes of Ca. E. aarhusiensis MCF and Ca. Electronema sp. GS encode a membrane-bound Rieske Fe-S domain protein and an adjacent membrane-bound cytochrome b-domain protein that match both the N (IPR005797) and C terminal domain (IPR005798) models of the bc complex cytochrome b. The bc complex translocates protons by a Q-cycling mechanism, where the quinone/quinol-binding and proton release sites are located in the Rieske and the cytochrome b subunits (67,68), respectively. Similar to Geobacter (65), cable bacteria do not encode a c1-type cytochrome but another cytochrome
possibly could substitute c1 for electron transfer.
Another possibility for electron transfer from the quinone pool to the periplasm may be via CydA: Desulfobulbaceae possess a quinol-dependent membrane-bound terminal oxygen reductase encoded by the linked genes cydA and cydB (69). The CydA subunit oxidizes the quinone pool and transfers electrons to the heme d/heme b595-binding active site formed between the CydA and
CydB subunits, which catalyzes the reduction of dioxygen (70,71). This high-oxygen affinity bd quinol oxidase is believed to protect sulfate reducers against oxygen stress (72,73).
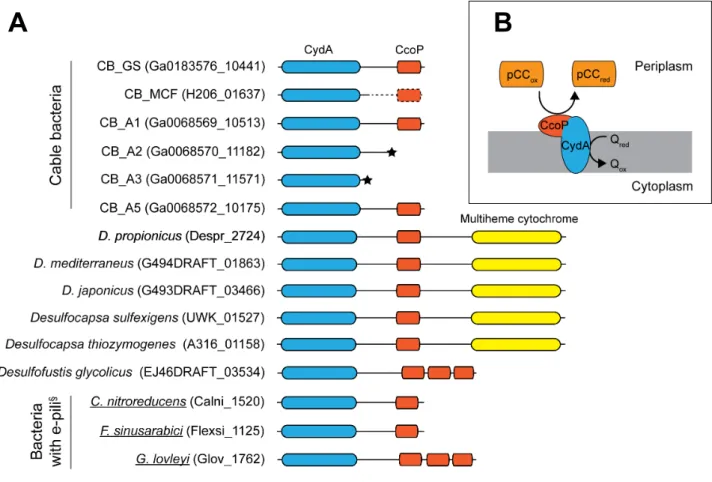
Unlike other members of the family Desulfobulbaceae (Fig. 1 in the main text), cable bacteria do not possess a bd quinol oxidase as their genomes do not encode a CydB homolog. However, their
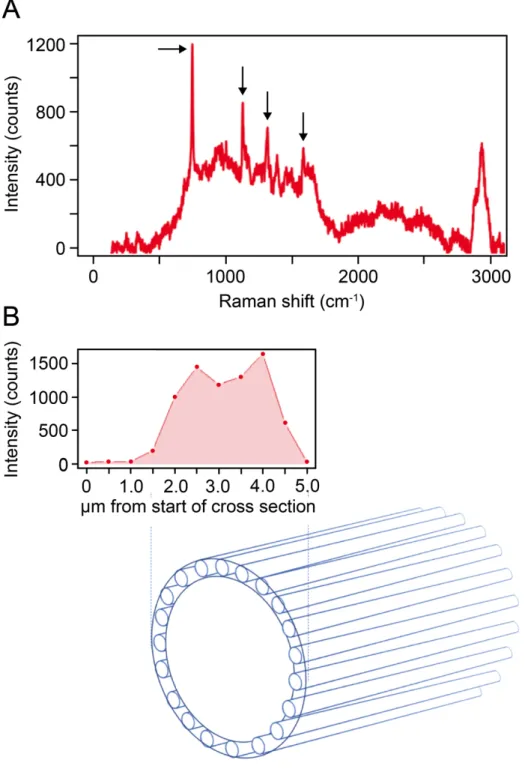
genomes do encode a CydA-like protein (matching the pfam CydA model PF01654) that is distantly related (<40% identity) to known CydA proteins. The cable bacteria CydA (Ga0183576_10441, H206_01637) has 8 transmembrane helices as compared to the 9 in bona fide CydA proteins (70) and notably it has a cytochrome domain (PF13442) in its C-terminal part with a predicted periplasmic localization (Fig. S4). By this domain structure the cable bacteria CydA resembles the membrane bound CymA protein in Shewanella which is involved in transfer of electrons from the quinone pool to the periplasm during growth on extracellular electron acceptors (74). Indeed the CydA subunit of the bd quinol oxidase harbors the quinol binding site and binds the heme ligands of the oxidase (71). The cable bacteria CydA-like protein also has the conserved residues His19, His186, Lys252, Glu257, Met393 known to be important for quinol and heme binding (70). We therefore hypothesise that the cable bacteria CydA functions in oxidizing the reduced quinone pool in the membrane. The electrons may then be transferred to the periplasmic cytochrome domain of the cable bacteria CydA and from there to a soluble electron shuttle in the periplasm. Desulfobulbus and Desulfocapsa species all carry two proteins matching the pfam model for CydA. One of them is encoded next to cydB in their genomes and represents the CydA of the bd quinol oxidase. The second, orphan, CydA-like protein in Desulfobulbus and Desulfocapsa also carries a cytochrome domain, but in its central part, and otherwise shares very low amino sequence similarity (<30%) with the cable bacteria CydA-like proteins. The bd quinol oxidase contributes to energy conservation by generating a proton gradient across the cytoplasmic membrane by oxiding quinol on the periplamic side of the membrane and releasing protons to the periplasm while consuming protons from the cytoplasm by oxygen reduction (70,71). Whether CydA represents an energy-conserving mechanism in the electron transport chain of the cable bacteria needs further investigation.The cable bacteria genomes encode several C-type cytochromes, most with a predicted periplasmic localization (Table S5), and Raman microscopy showed a high abundance of c-type cytochromes in live cable bacteria (75, Fig. S5). We therefore propose a model where c-type cytochromes play a key role in transferring electrons from the Rieske-cytochrome b complex or CydA to the conductive periplasmic fibers (main text Fig. 3). Possibly this transfer may also involve the diheme cytochrome MacA as in Geobacter (76). A highly expressed MacA homolog is encoded in the genomes of Ca. Electronema sp. GS and Ca. E. aarhusiensis MCF (H206_05370, Ga0183576_10582) sharing 43% full length sequence identity with MacA of Geobacter sulfurreducens PCA (NP_951525).
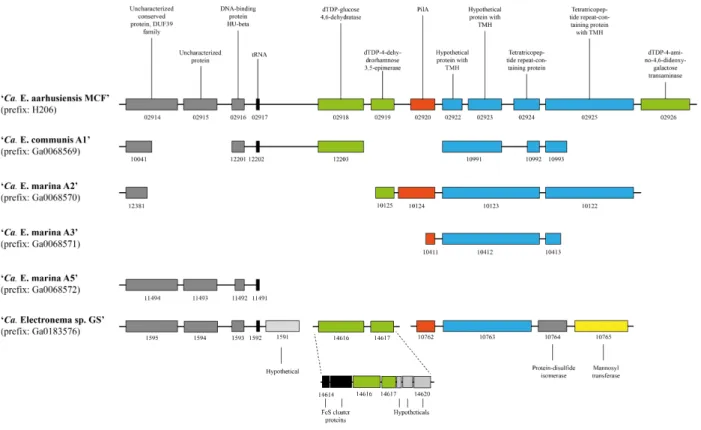
Pilus-associated genes. Cable bacteria contain at least three operons of genes associated with type IV pili or type II secretion systems (Table S6), that, together with >10 other genes encode a complete pilus apparatus. This includes genes encoding the PilQ secretin which forms a pore in the outer membrane through which the pilus normally protrudes into the extracellular environment (77). However, as discussed in the main text, extracellular pili were never observed in cable bacteria despite extensive electron microscopy imaging. PilQ also serves an essential function as initiator of the assembly of the pilus machinery. We therefore speculate that PilQ is also essential for assembly and stabilization of the pilus machinery in cable bacteria and thus for the formation of the periplasmic pili that we hypothesize form (part of) the periplasmic fibers. The cryo-EM structure of the Pseudomonas aeruginosa PilQ secretin at 7.4Å revealed a central gate that is closed when the pilus is depolymerized (78). It is conceivable that the cable bacterial secretin PilQ is in a constant closed state, and the major functional role of this protein in cable bacteria is structural in relation to the assembly of the pilus machinery. The pilA genes in Ca. E. aarhusiensis MCF and Ca. Electronema sp. GS are not part of any of those operons but instead linked to genes encoding proteins with tetratricopeptide-repeats that may aid in assembling individual PilA subunits into continuous fibers that span the entire cable bacterium filament (see main text). In Ca. Electrothrix, the pilA operon also encodes three sugar-modifying enzymes (Fig. S6), which we speculate could be involved in pilus glycosylation and thereby integrating pili into the cell envelope or onto a sugar backbone. Genes encoding the same enzymes are also present in Ca.
Electronema, although not co-located with pilA (Fig. S6). This may be due to the genome-rearranging activity of transposases encoded in the vicinity of these genes in the genome of Ca. Electronema. Taken together, we speculate that the genomic arrangement of the pil genes and especially pilA may support an assembly of multiple e-pili, potentially onto a carbohydrate backbone, into larger fiber structures.
Terminal oxygen reduction. The genome of Ca. Electrothrix communis A1 encodes all four subunits of a membrane-bound cytochrome c oxidase (Cox1-4: Ga0068569_12322 and _13881 to _13884), of which the catalytic subunit shares 60% amino acid sequence identity with the cc(o/b)o3 type characterized in Desulfovibrio vulgaris (79). All four subunits are most closely
related to homologs in other Desulfobulbaceae species (~75% amino acid sequence identity), yet these genes are present as the sole genes on two single contigs in the Ca. E. communis A1 genome assembly, and their presence may be the result of an erroneous assembly (i.e., contamination). The other cable bacteria genomes did not encode membrane bound cytochrome oxidases, neither a cbb3 nor an aa3 type (80). Therefore the presence of cytochrome c oxidase in Ca. E. communis
A1 is most likely either an artifact or a result of horizontal gene transfer. This type of terminal oxidase is thus, just like the quinol-dependent membrane-bound terminal oxygen reductase CydAB discussed in the previous section, unlikely to play a key role in the general oxygen metabolism of cable bacteria.
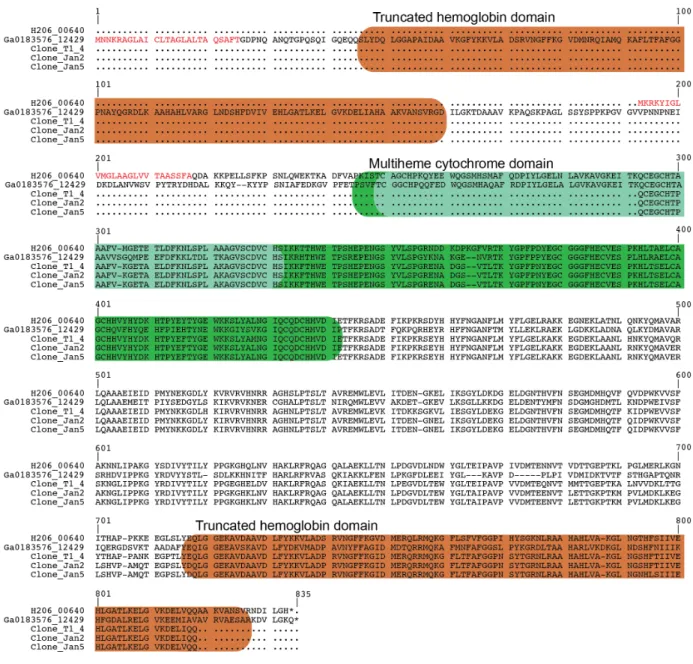
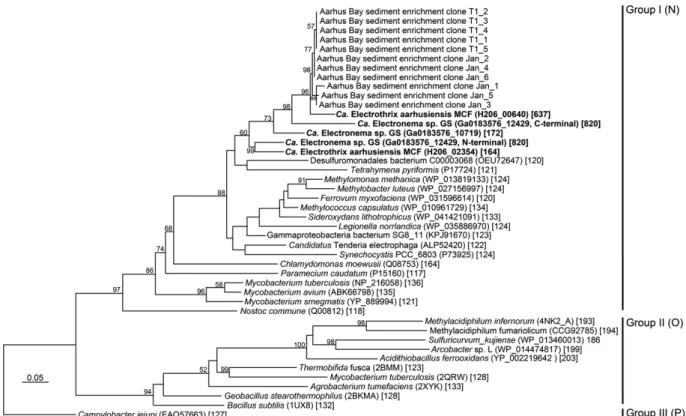
The Ca. E. aarhusiensis MCF and Ca. Electronema sp. GS genomes encode homologous proteins (H206_00640, Ga0183576_12429), consisting of a truncated hemoglobin and a tetraheme cytochrome domain. The two proteins share 55% amino acid identity (Fig. S7); however, the Ca. Electronema sp. GS protein has an N- and a C-terminal truncated hemoglobin domain and a central multiheme cytochrome domain, while the Ca. E. aarhusiensis MCF protein lacks the N-terminal truncated hemoglobin domain and is correspondingly shorter (Fig. S7A). Both proteins possess a predicted N-terminal signal peptide, and as they have no predicted membrane spanning regions they are likely located in the periplasm (Fig. S7A). Fusion proteins with globin and other functional domains are known from lower eukaryotes and bacteria (81). However, the presence of globin and cytochrome domains in a single protein is unique and never previously observed according to blastp searches against the NCBI nr database and CDART domain architecture searches (82). We validated that this fusion protein is not a result of a genome assembly error by PCR amplifying, cloning and sequencing the gene from DNA extracted from two Aarhus Bay sediment cable bacterium enrichment cultures using a custom designed primer set targeting the gene regions encoding the cytochrome domain and the C-terminal globin domain of the protein (see SI Methods). The sequencing confirmed that the two domains were encoded in a single ORF devoid of internal frame shifts or stop codons. The cytochrome part of the protein shares 50-60% identity with homologs in other deltaproteobacterial species, while the hemoglobin part shares 60-70% identity with single-domain truncated globins from a taxonomically diverse set of bacteria and eukaryotes and phylogenetically belongs to the Group I clade of hemoglobins (Fig. S7B). Little is known about the functions of hemoglobins in bacteria, but roles in oxygen sensing, catalytic nitrosative stress protection and oxygen binding and reduction have been proposed (81, 83, 84). The fusion of two such redox active domains suggests a role in an oxidation-reduction process. For a fusion protein with a globin domain and a monooxygenase domain in Streptomyces avermitilis, the globin domain is proposed to function in oxygen activation (85), and in mammalian cells neuroglobin can act as an electron donor for cytochrome c (86). As discussed in the main text, it is thus tempting to speculate that the unique truncated hemoglobin-cytochrome domain protein catalyzes periplasmic oxygen reduction in cable bacteria.
Protection from oxidative stress. Similar to many other sulfate reducers Ca. E. aarhusiensis MCF and Ca. Electronema sp. GS harbor a cytoplasmic oxygen reductase (rubredoxin-oxygen oxidoreductase [H206_00510/11, Ga0183576_1519]) that uses reducing equivalents in the form of NADH from stored polyglucose to reduce and thereby detoxify oxygen (64). In accordance,
cable bacteria harbor a complete pathway for synthesizing and degrading polyglucose (Fig. S9) (87,88). The absence of genes encoding the glycolytic enzyme enolase (Fig. S9, see main text for details) in the cable bacteria genomes may question whether they can produce NADH and thus also ATP from polyglucose degradation, yet the consistent presence of the polyglucose metabolism genes in cable bacteria genomes and the observation of polyglucose granules in cable bacteria cells (main text Fig. 5C) suggest otherwise. In both Ca. Electronema sp. GS and Ca. E. aarhusiensis MCF, the rubredoxin-oxygen oxidoreductase is part of a putative operon (H206_00509- H206_00521; Ga0183576_1519, Ga0183576_1110 - Ga0183576_1114) likely involved in protection against oxidative stress. This operon includes genes encoding the super oxide reductase desulfoferredoxin (89) and the hydrogen peroxide reductase rubrerythrin (90). Both of these cytoplasmic enzymes are believed to receive electrons from polyglucose degradation via the electron donor rubredoxin (91) also encoded in this operon. The Ca. E. aarhusiensis MCF genome also encodes the cytoplasmic bifunctional catalase/peroxidase KatG (H206_00990/1) for oxidative stress protection. Ca. Electronema sp. GS encodes two cytoplasmic catalases (Ga0183576_1609, Ga0183576_11638). Finally, Ca. Electronema sp. GS and Ca. E. aarhusiensis MCF also encode a superoxide reductase with a predicted periplasmic localization (H206_01519, Ga0183576_1191) and homologs (H206_06117-H206_06119; Ga0183576_10745-Ga0183576_10747) of the BatA-E proteins putatively involved in periplasmic oxidative stress protection in Bacteroides fragilis (92).
Membrane complexes involved in electron transfer from/to NADH and ferredoxin. The genomes of the marine strains Ca. E. aarhusiensis MCF and Ca. E. marina A5 encode a Na+
translocating NADH:ubiquinone oxidoreductase membrane complex (NqrAF, H206_01090 -H206_01081 and Ga0068572_10891-92, Ga0068572_10896, Ga0068572_13931-33). Nqr transfers electrons from NADH to the quinol pool while translocating Na+ across the membrane.
The MCF genome encodes several H+/Na+ antiporters and possibly this complex facilitates energy
conservation from organotrophic growth. However, perhaps more likely the presence of this complex is an adaptation to growth in a saline environment as the Nqr complex is absent in the freshwater Ca. Electronema sp. GS. Similarly, this complex is present in the two marine Desulfobulbus species (D. japonicus and D. mediterraneus) but absent in the two freshwater Desulfobulbus species D. propionicus and D. elongatus.
The genomes of both Ca. E. aarhusiensis MCF and Ca. Electronema sp. GS encode a proton-translocating NAD(P)H-quinone oxidoreductase complex (Nuo), which is known to serve a similar function as the Nqr complex in transferring electrons between cytoplasmic NADH and the quinone pool (93). The Nuo complex may also catalyze the reduction of NAD+ to NADH with
quinol as electron donor by reverse electron flow thereby producing NAD(P)H (94) e.g. needed for CO2 assimilation. The cable bacteria do not possess NuoEFG subunits, which form the NADH
dehydrogenase module of the complex. This is commonly observed among SRM and it was suggested that their Nuo complexes oxidize ferredoxin (H206_03280, Ga0183576_11234) rather than NADH (62). Whether reverse electron flow will also facilitate the reduction of ferredoxin is not known. However, as cable bacteria are predicted to assimilate CO2 autotrophically by the
acetyl-CoA pathway, they need a mechanism for producing reduced ferredoxin from sulfide oxidation, as it is a key electron donor for the acetyl-CoA pathway along with NADH (95). Notably, the entire set of nuo genes [nuoA-D, H-N] in both Ca. E. aarhusiensis MCF and Ca. Electronema sp. GS seems acquired by a recent lateral gene transfer as their nuo genes consistently show high similarity to homologs in members of the genus Fibrobacter (phylum Fibrobacteres) as compared to homologs in Desulfobulbaceae (Table S4). In agreement, the NuoBC subunits are fused both in cable bacteria and in Fibrobacter species, but not in any other bacteria according to blastp search against the NCBI database. Unlike Fibrobacter intestinalis ATCC 43854 and Fibrobacter succinogenes S85, cable bacteria however lack genes encoding NuoEFG subunits. Known members of the genus Fibrobacter are obligate anaerobes unable to grow by respiration and are typically found in herbivore guts (96,97). The functional significance, if any, of the
transfer of the nuo gene cluster from a relative of this group to cable bacteria is not clear. Cable bacteria genomes furthermore encode a putative ferredoxin-NADP reductase (H206_01641, Ga0183576_10951) sharing 29% full-length amino acid sequence identity with the characterized enzyme (B9ZYL6) of Hydrogenobacter thermophilus (98) and sharing the same domain structure with a N-terminal NAD-binding domain (PF00175) and a C-terminal FAD-binding domain (PF00970). This cytoplasmic enzyme catalyzes reversible electron transfer between NADP+/NADPH and ferredoxins and it is possibly involved in production of reduced ferredoxin
from NAD(P)H in cable bacteria. The soluble heterodisulfide reductases discussed below are possibly also involved in ferredoxin production.
Cable bacteria lack the energy-conserving RNF complex, known from several deltaproteobacterial sulfate reducers, which couple oxidation of ferredoxin by NAD+ to sodium
translocation across the cytoplasmic membrane (62).
Soluble heterodisulfide reductases. Heterodisulfide reductase (HdrABC) is encoded in the genome of Ca. E. aarhusiensis MCF by the linked hdrABC genes (H206_03463- H206_03465), but the other cable bacteria do not encode HdrB or carry adjacent hdrA and C in their genomes. Ca. E. aarhusiensis MCF furthermore carries two additional copies of hdrA both adjacent to a homolog of mvhD encoding a methyl-viologen-reducing hydrogenase, delta subunit with a predicted cytoplasmic localization (H206_00705/H206_03779, H206_01153-55/ H206_01156/7). The gene product of the hdrA copies shares 89% with the product of a hdrA homolog (Ga0183576_1212) in Ca. Electronema sp. GS located at the end of a contig thus missing the adjacent mvhD. The HdrA-MvhD pairs are commonly observed in sulfate-reducing bacteria and likely represent electron transfer modules connecting cytoplasmic redox reactions (99). The two hdrA-mvhD pairs in Ca. E. aarhusiensis MCF are respectively located next to genes with a predicted function in fatty acid synthesis and the acetyl-CoA pathway and may serve as a redox partner in these pathways. The cable bacteria also encode a HdrC homolog, next to a mvhD-homolog and a gene encoding a methylene-tetrahydrofolate reductase-like protein. As discussed above, this set of genes is fully conserved in autotrophic members of the family Desulfobulbaceae which all can grow by sulfur disproportionation (Fig. S10); the gene set therefore possibly functions in CO2 fixation or disproportionation.
Hydrogen as alternative electron donor? Many sulfate reducers, including members of the family Desulfobulbaceae, utilize H2 as electron donors via periplasmic hydrogenases (64), which
also, together with periplasmic cytochromes, have a role in oxygen detoxification coupled to proton translocation (100). Such hydrogenases, including Fe-only hydrogenases (pfam02906) and Ni-containing hydrogenases (pfam00374), are absent in cable bacteria. While no hydrogenases at all were detected in the genome of Ca. Electronema sp. GS, Ca. E. aarhusiensis MCF encodes a cytoplasmic Hox hydrogenase and associated maturation proteins (SI Data 3) catalyzing the NAD+-dependent oxidation of H
2 (101). Overall, this suggests that H2 is not a general electron
donor for cable bacteria.
N2 fixation. The Ca. E. aarhusiensis MCF genome encodes the three catalytic subunits of the
molybdenum-dependent nitrogenase (NifDHK) as well as the biosynthetic proteins NifENB (SI Data 3). The Ca. Electronema sp. GS genome likewise encodes NifDHK and NifNB yet lacks NifE (SI Data 3). Together this indicates the potential for N2 fixation to ammonium (102).
Ammonium and amino acids can also be acquired from the environment, as cable bacteria encode an AmtB-family ammonium transporter as well as predicted amino acid and peptide ABC-type transporters (SI Data 3). Cable bacteria thus resemble deltaproteobacterial sulfate reducers, some of which are heterotrophic diazotrophs (103). Although ammonium is rarely limiting in anaerobic sediment, heterotrophic N2 fixation can be significant in marine sediments (104). The role of N2
Motility and chemotaxis. Cable bacteria are motile by an unknown mechanism; based on microscopic observations, they were hypothesized to move by gliding motility (27). In support of that, genes encoding flagella, which are generally conserved within the Desulfobulbaceae, could not be detected in the cable bacteria genomes. Characterized genes involved in gliding motility in Flavobacteria (105,106) were not detected either in the cable bacteria genomes. The genomes of Ca. E. aarhusiensis MCF and Ca. Electronema sp. GS however encode several putative polysaccharide exporters consisting of a fused permease and cytoplasmic ATPase component (COG1132), which could be involved in excretion-based gliding motility as known from cyanobacteria (107), Beggiatoa (108), and Myxobacteria (109). Desulfonema limicola is the closest filamentous relative of Ca. E. aarhusiensis MCF with available genome data. This species moves by gliding motility (110) and features, similarly to Ca. E. aarhusiensis MCF, several genes coding for putative polysaccharide exporters (BioProject accession number PRJNA50089). Cable bacteria actively position themselves in an oxygen-sulfide gradient presumably by chemotaxis (27). The genomes of Ca. Electronema sp. GS and Ca. E. aarhusiensis MCF contain three putative chemotaxis operons (operon 1, Ga0183576_1157-59; H206_01667-69; operon 2, Ga0183576_1376-79; H206_01375-84 and operon 3 Ga0183576_10430-40; H206_02778-84). This is significantly fewer than other Desulfobulbaceae, which appear to feature 11-23 chemotaxis operons per genome (based on using the presence of genes with methyl-accepting chemotaxis protein domains as a proxy for chemotaxis operons). This indicates limited or highly focused response capabilities to the environment by cable bacteria. The specificities of the chemotaxis sensing domains could not be determined. In both genomes chemotaxis operon 1 includes a putative TauE-like anion permease and ABC transporters for anions, while the other operons include hypothetical proteins and in Ca. Electronema sp. GS operon 2 and 3 include tRNA synthetase domain proteins; tRNA synthetases were previously suggested to play a role in regulation of (flagellar) motility (111).
Cable bacteria genomes show evidence of strong virus interaction. As discussed above, the COG functional categories V (defense mechanisms) and D (cell cycle control, cell division, chromosome partitioning) were overrepresented in cable bacteria (Fig. S1A). The high representation of category V in Ca. E. aarhusiensis MCF is in part due to Type I restriction-modification enzymes (COG0732, COG0286, COG0610, n=22). Restriction systems may act as mobile genetic elements (112), yet phylogenetic analysis did not indicate a recent expansion of these genes within the Ca. E. aarhusiensis MCF genome. A high load of mobile elements was reported in the filamentous sulfide oxidizer Ca. Maribeggiatoa sp., for which a role in cell differentiation was hypothesized (113). However the predominance of these genes may also reflect that cable bacteria are challenged by phages (114). This is furthermore supported by the high representation of COG category D. Most members of this category are antitoxins of toxin-antitoxin modules (COG4118, COG2161, n=10) with adjacent genes annotated as toxins. Toxin-antitoxin modules are widespread in bacterial genomes and may function in defense against phages (115). Although not assigned to single COGs, genes encoding or interacting with restriction enzymes and toxin-antitoxin modules are also overrepresented in the genomes of the other cable bacteria relative to cultivated members of the family Desulfobulbaceae (Table S9). The genome of Ca. Electronema sp. GS is furthermore characterized by an unusually long CRISPR region as compared to cultivated Desulfobulbaceae (Table S10), indicative of an elevated immunity to virus attack (116). Together this suggests that cable bacteria experience a high rate of virus predation in agreement with a lifestyle where growth occurs in blooms and kill-the-winner (117) virus predation dynamics.
Isoelectric point of proteins suggests that cable bacteria may not tolerate high pH. The activity of cable bacteria causes a pronounced pH peak of 8.5 and higher in the oxic sediment surface (1, 118, 119). Since the pH in the periplasm of Gram-negative bacteria largely resembles that of the environment (120), we suspected that periplasm-exposed proteins were adapted to
higher pH, which would be indicated by their isoelectric point (pI). However, pI biases of periplasm-exposed proteins (i.e. those with signal peptides or transmembrane helices) of cable bacteria largely resemble those of neutrophilic Desulfobulbaceae and are significantly higher than those of alkaliphilic Desulfobulbaceae (Fig. S13). This suggests that cable bacteria, like their neutrophilic relatives (121, 122), are adapted to environments of neutral pH and may not grow under alkaline conditions. In particular, the high pH in the oxic zone of blooming cable bacteria populations (118, 123) may cause denaturation of periplasmic proteins in the cathodic cells and contribute to the collapse of cable bacteria blooms.
Gene regulation. Relative to their genome sizes, Aarhus Bay cable bacteria have on average fewer predicted regulatory genes, i.e. genes with small-molecule-binding domains (124), with cyclic-di-GMP-binding domains (125), and genes potentially interacting with histidine kinases of two component systems (126), than other members of the Desulfobulbaceae (Fig. S12). Average densities of regulatory genes in cable bacteria are comparable to those of other sulfur-cycling filamentous bacteria, such as the deltaproteobacterial sulfate-reducer Desulfonema limicola or gammaproteobacterial sulfide-oxidizers of the family Beggiatoaceae.
References
1. Pfeffer C, Larsen S, Song J, Dong M, Besenbacher F, Meyer RL, Kjeldsen KU, Schreiber L, Gorby YA, El-Naggar MY, Leung KM, Schramm A, Risgaard-Petersen N, Nielsen LP (2012) Filamentous bacteria transport electrons over centimetre distances. Nature 491(7423):218–221.
2. Schmieder R, Edwards R (2011) Quality control and preprocessing of metagenomic datasets. Bioinformatics 27(6):863–864.
3. Bankevich A, Nurk S, Antipov D, Gurevich A a., Dvorkin M, Kulikov AS, Lesin VM, Nikolenko SI, Pham S, Prjibelski AD, Pyshkin AV, Sirotkin AV, Vyahhi N, Tesler G, Alekseyev MA, Pevzner PA. (2012) SPAdes: A new genome assembly algorithm and its applications to single-cell sequencing. J Comput Biol 19(5):455–477.
4. Camacho C, Coulouris G, Avagyan V, Ma N, Papadopoulos J, Bealer K, Madden TL (2009) BLAST+: Architecture and applications. BMC Bioinformatics 10:1–9.
5. Stajich JE, Block D, Boulez K, Brenner SE, Chervitz SA, Dagdigian C, Fuellen G, Gilbert JGR, Korf I, Lapp H, Lehvaslaiho H, Matsalla C, Mungall CJ, Osborne BI, Pocock MR, Schattner P, Senger M, Stein LD, Stupka E, Wilkinson MD, Birney E (2002) The Bioperl Toolkit: Perl modules for the life sciences. Genome Res 12:1611– 1618.
6. Iverson V, Morris RM, Frazar CD, Berthiaume CT, Morales RL, Armbrust EV (2012) Untangling genomes from metagenomes: revealing an uncultured class of marine Euryarchaeota. Science 335(587):587–591.
7. Langmead B, Salzberg SL. (2012) Fast gapped-read alignment with Bowtie 2. Nat Methods. 9(4):357-359.
8. Markowitz VM, Chen IMA, Palaniappan K, Chu K, Szeto E, Grechkin Y, Ratner A, Jacob B, Huang J, Williams P, Huntemann M, Anderson I, Mavromatis K, Ivanova NN, Kyrpides NC (2012) IMG: The integrated microbial genomes database and comparative analysis system. Nucleic Acids Res 40(D1):115–122.
9. Benson DA, Cavanaugh M, Clark K, Karsch-Mizrachi I, Ostell J, Pruitt KD, Sayers EW (2018) GenBank. Nucleic Acids Res 46(D1):D41–D47.
10. Larkin MA, Blackshields G, Brown NP, Chenna R, Mcgettigan PA, McWilliam H, Valentin F, Wallace IM, Wilm A, Lopez R, Thompson JD, Gibson TJ, Higgins DG (2007) Clustal W and Clustal X version 2.0. Bioinformatics 23(21):2947–2948.
11. Gordon D, Abajian C, Green P (1998) Consed: a graphical tool for sequence finishing. Genome Res 8:195–202.
12. Kjeldsen KU, Loy A, Jakobsen TF, Thomsen TR, Wagner M, Ingvorsen K (2007) Diversity of sulfate-reducing bacteria from an extreme hypersaline sediment, Great Salt Lake (Utah). FEMS Microbiol Ecol 60(2):287–298.
13. Solden LM, Hoyt DW, Collins WB, Plank JE, Daly RA, Hildebrand E, Beavers TJ, Wolfe R, Nicora CD, Purvine SO, Carstensen M, Lipton MS, Spalinger DE, Firkins JL, Wolfe BA, Wrighton KC (2017) New roles in hemicellulosic sugar fermentation for the uncultivated Bacteroidetes family BS11. ISME J 11(3):691–703.
14. McCarthy AJ, Daly K, Sharp RJ (2000) Development of oligonucleotide probes and PCR primers for detecting phylogenetic subgroups of sulfate-reducing bacteria. Microbiology 146(7):1693–1705.
15. Liu Y-G, Whittier R (1995) Thermal asymmetric interlaced PCR: automatable amplification and sequencing of insert end fragments from P1 and YAC clones for chromosome walking. Genomics 681:674–681.
16. Amann RI, Binder BJ, Olson RJ, Chisholm SW, Devereux R, Stahl DA (1990) Combination of 16S rRNA-targeted oligonucleotide probes with flow cytometry for analyzing mixed microbial populations. Appl Environ Microbiol 56(6):1919–1925. 17. Scheid D, Stubner S (2001) Structure and diversity of Gram-negative sulfate-reducing
bacteria on rice roots. FEMS Microbiol Ecol 36(2–3):175–183.
18. Hunt DE, Klepac-Ceraj V, Acinas SG, Gautier C, Bertilsson S, Polz MF (2006) Evaluation of 23S rRNA PCR primers for use in phylogenetic studies of bacterial diversity. Appl Environ Microbiol 72(3):2221–2225.
19. Strous M, Kraft B, Bisdorf R, Tegetmeyer HE (2012) The binning of metagenomic contigs for microbial physiology of mixed cultures. Front Microbiol 3:1–11. 20. Buchfink B, Xie C, Huson DH (2015) Fast and sensitive protein alignment using
DIAMOND. Nat Methods 12(1):59–60.
21. Otto TD, Dillon GP, Degrave WS, Berriman M (2011) RATT: Rapid annotation transfer tool. Nucleic Acids Res 39(9):1–7.
22. Hyatt D, Chen GL, LoCascio PF, Land ML, Larimer FW, Hauser LJ (2010) Prodigal: Prokaryotic gene recognition and translation initiation site identification. BMC Bioinformatics 11:119.
23. Seemann T (2014) Prokka: Rapid prokaryotic genome annotation. Bioinformatics 30(14):2068–2069.
24. Rho M, Tang H, Ye Y (2010) FragGeneScan: Predicting genes in short and error-prone reads. Nucleic Acids Res 38(20):1–12.
25. Huson DH, Mitra S, Ruscheweyh H-J, Weber N, Schuster SC (2011) Integrative analysis of environmental sequences using MEGAN4. Genome Res 21(9):1552–1560. 26. Trojan D, Schreiber L, Bjerg JT, Bøggild A, Yang T, Kjeldsen KU, Schramm A
(2016) A taxonomic framework for cable bacteria and proposal of the candidate genera Electrothrix and Electronema. Syst Appl Microbiol 39(5):297–306. 27. Bjerg JT, Damgaard LR, Holm SA, Schramm A, Nielsen LP (2016) Motility of
electric cable bacteria. Appl Environ Microbiol 82(13):3816–3821.
28. Bolger AM, Lohse M, Usadel B (2014) Trimmomatic: a flexible trimmer for Illumina sequence data. Bioinformatics 30(15):2114–2120.
29. Peng Y, Leung HCM, Chin FY. (2010) IDBA – A practical iterative de Bruijn graph de novo assembler. Research in Computational Molecular Biology. RECOMB 2010. Lecture Notes in Computer Science, Vol 6044., eds Istrail S, Pevzner P, Waterman M (Springer, Berlin, Heidelberg), p 305. 1st ed.
30. Karst SM, Kirkegaard RH, Albertsen M (2014) Mmgenome: A toolbox for reproducible genome extraction from metagenomes. bioRxiv:059121.