APPLICATIONS OF
PB-210/RA-226 AND PO-210/PB-210 DISEQUILIBRIA IN THE STUDY OF
MARINE GEOCHEMICAL PROCESSES by
MICHAEL PUTNAM BACON B.S., Michigan State University
(1968)
SUBMITTED IN PARTIAL FULFILLMENT OF THE REQUIREMENTS FOR THE DEGREE OF
DOCTOR OF PHILOSOPHY at the
MASSACHUSETTS INSTITUTE OF TECHNOLOGY and the
WOODS HOLE OCEANOGRAPHIC INSTITUTION November, 1975 , .
Signature of Author...
Joint Pro ram in bceanographfy, Massachusetts Institute of Technology - Woods Hole Oceanographic Institution, and Department of Earth and Planetary Sciences,
Massachusetts ,nstitute ofTechnoloqy, November 1975 Certified by...
Accepted by...
Thesis Supervisor
Chairman, Joint Oceanography Committee in the Earth Sciences, Massachusetts Institute of Technology -Woods Hole Oceanographic Institution
i dgren
. . .-2-TABLE OF CONTENTS
Page
LIST OF FIGURES 4 LIST OF TABLES 6 ACKNOWLEDGEMENTS 7 BIOGRAPHICAL NOTE 9 ABSTRACT 11 CHAPTER I. INTRODUCTION 13CHAPTER II. EXPERIMENTAL METHODS 22
A. Shipboard procedures 22
B. Analytical methods 23
C. Corrections and sources of error 31
D. Quality of the data 45
Appendix II.A. Details of the Analytical Procedure 51 for Pb-210 and Po-210
Appendix II.B. Radioactive Growth and Decay 55 Calculations
CHAPTER III. THE DISTRIBUTION OF PB-210 AND PO-210 IN 60 DISSOLVED AND PARTICULATE PHASES IN SEA WATER
A. Presentation of the data 60
B. Estimation of Ra-226 distribution 65
C. Distribution of Pb-210 68
OF THE OCEAN A. Introduction
B., Pb-210 and Po-210 distributions
C. Rates of removal and re-cycling of Pb-210 and Po-210 D. Summary and conclusions
CHAPTER V. DEEP-SEA SCAVENGING OF PB-210 AND PO-210 A. Introduction
B. Removal of Pb-210 from the deep sea C. In situ scavenging of Pb-210
D. Lead-210 scavenging at the sediment-water interface E. Scavenging of Po-210
F. Summary and conclusions CHAPTER VI. CONCLUDING REMARKS REFERENCES 107 108 112 122' 125 125 127 131 138 147 149 151 160
-4-LIST OF FIGURES
U-238 series
Polonium plating efficiency as a function of time Typical polonium alpha-spectrum
Changes with time of the particulate Pb-210 and Po-210 concentrations in sea water samples Locations of Atlantic stations
Locations of Pacific stations
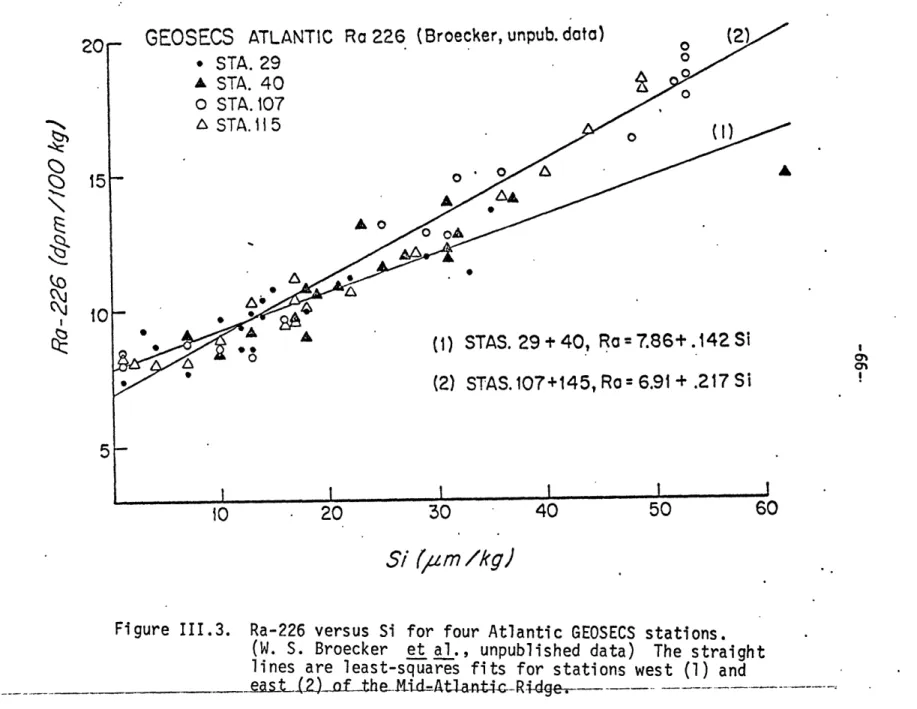
Ra-226 versus Si for four Atlantic GEOSECS stations Frequency distributions of Po-210/Pb-210 activity ratios profiles profiles profiles profiles profiles profi,l es profiles profiles profiles profiles profiles for for for for for for for for for for for Me-32 Station Me-32 Station Me-32 Station Me-32 Station Me-32 Station Me-32 Station Me-32 Station Me-32 Station Me-32 Station Me-32 Station GEOSECS 226 8 12 15 18 21 22 23 27 32 34 94 95 96 '97 98 99 100 101 102 103 105 106 III.16 Vertical profiles for GEOSECS 320
I.1 II.1 II.2 II .3 III.1 111.2 111.3 II.4 III.5 III.6 II.7 III.8 II1.9 III.10 III.11 111.12 III.13 111.14 II1.15 Vertical Vertical Vertical Vertical Vertical Vertical Vertical Vertical Vertical Vertical Vertical
IV.1 Vertical distribution of Po210-Pb210 activity 113 differences in the upper layers of the tropical
North Atlantic
V.1 Particulate Pb-210 profile showing fit of equation (2) 134 V.2 Horizontal distribution of Pb-210/Ra-226 activity ratio 140 V.3 Horizontal distribution of Pb-210/Ra-226 activity ratio 144
-6-LIST OF TABLES
11.1 Test for the -presence of Pb-210 in Po sample mounts 28
11.2 Blank determinations 35
II.3 Analytical results for replicate samples, Meteor-32 40 11.4 Results of delayed sampling experiment, AII 85 42 II.5 Po-210 collected on filters arranged in series 46 11.6 Results of particulate Pb-210 intercalibration 48 1I.7 Results of dissolved Pb-210 intercalibration 49 III.1 Ra-Si relationships at four Atlantic GEOSECS stations 67 I1.2 Summary of Po-210/Pb-210 activity ratios 72
III.3 Analytical results for the Atlantic 75
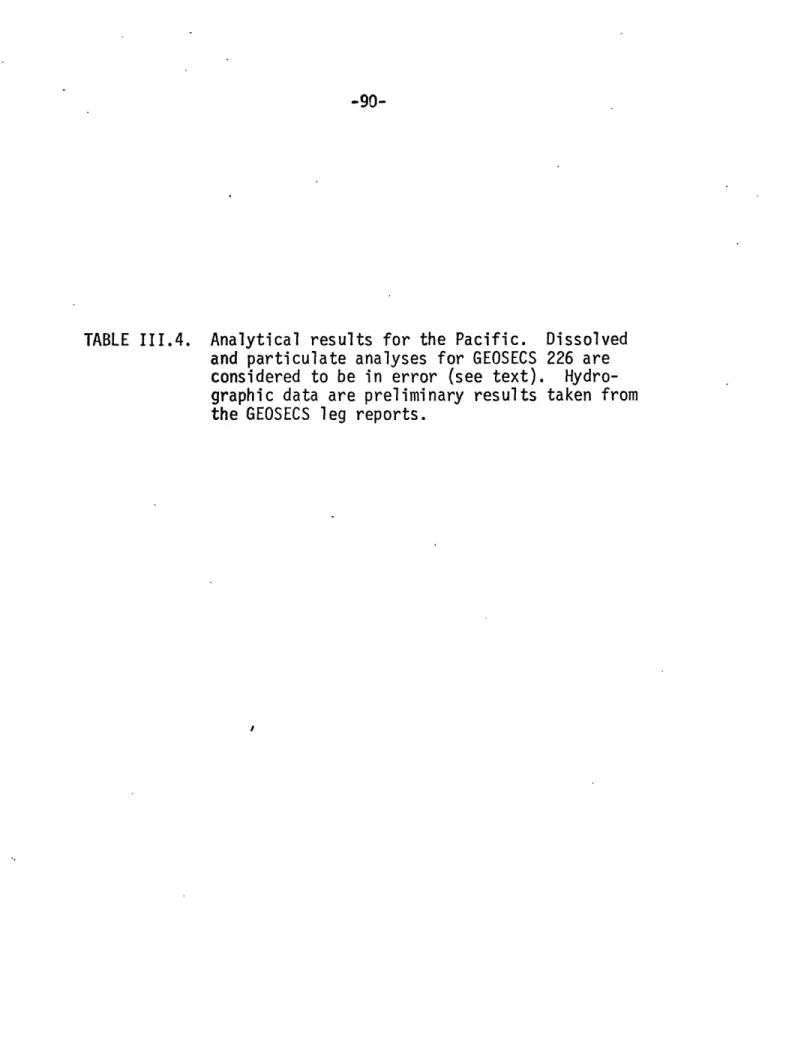
111.4 Analytical results for the Pacific 90
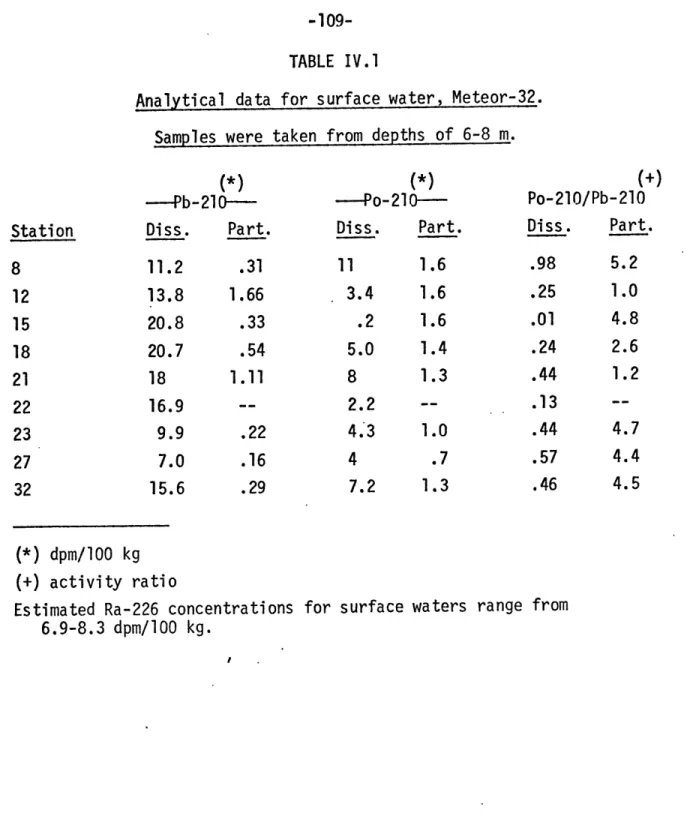
IV.l Analytical data for surface water, Meteor-32 109 IV.2 Inventories of Ra-226, Pb-210 and Po-210 in the surface 115
layers of the North Equatorial Atlantic
IV.3 Results of box-model calculations 121
V.1 Integrated Ra-226 and dissolved Pb-210 activities for 129 the deep water column
V.2 Results of Pb-210 sinking velocity calculations 133 V.3 Rates of in situ Pb-210 scavenging calculated by two 137
different methods
ACKNOWLEDGEMENTS
I express my sincere thanks to Dr. Derek W. Spencer, my thesis supervisor, for his enthusiastic support of this investigation. Peter G. Brewer, John M. Edmond and Derek W. Spencer have been
unfailing in providing me guidance and encouragement throughout my career in graduate school.
My participation in Cruise 32 of F/S Meteor was made possible by Dr. K. 0. Munnich and Dr. W. Roether of the University of Heidelberg. I thank them and the officers and crew of F/S Meteor for an enjoyable and successful experience.
Samples from the Pacific were collected by the GEOSECS scientific party under the supervision of chief scientists D. W. Spencer and P. G. Brewer.
Technical advice and assistance were freely provided at various stages of the investigation by Dr. H. D. Livingston, Mr. D. R. Mann, Mr. A. P,. Fleer and Mr. C. L. Smith. Dr. J. Thomson
of Yale University contributed a supply of Po-208 tracer solution, and Dr. J. Harley of the U.S.A.E.C. Health and Safety Laboratory
provided Po-210 standards. Mr. M. D. Applequist of Scripps Institution of Oceanography participated in the intercalibration study and
gave a generous supply of stable lead tracer.
I thank Prof. W. S. Broecker of Lamont-Doherty Geological Observatory for making unpublished Ra-226 data available.
-8-The manuscript was critically reviewed by Dr. P. G. Brewer, Prof. J. M. Edmond, Dr. D. W. Spencer and Dr. W. G. Deuser. My
writing has also benefited from discussions with Prof. K. K. Turekian and Dr. L. K. Benninger of Yale University, Dr. S. Honjo, Dr. S. Tsunogai and fellow graduate students R. Anderson, J. Bishop and T. Goreau.
Figures were prepared by W.H.O.I. Graphic Services, and typing was performed expertly by Mrs. S. Callahan.
Financial support was provided by a National Science Foundation Graduate Traineeship and a National Defense Graduate Fellowship. Field and laboratory work was supported by U.S.A.E.C. Contract AT(11-1)3566 and by N.S.F. Grant GA-41061.
Finally my deepest thanks go to my wife Hiroko for her enduring patience and devotion.
BIOGRAPHICAL NOTE
The author was born in Boston on December 18, 1946, and was raised in Reading, Massachusetts. He graduated from Reading Memorial High School in 1964 and received a B.S. in Chemistry from Michigan State University in 1968. From 1968 to 1970 he served as a Peace Corps Volunteer in the Palau District of the U. S. Trust Territory of the Pacific Islands. In 1971 he entered the Massachusetts
Institute of Technology/Woods Hole Oceanographic Institution Joint Program in Oceanography. The author is a member of Phi Beta Kappa, Sigma Xi and the American Geophysical Union. He is married and has no children.
Publ ications
M.P.Bacon and J.M.Edmond (1972) Ba and Sr profiles from GEOSECS III in the S. W. Pacific (abstract). Trans. Am. Geophys. Un.,
53, 402.
M.P.Bacon and J.M.Edmond (1972) Barium at GEOSECS III in the southwest Pacific. Earth Planet. Sci. Lett., 16, 66-74.
M.Bender, T.Snead, L.H.Chan, M.P.Bacon and J.M.Edmond (1972) Barium intercalibration at GEOSECS I and III. Earth Planet. Sci. Lett., 16, 81-83.
P.G.Brewer, G.T.F.Wong, M.P.Bacon and D.W.Spencer (1975) An oceanic calcium problem? Earth Planet. Sci. Lett., 26, 81-87. C.R.Denham, M.P.Bacon and R.F.Anderson (1975) Status of the Blake
-10-J.K.B.Bishop, J.M.Edmond, D.Ketten, M.Bacon and W.Silker (1975) The chemistry of particulate matter collected by large
volume in-situ filtration of the surface 400 m at 20N, 9W in the Atlantic Ocean (abstract). Trans. Am. Geophys. Un., 56, 1001.
M.P.Bacon, P.G.Brewer and D.W.Spencer (1975) Deep-sea scavenging of Pb-210 and Po-210 (abstract).Trans. Am. Geophys. Un., 56, 1001.
ABSTRACT
APPLICATIONS OF PB-210/RA-226 AND PO-210/PB-210 DISEQUILIBRIA IN THE STUDY OF MARINE GEOCHEMICAL PROCESSES
by
Michael Putnam Bacon
Submitted to the Department of Earth and Planetary Sciences on November 25, 1975, in partial fulfillment of the requirements for the degree of Doctor of Philosophy.
The distribution of Pb-210 and Po-210 in dissolved (<0.4 micron) and particulate (>0.4 micron) phases has been measured at ten stations in the tropical and eastern North Atlantic and at two stations in the Pacific. Both radionuclides occur principally in the dissolved phase. Unsupported Pb-210 activities, maintained by flux from the atmosphere, are present in the surface mixed layer and penetrate into the thermo-cline to depths of about 500 m. Dissolved Po-210 is ordinarily present in the mixed layer at less than equilibrium concentrations, suggesting rapid biological removal of this nuclide. Particulate matter is enriched in Po-210, with Po-210/Pb-210 activity ratios greater than
1.0, similar to those reported for phytoplankton. Box-model calculations yield a 2-y residence time for Pb-210 and a 0.6-y residence time for
Po-210 in the mixed layer. These residence times are considerably shorter than the time calculated for turnover of particles in the mixed layer (about 0.1 y). At depths of 100-300 m, Po-210 maxima occur and unsupported Po-210 is frequently present. Calculations indicate that at least 50% of the Po-210 removed from the mixed layer is re-cycled within the thermocline. Similar calculations for Pb-210 suggest much
lower re-cycling efficiencies.
Comparison of the Pb-210 distribution with the reported distribu-tion of Ra-226 at nearby GEOSECS stadistribu-tions has confirmed the widespread existence of a Pb-210/Ra-226 disequilibrium in the deep sea. Vertical profiles of particulate Pb-210 were used to test the hypothesis that Pb-210 is removed from deep water by in situ scavenging. With the exception of one profile taken near the Mid-Atlantic Ridge, significant vertical gradients in particulate Pb-210 concentration were not observed, and it is necessary to invoke exceptionally high particle sinking
-12-proposed that an additional sink for Pb-210 in the deep sea must be sought. Estimates of the dissolved Pb-210/Ra-226 activity ratio at depths greater than 1,000 m range from 0.2 to 0.8 and reveal a system-atic increase, in both vertical and horizontal directions, with
increasing distance from the sea floor. Th'is observation implies rapid scavenging of Pb-210 at the sediment-water interface and is consistent with a horizontal eddy diffusivity of 3-6 x 107 cm2/s. The more reactive element Po, on the other hand, shows evidence of rapid in situ scavenging. In filtered sea water, Po-210 is deficient, on the average, by ca. 10% relative to Pb-210; a corresponding enrichment is found in the particulate phase. Total inventories of Pb-210 and Po-210 over the entire water column, however, show no significant departure from secular equilibrium, and reliable estimates of particle sinking rates cannot be made.
Thesis Supervisor: Derek W. Spencer
Title: Senior Scientist, Department of Chemistry, Woods Hole Oceanographic Institution, Woods Hole, Massachusetts
CHAPTER I INTRODUCTION
The distribution of a substance in the ocean is influenced by the mechanisms of its introduction and removal, by water motions and by the
extent of its incorporation and transport in particulate phases. Measurements of both natural and artificial radionuclides offer some
unique insights into these processes. This thesis describes the use of the natural radiotracers Pb-210 (t 1/2 = 22.2 y) and Po-210 (t 1/2 = 138.4 d), which are members of the natural uranium decay series
(Figure I.1), in evaluating aspects of the supply, transport and removal of these elements in the ocean. The choice of these particular radio-nuclides was based on earlier reports in the-literature which indicated
that their half-lives are long enough for measurable radioactive disequilibria to be maintained by processes operating in the oceans, but short enough that their activities in sea water can be measured with reasonable ease. A second advantage, which these tracers have in
common with several other members of the natural decay series, is that they are supplied to the oceans principally by in situ decay of their parent nuclides (an exception being Pb-210 in the mixed layer, most of which is formed in the atmosphere), and their rates of supply can thus be accurately determined.
Only two modes of supply of Pb-210 to the oceans need to be considered: deposition from the atmosphere and production by radio-active decay of Ra-226 in situ. Supply of Pb-210 by rivers is probably
-14-Fr
4-77Rn-222
Rn
3-825_At
5-48Po-21 8 Po-214 Po-210
Po -4 3:05 m 1-6 0s 38-4 d C Bi-214 C" Bi-210 6-0 71.- -08 53 oB v197 m p5-0 d& Pb-214 Pb-210 Pb-206
Pb
26-8 m 20-4 y SableTI.
Figure I.1unimportant, because Pb-210 is rapidly removed from river water (Goldberg, 1963) and appears to be trapped efficiently in estuaries (L. K. Benninger, personal communication). '.The presence of Pb-210 in the atmosphere results from decay of Rn-222, a noble gas which escapes from continental surfaces (Israel, 1951), the marine contribution being
insignificant (Wilkening and Clements, 1975). There was some early speculation in the literature that significant quantities of Pb-210 may have been formed during periods of nuclear weapons testing (Jaworowski, 1966; Peirson et al., 1966). More recently, however, measurements of Pb-210 in soil and sediment samples from the Pacific Proving Grounds
(Beasley, 1969) and in stratospheric air samples collected in the Northern Hemisphere during early 1963 (Feely and Seitz, 1970) have failed to show Pb-210 concentrations above those considered to be
natural background levels.
Following production from radon decay, principally in the troposphere, Pb-210 atoms become rapidly attached to aerosol particles (Burton and
Stewart, 1960; Junge, 1963), which, according to the most recent esti-I
mates, have a residence time of less than one week (Poet et al., 1972; Moore et al., 1973; Martell and Moore, 1974). It is generally presumed that Pb-210 is delivered to the earth's surface mostly by rain (Blifford et al., 1952), but Lambert and Nezami (1965) have indicated that 50% of the total delivery may be in the form of dry fallout.
There are no measurements of Pb-210 deposition rates over the oceans. Burton and Stewart (1960) calculated a flux of 0.37 dpm/cm2-y
-16-on the basis of Pb-210 c-16-oncentrati-16-ons measured in rain over the United Kingdom. Israel's (1951) estimate of the global radon emanation rate gives a mean rate of Pb-210 delivery of about 0.4 dpm/cm2-y. Lambert and Nezami (1965) speculated that Pb-210 delivery rates should depend strongly on latitude, and they produced a curve similar to that for artificial fallout, with maximum rates of delivery occurring at mid-latitudes in both hemispheres. Corresponding latitudinal variations in the Pb-210 concentration of surface sea water were reported by Tsunogai and Nozaki (1971), but these variations were later shown to be better correlated with the distribution of arid land areas, which are the
strongest sources of atmospheric radon (Nozaki and Tsunogai, 1973).
Longitudinal variations were small, and it was concluded that atmospheric Pb-210 is rapidly transported over the oceans. Turekian et al. (1974), however, argued that Pb-210 concentrations in surface sea water do not bear a direct relation to the rate of supply from the atmosphere but depend also on the rates of biological production in the surface water.
It is not possible to assume a precise value for the rate of Pb-210 deposition over the oceans, but it is probably safe to consider limits of 0.2 and 1.0 dpm/cm2-y for most of the Northern Hemisphere except at very high latitudes. This range should be compared with the rate of
in situ production of Pb-210 from decay of Ra-226, which is about 1.5 dpm/cm2-y for a 4,000-m water column in the North Atlantic. An evaluation of the atmospheric Pb-210 flux for a particular region of the North Atlantic will be made in Chapter IV, and the significance of this
flux to the deep-water Pb-210 budget will be considered in Chapter V. Because of the short residence time of tropospheric aerosols, the rate of Po-210 production in the atmosphere is relatively small. From Po-210/Pb-210 activity ratios in air and rainwater (Burton and Stewart, 1960; Lambert and Nezami, 1965; Poet et al., 1972), it can be seen that the Po-210 flux from the atmosphere should be approximately 10% of the Pb-210 flux. It can be shown from the results of other investigators, and it will be further demonstrated in Chapter IV, that the delivery of Po-210 from the atmosphere can be neglected in considering material balances of this nuclide in the oceans. Moreover, Turekian et al.
(1974) postulated that Po-rich particles may be released from the sea surface, thus partially balancing the downward flux of Po-210 produced
in the atmosphere. Support for this hypothesis was given by Lambert et al. (1974), who measured Po-210/Pb-210 activity ratios that
occasionally exceeded 1.0 in air samples collected in Antarctica. High ratios were observed most frequently when the ice shelf was the narrowest, i.e., when their sampling station was closest to the presumed marine
source.
The fate of Pb-210 that enters the sea surface was first examined by Rama et al. (1961), who measured Pb-210 concentrations in surface sea water from the northwest Pacific. They took the annual flux of Pb-210 to the sea surface to be 0.5 dpm/cm2 and pointed out that this was much larger than the rate of Pb-210 production from decay of Ra-226
-18-calculation led to a 2-y residence time for Pb-210 in the mixed layer. Similar estimates have been given by subsequent authors (Shannon et al., 1970; Nozaki and Tsunogai, 1973). The longer residence times calcu-lated by Turekian et al. (1974) are probably incorrect (Kharkar et al., 1975).
Shannon et al. (1970) measured Pb-210 and Po-210 in sea water and plankton collected off southwest Africa. Activity ratios Po-210/Pb-210
in surface sea water averaged 0.5, indicating rapid removal of Po-210. Both phytoplankton and, to a larger extent, zooplankton were enriched in Po-210 relative to Pb-210. Average concentration factors (g sea water equivalent to 1 g wet plankton) for Pb-210 and Po-210 in phytoplankton were 890 and 5400, respectively. For zooplankton the concentration factors were 870 for Pb-210 and 20,000 for Po-210. A similar food-chain magnification of Po-210 concentrations in marine organisms has also been noted, with some exceptions, by Beasley et al. (unpublished manuscript). The greater enrichment of Po-210 in plankton can be used to explain the more rapid turnover ratq of this nuclide in surface sea water (Shannon et al., 1970; Turekian et al., 1974).
Rama et al. (1961) assumed that Pb-210 removed from the surface ocean is re-dissolved upon entering the deep sea. This supply of Pb-210 would be relatively small compared to the in situ production by decay of Ra-226 in the deep water, and they concluded that Pb-210 was essentially in secular equilibrium with Ra-226 in these waters. More recently, however, Craig et al. (1973) discovered a pronounced
deficiency of Pb-210 in the deep sea, averaging 50% of the equilibrium value. This condition of radioactive disequilibrium was present in profiles from both the Atlantic and Pacific and was concluded to be a worldwide phenomenon. It was suggested that Pb-210 in the deep ocean
is continually removed as a result of in situ scavenging by sinking particles, a concept that had earlier been discussed by Goldberg (1954) and Krauskopf (1956). Application of a vertical advection-diffusion model, with allowance for radioactive growth and decay, yielded a 54-y
residence time for Pb-210 in the deep Pacific. A similar value (about 40 y) resulted from a box-model calculation for the Atlantic. Subse-quent investigators have confirmed the existence of a Pb-210/Ra-226 disequilibrium in the deep ocean (Tsunogai et al., 1974; Applequist, 1975).
Despite the importance that has been attached to the role of particulate matter in transporting Pb-210, Po-210 and certain other radionuclides to the sediments, very few radio-chemical analyses of this material have been reported. As a consequence there exist in the
literature contradictory interpretations of residence times calculated on the basis of daughter/parent activity ratios measured in unfiltered sea water samples. Bhat et al. (1969) discovered a Th-234/U-238
disequilibrium in surface sea water and used their data to calculate a Th-234 sinking velocity. Matsumoto (1975) pointed out that this
interpretation was incorrect, because they had assumed all of the Th-234 to be in particulate form. Craig et al. (1973) assumed that only a
-20-small fraction of the total Pb-210 in sea water is contained in particulate phases and that their 54-y residence time for Pb-210 in the deep water applied to the transfer of Pb-210 from solution to the sinking particles. It was implied that the particles must sink very rapidly. Tsunogai et al. (1974), on the other hand, obtained similar data but interpreted them in terms of a slow settling velocity of 32 m/y. These two interpretations are clearly not compatible, because they
imply very different distributions of Pb-210 between dissolved and particulate phases.
Recent measurements by Applequist (1975) showed that indeed only 5-10% of the Pb-210 in the deep sea is contained in particles greater than 0.4-micron diameter, as assumed by Craig et al. (1973). The model of Craig et al. (1973) predicts that particulate Pb-210 activities should increase with depth in the water column. Applequist (1975) showed that such a distribution does occur at two stations in the Pacific but did not determine the particle sinking velocities required to satisfy the model. Data on dissolved and particulate Pb-210 distri-butions obtained during this investigation from several stations in the Atlantic are used in Chapter V to further test the in situ scavenging hypothesis.
Aside from the analyses of surface sea water reviewed above, the behavior of Po-210 has remained largely unexplored. During this
investigation Po-210 concentrations in filtered sea water and particu-late matter were determined in several vertical profiles. These results,
which are discussed in Chapters IV and V, have led to significant
conclusions concerning the rates at which some heavy elements may be
-22-CHAPTER II EXPERIMENTAL METHODS
A. Shipboard procedures
Samples collected for this investigation were taken with 270-1 stainless-steel Gerard barrels or pairs of 30-1 PVC Niskin bottles spaced 5-10 meters apart on the wire. Suspended matter was sampled by pumping (Eastern Industries Model MD-50 magnetic drive pump) 40 to 100
liters of sea water through 142-mm diameter, 0.4-micron pore-size Nuclepore filters. For samples collected with the Gerard barrels, filtration was performed by pumping directly from the sampler. In most cases when 30-1 Niskin bottles were used on Meteor-32, it was necessary first to transfer the samples to plastic drums before filtering. Fil-tration was ordinarily completed within one to three hours following collection. Total volumes of water filtered were measured with
Hersey-Sparling water meters installed downstream from the filter holders. Except for unavoidable, brief exposure to bronze parts of the flow meters, the water samples contacted only fittings made of various plastic
materials.
Twenty-liter aliquots of filtered water were drawn into plastic vessels containing enough concentrated HCl to bring the pH within the range 1.5-2.0. The samples were then spiked with known amounts of Po-208
(several dpm) and stable Pb (several milligrams) tracers and stored for later treatment. Excess water was removed from the filters by
applying mild suction, and the filters were folded and sealed in plas-tic bags.
B. Analytical methods 1. General
All activity measurements were made. by alpha-spectrometry of the Po isotopes (Po-208, 5.11 MeV; Po-210, 5.30 MeV). Samples were
processed with Pb and Po tracers present, and chemical yields were always monitored. Following an initial separation and counting of Po, samples were stored for several months during which Po-210 was
re-generated by decay of Pb-210. Determination of this newly produced Po-210 gave a measure of the Pb-210 present in the sample, which allowed the initial Po-210 measurement to be corrected for radioactive growth or decay between the time of sampling and the time of Po-210 separation from its parent. An effort was made to minimize this delay in order to preserve Po-210-Pb-210 activity differences, which decrease by a factor of two for every Po-210 half-life (138 days).
2. Extraction procedure
The procedure for extracting Pb and Po isotopes from sea water was based on a method developed by Boyle and Edmond (1975). Cobalt nitrate solution was added as carrier to each acidified sample
(pH 1.5-2.0) in an amount sufficient to make the cobalt concentration 0.5 mg/l. A solution of ammonium pyrrolidine dithiocarbamate (APDC) was then added (50 mg APDC per liter of sample) to form a mixture of the insoluble metal chelates. The resulting chelates precipitate as large particles due to their high concentration and are readily collected by filtering the suspension through 0.45-micron Millipore filters after a
-24-20-30 minute reaction time. Yields nearly always exceeded 90% for both Pb and Po. There was some tendency for the particles to cling to the surface of the reaction vessel, but the losses were small enough that no attempt was made to recover particles lost in this way. It was found convenient to carry out the precipitations in disposable plastic
Cubi-tainers (Hedwin Corp.), which are also satisfactory for short-term sample storage. Experience on Meteor-32 demonstrated that this pro-cedure is easily carried out at sea, the total processing time being about 1-1/2 hours for a batch of six samples.
3. Sample dissolution
Each Millipore filter containing the sea water extract was placed in a 50-ml Teflon beaker and digested on an electric hotplate with a 3:2 mixture of concentrated HNO3 and 70% HC10 4. Total digestion/ evaporation times were 8-12 hours, and both the filter and organic
ligand were readily oxidized. The resulting residue was dissolved in 2N HC1 and held for subsequent Po separation.
For treatment of the Nuclepore filters, containing the particulate matter, conventional dry ashing methods were avoided because of the almost certain loss of volatile Pb and Po at high temperature (Gorsuch, 1959; Figgins, 1961). The polycarbonate membrane is resistant to direct attack by acids, making wet combustion difficult, but it was found that the filters could be broken into less resistant particles by soaking for a few hours at room temperature in concentrated NH3 solu-tion. After gentle evaporation of the ammonia, a clean oxidation could
usually be achieved by acid digestion. Treatment in a low-temperature asher using an RF-generated oxygen plasma was attempted but was found to offer little advantage. Tracers were added at the start of the acid digestion and allowed to equilibrate with the sample for a few hours at
low heat before the higher temperatures required for destruction of the filter were applied. Siliceous residues were removed by addition of a few drops of HF. Occasional sample losses were experienced due to spattering in the final stages of acid digestion, but tracer
equilibra-tion should have occurred by that time. Otherwise tracer recoveries were nearly quantitative.
4. Plating procedure
Separation of Po and source preparation for alpha-spectrometry were performed simultaneously by spontaneous deposition on silver discs
under conditions specified by Flynn (1968), with the exception that plating times were increased to four hours to assure quantitative depo-sition. A plot of efficiency versus time is given in Figure II.1. Plating efficiency was determined in two ways: 1) by adding a known quantity of Po-208 tracer and determining the activity deposited and 2) by replacing the silver disc with a clean one and re-plating for the same length of time, the plating efficiency being given by
Efficiency = (1 - CPM2/CPMl) x 100%,
where CPM1 and CPM2 are the count rates yielded, on the same counter, during the first and second plating periods, respectively. The former method utilized prepared solutions, while the latter employed real sample material. Total deposition is seen to require three hours, and
75
25
0 50 100 150 200 250
T/ME (min.)
----Figure II.1. Polonium plating efficiency as a function of time.
periods of four hours, which were routinely used, were shown by repeated tests to yield better than 99% efficiency.
It is important that neither Bi-210 nor, especially, Pb-210 be co-deposited with Po. Recoveries of Pb and Bi added to plating solu-tions were measured by atomic absorption after plating for four hours, and no loss of either element was detected. A further test for the presence of unwanted Pb-210 was made by re-counting several of the Po sample mounts after a period of about one year. First and second counts are compared in Table II.1. The activity expected at the time of the second count is calculated as the result of simple decay. The excess found is an approximate measure of the Pb-210 present in the source
(actually about 15% lower, because supported Po-210 is not fully grown). Calculated amounts of Pb-210 are in all cases less than 2% of the amounts originally present in the sample solution at the time of plating. There-fore, significant errors should not result if counting is performed
within six months of plating. In practice such a delay was seldom exceeded.
After the initial plating, sample solutions were re-acidified and stored in polyethylene bottles for at least six months. A second portion of Po-208 tracer was added, and the samples were again plated and counted.
5. Counting procedure
All counting was by alpha-spectrometry of the Po isotopes with silicon surface-barrier diode detectors (Ortec; Princeton Gamma-Tech). Each detector was mounted inside a stainless-steel vacuum chamber
-28-TABLE II.1
Test for the presence of Pb-210 in Po sample mounts
Po-210 (dpm) Count 2 (observed) Count 2 (expected) 1.00 ± .05 .91 ± .05 .89 ± .05 .63 ± .04 .49 ± .03 .56 ± .03 .17 + .02 .13 ± .01 .10 + .01 .07 + .01 .07 + .01 .09 + .01 .14 ± .01 .12 ± .01 .12 ± .01 .08 ± .01 .06 ± .01 .07 ± .01
Errors are calculated on the basis of counting statistics only. Sample At (days) Count 1
C-163 C-164 C-165 C-167 C-168 C-169 Excess 390 408 408 404 404 404 +.03 +.01 -.02 -. 01 +.01 +.02
(A. Gordon, designer) containing a Plexiglas sliding-tray sample holder. A vacuum sufficient to prevent loss of resolution by alpha-particle scattering was maintained by continuously pumping with a Welch Duo-Seal rotary oil vacuum pump. The detectors had a sensitive area of 300 mm2 and a depletion thickness of 100 micron, which is sufficient to stop all alpha-particles of energy less than 10 MeV. Bias was applied to the detectors by Ortec Model 428 voltage supplies, and signals were ampli-fied with Ortec pre-amplifiers (Models 121 and 124) and main amplifiers of various manufacture (Ortec Model 451, Canberra Model 1416-B, Tennelec Model TC202BLR). Following amplification the signals originating in each detector were conducted through a multiplexer-router to a
1024-channel pulse-height analyzer, and amplifier gain was adjusted so that each channel corresponded to an energy band of 15-20 keV. Linearity was established by plotting energy versus channel number for various radioisotope standards. This work was begun with two detectors and a Nuclear Data Model 2200 analyzer. During the course of the study, the system was gradually expanded to include eight detectors, and the ana-lyzer was replaced with a Northern Scientific Model NS-710.
A typical spectrum is shown in Figure 11.2. No spectral inter-ferences were ever detected, and none would be expected, because the plating procedure is highly selective (Flynn, 1968), and potential interferences are present at much lower concentrations in sea water. Energy resolution, expressed as full peak width at half-maximum, was about 50-60 keV. Separation of the two Po peaks was ordinarily good
S4k Po- 208 5.11 MeV 300 r FWHM~-50 I 120 keV/
/0
/r
130 CHANNEL NUMBER Po - 210 5.30 MeVJ\1
140Figure 11.2. Typical polonium alpha-spectrum.
200-
100*-oL
110 150 4 __ __ ____ _~_I __ _ _ __ __~_ _...
----but not perfect, and a small correction for tailing of the Po-210 peak into the region of the Po-208 peak was necessary.
Counting times ranged from two to four days per sample. 6. Lead recovery measurement
The amount of added stable Pb tracer remaining in the sample solution after the second plating was measured on a Perkin-Elmer Model 403 atomic absorption spectrophotometer with an air-acetylene flame
under standard conditions specified by the manufacturer. The sample matrix was approximated by mixing, in proper proportions, all reagents
added to samples, and this matrix was used in preparing a set of standard solutions for determining the linear portion of the absorbance-versus-concentration curve. Sample solutions were then diluted with de-ionized water to a standard volume that would bring the Pb concentration into the working range. An aliquot of the original Pb spike solution was diluted in the same matrix and to the same volume and used as a working standard. Readings were made in the absorbance mode, and the standard spike solution was run before .and after each sample in order to
compen-I
sate for instrument drift. The sample matrix solution, with no added Pb, was run as a blank for zeroing the instrument. Lead recovery was obtained directly from the sample/spike absorbance ratio.
C. Corrections and sources of error 1. Sample size
Water samples were ordinarily weighed at the end of each cruise, but in some cases sample size was determined at sea by volume. Weights
-32-were accurate to within 0.5% and volumes to within 3%.
In the case of the particulate samples, total volumes filtered were measured with Hersey-Sparling water meters.. During Meteor-32 a good deal of information was obtained on the performance of these meters by taking readings before and after each 20-1 water sample was drawn. Volumes measured in this manner were then compared with sample weights measured later. It was found that all six meters in use recorded systematically low volumes by amounts ranging from 3-14%, probably because of the low flow rates of only 1-2 liters per minute. Reproducibility for individual meters, however, was relatively good, averaging about 3%. Appropriate corrections have been applied to the analytical results for systematic errors in meter readings.
2. Counting statistics
For individual counts the statistical counting error for the
12
Po-208/Po-210 ratio was estimated as (1/N208 + 1/N2 10) , where N208 and N210 designate the number of counts under each Po peak. For water samples this error was generally in the range 3-5% and for particulate
I
samples 6-8%.
3. Detector background
All of the detectors used in this study were purchased new and had initial backgrounds of less than 0.0005 cpm for both Po-208 and Po-210. The two detectors used at the beginning showed a rise in Po-208 background to about 0.002 cpm due to volatilization of Po under vacuum and its collection by the detector (Sill and Olson, 1970).
Backgrounds for Po-210 showed smaller rates of increase. Periodic checks showed no significant rise above these levels over.a period of two years, nor did the newer detectors show any increase over periods of six months or longer. Because a number of the earlier samples were counted immediately after plating, it is suggested that freshly
deposited Po may be more volatile than Po in samples that have aged for a few days. For all detectors, in any case, background corrections seldom exceeded 1% of the total sample activity.
4. Spectral resolution
Because the two Po peaks could not be completely resolved instrumentally, it was necessary to estimate the degree of overlap by visual examination of the spectra. This correction was made by assuming identical peak shapes and by assuming that the tail on the Po-210 peak does not contribute significantly to the tail on the Po-208 peak. While it is not believed that significant systematic errors arise from peak overlap, random errors associated with the correction can easily amount to a few percent and are at least as important as the simple counting
I
error in limiting analytical precision. A more desirable tracer for such analyses would be Po-209 (4.88 MeV), which would increase the sample-tracer energy difference by more than a factor of two and allow complete resolution of the two peaks. Unfortunately no source of Po-209
-34-5. Blank corrections
A summary of blank determinations is given in Table 11.2. Within counting errors, Pb-210 and Po-210 blanks are nearly equal, as one would expect. Some of the blanks, therefore, were counted only once and are reported as Po-210.
A significant source of contamination is present as an isotopic impurity in the "stable" Pb added as yield monitor, and the value of 0.02 dpm/mg Pb measured for the specific activity of Pb-210 in reagent-grade lead nitrate is in good agreement with measurements reported by Weller et al. (1965) for commercial lead. An uncontaminated Pb spike was obtained from M. Applequist (Scripps Institution of Oceanography) and was used for all but the Meteor-32 water samples. Aliquots of this spike, each containing about 30 mg Pb, were analyzed and found to con-tain no detectable activity. Even smaller amounts than this (3-7 mg) were used for spiking samples.
Results given in the first part of Table 11.2 indicate levels of contamination arising from laboratory procedures only; those in the
I
second part of the table were used to evaluate the probability of ship-board contamination. Samples C-174 through C-177 consisted of de-ionized water from the Meteor shipboard laboratory. Comparison of C-174 and C-175 with C-176 and C-177 indicates that contamination of the water
samples during filtration is unlikely. A blank correction of 0.08 dpm has been applied to all water analyses for which the contaminated spike was used. Otherwise the correction is 0.03 dpm.
TABLE II.2A
Laboratory Blank Determinations
Pb-210 (dpm)- Po-210 (dpm) .10 ± .02 .05 ± .01 None detectec .02 ± .02 .02 ± .01 .01 ± .01 .065 ± .008 .066 ± .008 .051 ± .006 .049 ± .006 Remarks
Procedural blanks for water samples. "Contaminated" Pb spike present (2.3 mg).
Nucleopore filter blanks. No Pb spike added.
Nuclepore filter blanks. "Contaminated" Pb spike present (2.3 mg).
Errors are calculated on the basis of counting statistics only. Measured specific activity of "contaminated" Pb spike:
.020 + .001 dpm Po-210/mg Pb Sample
-36-TABLE II.2B
Shipboard Blank Determinations
Pb-210 (dpm) .08 ± .01 .08 ± .01 .08 ± .01 .05 ± .01 Water Sample C-174 C-175 C-176 C-177 Filter P-137 P-138 P-66 P-67 P-68 P-69 .02 .006 .005 .004 .004 .003 Po-210 (dpm) .08 ± .02 " .10 ± .02 .07 ± .02 .11 ± .02
J
.12 ± .01 .013 ± .005 .021 ± .005' .018 ± .006 .006 ± .002 .004 ± .002. RemarksFiltered, de-ionized water
Unfiltered, de-ionized water Corresponds to C-174 Corresponds to C-175 Subjected to routine handling
Errors are calculated on the basis of counting statistics only. .12 ± .023 ± .024 ± .013 ± .013 ± .010 ±
Samples P-66 through P-70 show that no significant contamination of the filters occurred during routine handling, which consisted of loading and unloading the filter holders and transferring the filters to plastic bags for storage. The only indication of serious contamination is given by P-137, for which the measured value of 0.1 dpm is as much as 50% of the total activity measured in some of the least active samples. The source of this contamination is unknown, and there are, unfortunately, too few data to judge the likelihood of such an occurrence. It should be noted that the Po-210/Pb-210 ratio here is still close to unity.
Because most of the particulate samples that were analyzed show a ratio greater than 2, a possible criterion for diagnosing cases of gross con-tamination would be activity ratios closer to 1. In correcting the analytical data, this last result has been ignored, and a blank correc-tion of 0.015 dpm has been applied to all of the particulate analyses.
In addition to the blank determinations presented in Table 11.2, occasional samples and blanks were processed without the addition of tracers in order to check the possibility of cross-contamination during laboratory processing. The amounts of Po-208 and stable Pb recovered in these cases were undetectable.
6. Errors in Pb recovery measurement
Atomic absorption readings were always made in triplicate, and errors in determining Pb recovery should not exceed 2%.
7. Calibration
All of the analytical results reported here were calculated with reference to two Po-210 standard solutions obtained from the
-38-USAEC Health and Safety Laboratory (Po-210-003-I; Po-210-003-V). The certificates that accompanied these standards reported activities to three significant figures, but there was no-explicit statement of confidence limits. Polonium-208 tracer solution, which derived from a commercial source, was obtained from Yale University. Calibration of this tracer was performed periodically by mixing with the HASL standard and determining the extent of isotope dilution by alpha-spectrometry. Isotopic purity was verified by alpha-spectrometry.
All dilutions of standard and spike solutions were made with 2N HNO3 containing 200 mg Bi/l as carrier to prevent possible loss of Po by adsorption on the container walls (S. E. Poet, personal communi-cation). Storage bottles were made of polyethylene. In two years no changes were observed in the activity of Po solutions other than those attributable to radioactive decay.
It is estimated that isotope ratio measurements for calibration were made with an accuracy of 3%. Comparison of two batches of the HASL Po-210 standard revealed a systematic difference of about 2%.
I
Systematic errors in the analyses reported here are therefore believed to be less than 5%.
8. Errors arising from sample handling
Because this study depends on achieving resolution of total activities into dissolved and particulate components, an effort was made to determine whether transfer from one phase to the other might occur as a result of sample handling. The first indication that such
effects may be significant came when an attempt was made during Meteor-32 to collect a set of replicate samples for establishing analytical preci-sion. For this purpose a 270-1 sample taken with a stainless-steel Gerard barrel tripped at 887 m on Station 23 was used. Because of time
limitations on station, filtration was not begun until a few hours after c retrieval and extended over an additional 10-15 hours. Approximately
equal amounts of sea water were filtered through each of four Nuclepore filters, and six 20-1 aliquots of filtered water were collected. The remainder of the filtered water was retained in plastic drums and later re-filtered. Two water samples and two filter samples were obtained from this second filtration.
Each of the water samples and filters was analyzed individually, and the results are given in Table II.3, where samples are listed in the order in which they were filtered. Although there is no record of the absolute time elapsed between successive filtrations, concentrations of particulate Pb-210 and Po-210 show increases correlated with time.
Corresponding decreases in the amounts measured in the filtered water are just barely detectable, and there appears to be no systematic change in either of the totals obtained by summing dissolved and particulate analyses. Although the increases in individual particulate activities with time are substantial, it is important to no.te that the particulate Po-210/Pb-210 ratios remain virtually constant.
An effort was made to reproduce these results and obtain an esti-mate of the rate of solution-to-particle transfer in a similar experiment
S4o
TABLE 11.3
Analytical Results for Replicate Samples, Meteor-32
Pb-210
/ (dpm/100 kg)
Diss. Part. Tot. Sample
Po-210
/ (dpm/100 kg)
Diss. Part. Tot.
Po-210/Pb-210 Diss. Part. Tot. * 1 * 2 7.4 6.6 8.4 7.6 3 6.2 4 6.3 Mean Coeff. Var'n, Second filtration 5 6.8 6 5.9
Mean counting errors:
.41 7.8 " 7.0 .33 . 8.7 " 7.9 .58 .6.8 .75 7.0 --- 7.5 --- 9.8% .08 .07 Diss. Diss. Part. Part. 6.9 6.0 7.4 8.1 8.5 7.0 7.5 6.8 5.8 5.7 1.1 8.5 " 9.2 .9 9.4 " 7.9 1.4 1.9 8.9 8.7 8.8 6.1% .8 6.6 .4 6.1 Pb-210, 4.0% Po-210, 6.3% Pb-210, 7.7% Po-210, 12.9%
*Duplicate aliquots of filtered water taken.
2.6 2.7 1.0 1.2 1.0 .9 1.2 1.1 1.1 1.3 1.1 " 1.0 2.4 2.6 1.3 1.2
performed by J. Bishop during R/V Atlantis II Cruise 85. Six 30-1 Niskin bottles, spaced five meters apart on the wire, were tripped at 175-200 m and immediately brought aboard. One bottle was sampled upon retrieval, and the others were sampled at 2, 4, 8, 16 and 32 hours. A 10-1 sample of unfiltered water was drawn first, and the remaining con-tents were then filtered through 47-mm, 0.4-micron Nuclepore filters. Only the unfiltered water was saved for analysis.
Analytical results are presented in Table 11.4. The possibility of a depth effect cannot be altogether ruled out, but the results are
qualitatively in agreement with the earlier findings from Meteor-32. Particulate activities increase with time, while totals and Po-210/ Pb-210 ratios show little change. Figure 11.3 is a plot of particulate activity versus time. The data are rather badly scattered, partly because of the small volumes (12-17 1) filtered, and are not really adequate to define a particular functionality. A crude approximation of solution-to-particle transfer rates is attempted by making a linear least-squares fit. The estimated rates are 0.019+0.008 (dpm/100 kg)/hr for Pb-210 and 0.013+0.007 (dpm/100 kg)/hr for Po-210. These rates correspond to increases over the initial particulate activity of 5+2% and 4±2% per hour for Pb-210 and Po-210 respectively. Activities in the dissolved phase would be reduced by about 0.2+0.1% per hour.
Reasons for this apparent transfer are not understood. Because the observed rates of change are much higher than those inferred for in situ conditions, and because little fractionation of Pb-210 and Po-210
TABLE 11.4
Results of Delayed Sampling Experiment, AII 85
Time (hr) Pb-21 0 dpm/100 kg Tot. Part. Po-21 0-dpm/100 kg Tot. Part. Tot. Po-210/Pb-210 Tot. Po-210/Pb-210 8.0 + .6 8.6 ± .6 8.3 ± .6 7.1 ± .6 8.5 ± .6 8.9 ± .7 Mean Coeff. Var'n. Mean counting error .52 + .22'+ .38 + .86 + .60 + 1.02 -+ .07 .03 .05 .08 .07 .10 8.2 7.3% 5.2% 10.2 ± .7 8.2 ± .6 8.4 ± .6 9.8 ± .7 9.2 ± .7 7.9 ± .6 9.0 10.0% 5.3%
Errors are calculated as in Section II.D.1 and Appendix II.B
Date: 21 October 1974 Position: 39.00N 69.30W Sampling Depth: 175-200 m .37 ± .05 .19 ± .03 .27 ± .04 .69 ± .06 .39 ± .05 .72 ± .11 1.3 1.0 1.0 1.4 1.1 .9 ~ ___ _
1.0
E
{.
o
Pb-210
o Po-210
10
20
30
TIME (hrs)
Figure 11.3. Changes with time of the particulate Pb-210 and Po-210 concentrations in sea water samples.
.81-.6L
1~
_ __ __ 401 01 1001
-44-was observed, the transfer would seem to be induced by disturbance of the sample. It is possible that increases in temperature or turbulence might significantly accelerate aggregation of particles smaller than 0.4 micron or their collection by larger particles (Stumm and Morgan, 1970). The fact that particulate Pb-210 and Po-210 were recovered from water that had previously been filtered suggests that particle formation (Sheldon et al., 1967), possibly resulting from stimulation of bacterial growth, may be a factor. These samples were kept in fairly opaque containers between filtrations, so phytoplankton growth is not likely to have been important. It should also be noted that particles collected during the second filtration were greatly enriched in Po-210 relative to Pb-210. This behavior was unlike that of the samples that were only filtered once, in which no relative enrichment of Po-210 was observed with time.
It is likely that more than one process is responsible for the observed changes in the samples.
Whatever the causes might be, the immediate concern for the present study is the magnitude of the effect. For all of the samples used in this investigation, filtration was completed in less than three hours following collection. Solution-to-particle transfer during this delay should not exceed 20% of the initial particulate activity or 1% of the dissolved activity. Because total activities show no apparent change with time, it is concluded that no losses to other surfaces occur and that total activities are unaffected by ordinary delays in sampling.
Additional experiments have been performed to measure the adsorption of Po by Nuclepore and Millipore membranes. Filters immersed for two hours in filtered sea-water spiked with Po-208 retained negligible amounts of tracer. In a second experiment Woods Hole surface sea water was
filtered through pairs of filters, in separate holders, arranged in series. Very low flow rates were experienced with this arrangement, and volumes could not be recorded due to stalling of the water meter. It took four hours to filter less than 10 liters through the Nuclepore pair. Approximately 30-40 liters were filtered through each pair of Millipore filters in about 1 hour. Table 11.5 compares activities measured on the first and second filters. Amounts retained by the second filter were small (comparable to the analytical blank) but detectable, and may have resulted from adsorption. It is more likely, however, that the effect results from retention of particles smaller than the nominal pore size of the filters (Cranston and Buckley, 1972). It is concluded that adsorption of Po-210 by membrane filters does not produce a significant bias in the discrimination between dissolved and particulate phases. On the basis of tracer experiments, Applequist (1975) reached a similar conclusion in the case of Pb-210. Because of uncertainty in the magni-tude of the effects described in this section, no corrections for them have been applied to the analytical data.
D. Quality of the data I. Precision
-46-TABLE 11.5
Po-210 Collected on Filters Arranged in Series
Sample .4 5V Millipore (A) .45V Millipore (B) .4v Nuclepore ---- Po-210 (dpm)-First Second 1.2 ± .1 .02 ± .01 1.4 ± .1 .01 ± .01 .29 ± .03 .03 ± .01 Second/ Filtration First (%) Time 2+1 1 hr. 1± 1 hr. 10 + 3 4 hrs.
being lack of complete spectral resolution, the precision of the
analy-ses reported here is not as good as estimates based on simple counting
statistics alone would indicate. This may be seen by examining the
total activity measurements obtained on replicate samples given in
Tables 11.3 and 11.4. In evaluating precision from these sets of
analyses, it must be assumed that the total activity is independent of
the time delay. It is estimated that a cumulative 5% error arises from
causes other than random fluctuations in the count rate. Precision of
individual analyses was estimated by the approximate formula ((.05)2 + (C.E.)2 1/ 2 x 100%, where C.E. is the statistical counting error of the
Po-208/Po-210 ratio as evaluated in section II.C.2. Additional
calcu-lations, detailed in Appendix II.B are required to estimate precision of
the Po-210 analyses. 2. Intercalibration
Two Pb-210 intercalibration studies have been performed in
conjunction with M. Applequist and Y. Chung of Scripps Institution of
Oceanography. The S.I.O. measurements employed beta-counting of the Pb-210 daughter Bi-210 and were based on a Pb-210 standard obtained
from a private source. Lead recoveries were determined gravimetrically.
In the first set of comparative measurements (Table 11.6), sample
mounts prepared and counted at S.I.O. were sent to W.H.O.I., where they
were re-dissolved, spiked with Po-208 tracer, plated and alpha-counted.
The Pb-210 activity was calculated on the assumption that Po-210 had
been completely removed during sample purification at S.I.0. With the
-48-TABLE II.6
Results of Particulate Pb-210 Intercalibration GEOSECS Pacific Station 201. Particulate
Pb-210 given in dpm/.100 kg W.H.O.I. .16 ± .01 .37 ± .02 .32 ± .02 .51 ± .03 .53 ± .03 S.I.O.-W.H.O.I. W.H.O.I. x 100% +12.5 -16.2 - 9.4 -25.5 +15.1 S.I.O. 12 389 786 1183 1706 .18 ± .08 .31 ± .13 .29 t .02 .38 ± .02 .61 ± .07
TABLE 11.7
Results of Dissolved Pb-210 Intercalibration GEOSECS Pacific Station 320. Dissolved
Pb-210 given in dpm/100 kg S.I.O. Not measured 8.5 + 1.5' 8.2 + .8 9.6 + 1.4 9.4 + 1.4 10.0 + 1.5 8.2 + .8 8.9 + 2.2 10.8 ± .5 13.6 ± .6 17.0 ± .7 17.7 ± .7 17.0 ± .7 16.2 ± .7 16.4 ± .6 15.9 ± .6 16.7 ± .6 r--E r r- r'---tL_ r' W.H.0.I. 7.7 ± .6 9.3 + .6 9.8 ± .7 9.3 + .7 9.6 ± .7 8.5 + .6 8.8 + .6 9.6 + -.7 11.1 + .7 10.9 + .7 17.8 ± 1.2 20.3 + 1.2 19.4 + 1.1 18.6 ± 1.1 19.1 ± 1.4 (21 +3 )* 17.8 + 1.0 S.I.O.-W.H.0O.I. W.H.O.I. x 100% - 8.6 -16.3 + 3.2 - 2.1 +17.6 - 6.8 - 7.3 - 2.7 (+24.8)? - 4.5 -12.8 -12.4 -12.9 -14.1 - 6.2
due to sample leakage Depth (m) 0 77 128 204 254 505 704 802 1002 1504 2054 2304 2605 3004 3502 3805 4107 Large error
-50-mean percent difference for all five samples indicates S.I.O. to be lower than W.H.O.I. by 5±8%.
During the pacific GEOSECS expedition,.a set of replicate water samples'was collected at Station 320. Analyses by M. Applequist and Y. Chung of S.I.O. are compared in Table II.7 with those of the dupli-cate set performed at W.H.O.I. The first seven S.I.O. results are based on preliminary counting only. The 3805-m W.H.O.I. result is highly
uncertain, because the sample container had leaked, and only a few liters were available for analysis. The W.H.O.I. result at 1504 m appears to be spuriously low. When all of the other results are compared, the S.I.O. results are again seen to be lower than the W.H.O.I. values by an average amount of 6+2%. When only the final S.I.O. counts are con-sidered, the discrepancy is 11+2%.
It is not believed that systematic errors arising from the proce-dures used in either laboratory should produce a discrepancy larger than a few percent. The most likely cause of the disagreement is in the different standards used for calibration by the two groups, and it is intended that a direct cross-check of standards will be performed.
Appendix II.A Details of the Analytical Procedure for Pb-210 and Po-210
1. Sample handling -- shipboard
a. Acidify Cubi-tainer (5 or 6 gallon) with 40 ml concentrated, reagent-grade HC1.
b. Filter as large a volume of sea water as possible (20-1 mini-mum). Begin filtration as soon as other sampling is completed. For this study 0.4-micron Nuclepore filters were used. For future work it is recommended that 0.45-micron Millipore filters be used, because they are more easily oxidized. c. Draw about 20 1 filtered sea water into pre-acidified
Cubi-tainers.
d. Spike water samples with Po-208 and activity-free lead tracers. A few milligrams of stable lead is sufficient to overwhelm any
natural or contaminant background levels. The amount of Po-208 tracer added should be approximately four times the expected sample activity.,
e. Apply mild suction to remove excess water from the filters. Fold the filters to contain the particulate matter and store in plastic bags.
f. Check Cubi-tainers for leakage and then store. If rough handling is anticipated, sturdier containers are advisable. g. Weigh samples at the earliest opportunity. If co-precipitations
-52-2. Pre-concentration (after Boyle and Edmond, 1975) a. Prepare reagents:
(1) Cobalt nitrate in deionized water to make 50 mg Co/i. (2) APDC in deionized water, 5 g/l.
b. Add 10 ml cobalt nitrate for each liter of sea water and mix. c. Add 10 ml APDC for each liter of sea water and mix.
d. Wait 15-20 minutes and filter suspension through 142-mm, 0.4-micron Millipore filter (vacuum filtration).
e. Allow filter to be sucked dry, fold in half, and store in plastic bag. Ignore small amounts of precipitate that may adhere to walls of the container.
3. Sample dissolution
a. Digest Millipore filters in Teflon beakers with 3:2 mixture of HNO3 (concentrated) and HC104 (70%). Use as little of the
acid mixture as possible, adding in 10-ml increments as required.
b. Soak Nuclepore filters in concentrated NH40OH at room tempera-ture for several hours until filter is broken into small particles. Gently evaporate to remove NH3 and proceed with acid digestion as above.
c. For particulate matter samples, add tracers at start of acid digestion, and use a few drops of HF to destroy siliceous material.
-53-e. Cool and dissolve residue in 2N HC1. 4. Plating procedure (after Flynn, 1968)
a. Prepare reagents in deionized water:
(1) Bismuth carrier (10 mg Bi/ml) -- 2.32 g Bi(NO
3) 3-5H20 in 5 ml concentrated HNO3 and diluted to 100 ml.
(2) 20% w/v hydroxylamine hydrochloride (3) 25% w/v sodium citrate.
b. Transfer samples to 250-mi beakers and dilute to 50 ml with 2N HC1.
c. Add 5 ml hydroxylamine hydrochloride, 2 ml sodium citrate and 1 ml bismuth carrier.
d. Adjust pH to 2.0 with concentrated NH40H.
e. Stir on magnetic hotplate-stirrer and heat to 85-900C. f. Load clean silver disc in Plexiglas holder, immerse in the
sample solution, and remove trapped air bubbles. g. Plate at 85-900C for four hours.
h. Rinse Plexiglas holder with 2N HC1 into beaker, remove disc, rinse disc with deionized water and methanol, and store disc in plastic box for counting.
i. Transfer contents of beaker to polyethylene bottle, rinsing with 2N HC1.
J. After six months' storage or longer, transfer sample to 250-ml beaker, re-adjust pH, re-plate, and count. Hold solu-tion for lead recovery.
-54-5. Lead recovery measurement
a. Transfer sample solution to volumetric flask and dilute to
appropriate volume for flame atomic absorption analysis.
b. Dilute original lead spike solution to the same volume and
with the same reagents added as for samples. Use this
solu-tion as a working standard.
c. Operate Perkin-Elmer 403 under standard conditions given in
manufacturer's handbook and alternate absorbance readings of
sample and spike solutions. All sample readings should be
made in triplicate.
Appendix II.B Radioactive Growth and Decay Calculations
The computations required to convert raw counting data into absolute
sample activities at the time of collection are described below. Each
of the necessary steps is listed and explained. In practice the
calcu-lations were performed automatically on a Wang Model 520 programmable
calculator. The following assumptions are made in performing the
calculations:
1.) There is no change in the Pb-210 activity of a water sample
between the time of collection and the time of
co-precipita-tion. This time never exceeded 2 months.
2.) At the time of co-precipitation, Ra-226 remains in solution
and is not recovered. Thereafter Pb-210 is unsupported and
decays according to its half-life.
3.) Lead-210 in particulate matter is entirely unsupported. (Because the decay correction for Pb-210 rarely exceeds 3%, assumptions 1- need only hold approximately.)
4.) The production of Pb-210 from atmospheric Rn-222
equili-brating with the stored sample solutions is negligible. This
assumption can be verified by simple calculation.
5.) The short-lived Pb-210 daughter, Bi-210, is at all times in
secular equilibrium with Pb-210 in the sample. For Po-210
growth periods of six months or longer, this assumption need
-56-6.) Procedural losses of Pb and/or Po occur only at the time of co-precipitation for water samples or only at the time of sample dissolution for particulate matter samples. This assumption is important only if there occur large differ-ences in recovery rates for Pb and Po and if there is a delay between sample dissolution or co-precipitation and the first plating step. In practice the recoveries were nearly the same for both elements.
7.) Polonium is completely removed from the sample solution during the first plating step. This assumption was verified experimentally (Section II.B.4).
Calculations for water samples
The quantities Pb(n) and Po (n) refer to activities. Decay con-stants for Pb-210 (xPb) and Po-210 (xpo) are taken to be 0.0000855 d-l and 0.0050083 d-1, respectively, corresponding to half-lives of 22.2 y and 138.4 d.
1.) From the second count determine the Po-210 activity generated in the sample at the time of the second plating, designated Pb(l). This is done by correcting the Po-208 and Po-210 count rates for background and then correcting each for simple decay back to the time of the second plating step. The corrected ratio cpm Po-210/ cpm Po-208 is then multiplied by the amount of Po-208 spike (dpm) added at the time of plating.
2.) Calculate the Pb-210 activity in the sample at the time of the first plating step:
Pb(2) = (Xpo Pb)Pb(l)/XPofexp(-Pb t 2)-exp(-Xpot 2)] = 0.9829 Pb(l)/Eexp(-0.0000855 t
2)-exp(-O.0050083 t2)], where t2 is the time, in days, between the first and second
plating steps.
3.) Calculate the Pb-210 activity in the sample immediately following co-precipitation:
Pb(3) = Pb(2)/exp(-Pb tl)
= Pb(2)/exp(-0.0000855 tl ),
where t1 is the time, in days, between co-precipitation and the
first plating step.
4.) Correct for losses during co-precipitation: Pb(4) = Pb( 3)/Rpb,
where RPb is the fractional recovery of the added stable lead. 5.) Subtract the reagent blank:
Pb(5) = Pb(4),- B,
where B is the blank in dpm. This gives the desired result for Pb-210 activity in the sample at the time of collection.
6.) From the first count determine the Po-210 activity in the sample at the time of the first plating step, Po(1l). Raw count rates should be corrected for background and then for decay back to
the time of plating. Use measured counter efficiencies to calculate Po(1) and to determine the chemical recovery of added Po-208, Rpo.