READ THESE TERMS AND CONDITIONS CAREFULLY BEFORE USING THIS WEBSITE. https://nrc-publications.canada.ca/eng/copyright
Vous avez des questions? Nous pouvons vous aider. Pour communiquer directement avec un auteur, consultez la
première page de la revue dans laquelle son article a été publié afin de trouver ses coordonnées. Si vous n’arrivez pas à les repérer, communiquez avec nous à [email protected].
Questions? Contact the NRC Publications Archive team at
[email protected]. If you wish to email the authors directly, please see the first page of the publication for their contact information.
NRC Publications Archive
Archives des publications du CNRC
Access and use of this website and the material on it are subject to the Terms and Conditions set forth at
Invariant Robust 3-D Face Recognition based on the Hilbert Transform
in Spectral Space
Paquet, Eric; Rioux, Marc
https://publications-cnrc.canada.ca/fra/droits
L’accès à ce site Web et l’utilisation de son contenu sont assujettis aux conditions présentées dans le site LISEZ CES CONDITIONS ATTENTIVEMENT AVANT D’UTILISER CE SITE WEB.
NRC Publications Record / Notice d'Archives des publications de CNRC:
https://nrc-publications.canada.ca/eng/view/object/?id=325c1a48-3371-4dd1-b2d5-a2f60dd2abd5 https://publications-cnrc.canada.ca/fra/voir/objet/?id=325c1a48-3371-4dd1-b2d5-a2f60dd2abd5National Research Council Canada Institute for Information Technology Conseil national de recherches Canada Institut de technologie de l'information
Invariant Robot 3-D Face Recognition Based
on the Hilbert Transform in Spectral
Space *
Paquet, E., Rioux, M.
2006
* published in Journal of Multimedia. June 2006. NRC 48724.
Copyright 2006 by
National Research Council of Canada
Permission is granted to quote short excerpts and to reproduce figures and tables from this report, provided that the source of such material is fully acknowledged.
Invariant Robust 3-D Face Recognition based on
the Hilbert Transform in Spectral Space
E. Paquet
National Research Council/Visual Information Technology, Ottawa, Canada Email: [email protected]
M. Rioux
National Research Council/Visual Information Technology, Ottawa, Canada Email: [email protected]
Abstract—One of the main objectives of face recognition is
to determine whether an acquired face belongs to a reference database and to subsequently identify the corresponding individual. Face recognition has application in, for instance, forensic science and security. A face recognition algorithm, to be useful in real applications, must discriminate in between individuals, process data in real-time and be robust against occlusion, facial expression and noise.
A new method for robust recognition of three-dimensional faces is presented. The method is based on harmonic coding, Hilbert transform and spectral analysis of 3-D depth distributions. Experimental results with three-dimensional faces, which were scanned with a laser scanner, are presented. The proposed method recognises a face with various facial expressions in the presence of occlusion, has a good discrimination, is able to compare a face against a large database of faces in real-time and is robust against shot noise and additive noise.
Index Terms—Correlation, Face Recognition, Fourier
Transform, Hilbert Transform, Invariant, Robust, Spectral Analysis
I. INTRODUCTION
Face recognition is a difficult task [1-10]. The reason can be traced back to the variability of facial expression which may vary to reflect emotions such as happiness, boredom, shock and sadness, just to mention a few. In addition, in practical situations, a face can potentially be occluded by a mesh of hair or by the hand. This problem has been addressed by, in many situations, enforcing a neutral facial expression. This is the case, for instance, for Canadian passports. Unfortunately, such an approach is limited to a controlled environment. In an uncontrolled environment, facial expression and occlusion are issues that must be addressed.
In order to be applicable to practical situations, face recognition algorithms must fulfil many requirements, including the following. The data must be processed in real-time, the algorithm should be invariant or at least covariant with face position and orientation, it should be robust against facial expression, detection must be robust
against occlusion and acquisition noise, the algorithm must discriminate between faces and it must be scalable. Unless all these criterions are met, the algorithm has limited practical use.
A new method that fulfils all the above-mentioned requirements is presented. The method exploits the unique characteristics of 3-D depth distributions. The algorithm is based on the Fourier transformation of the phase function of the 3-D depth distribution and on a non-linear transformation. This paper is organised as follow. First, the phase Fourier transform of a 3-D depth distribution is introduced and its properties, including its relation with the analytic form, are investigated. Then, the invariant properties of the transformation are explored. A correlation method, based on this transformation, is utilised in order to recognise faces. Experimental results are presented with scanned faces. The issues of facial expression, occlusion and acquisition noise are addressed with real measured data. A conclusion follows. This paper is an extended version of [11].
II. THE PHASE FOURIER TRANSFORM OF A 3-D DEPTH DISTRIBUTION
A mathematical framework for the proposed method is presented. Let us consider a planar surface bounded by a binary domain R (x, y) in the xy plane, which is equal to
one if the surface belongs to the domain and zero otherwise:
( ) R ( )
z = a x + b y + c x, y (1)
where a and b are the slopes of the planar surface. The phase function associated with this planar surface is defined as the complex exponential of the later:
[
]
[
]
exp i ω z = i a exp ω( x + b y + c x, ) R ( y) (2)
where ω is a scale factor. Let us compute the Fourier transform of the phase function and let us call this transformation a phase Fourier transform
[
]
[
]
FT exp i = exp (i c) δ - , - * FT R ( ) 2 2 z a b u v x, y ω ω ω ω π π ⎡ ⎤ ⎣ ⎦ ⎧ ⎛ ⎞ ⎫ ⎨ ⎜⎝ ⎟⎠ ⎬ ⎩ ⎭ (3)where * denotes the convolution operator. The result of the Fourier transform is a unique peak for which the position is determined by the orientation of the planar surface and for which the shape is determined by the Fourier transform of the binary domain. This transformation has a geometrical interpretation. From the slopes of the plane, one can calculate the co-ordinates of the normal vector associated with the plane:
T 2 2 2 2 2 2 1 1 1 = a b + + 1 + + 1 + + 1 a b a b a b ⎡ ⎤ − − ⎢ ⎥ ⎣ ⎦ n (4)
Let us consider a particular case: a plane bounded by a rectangular domain: ( ) rect rect x y x y z = a x + b y + c d d ⎡ ⎛ ⎞ ⎛ ⎞⎤ ⎢ ⎜ ⎟ ⎜ ⎟⎥ ⎝ ⎠ ⎢ ⎝ ⎠⎥ ⎣ ⎦ (5)
Let us compute the phase Fourier transform of this plane: [ ]
(
)
FT exp (i ) = exp (i ) sinc - , - 2 2 x y x y z c d d a b u v d d ω ω ω ω π π ⎡ ⎛ ⎞ ⎛ ⎞⎤ ⎜ ⎟ ⎜ ⎟ ⎢ ⎝ ⎠ ⎝ ⎠⎥ ⎣ ⎦ (6)As in the previous case, a peak is obtained for which the position is determined the orientation of the plane and the shape is determined by the Fourier transform of the domain. One should note that the amplitude of the peak is proportional to the area of the corresponding domain. Since the Fourier transform of a phase function seems adapted to the study of three-dimensional depth distributions, it will be convenient to define the phase Fourier transform of a depth distribution as
[
]
( ) z FT exp i ω f x y( , )
Φ ≡ ⎡⎣ ⎤⎦ (7) There exists a formal correspondence between the phase Fourier transform and harmonic coding. The phase function is the analytic form of the coded function. In order to compute the analytic form we need the Hilbert transform, which is defined as
[
]
1 f ( ) d HT f ( ) z Z Z Z - z π ∞ −∞ ≡∫
(11) Then, the corresponding analytic form is defined as[
f ( ) = f ( ) - i HT f ( )z]
z[
z]
α (12) If one calculates the analytic form of the coded depth distribution one obtains:
[
sin ( )]
sin ( ) cos ( ) exp z = z - i z = 3 i z + 2 α ω ω ω π ω ⎡ ⎛ ⎞⎤ ⎜ ⎟ ⎢ ⎝ ⎠⎥ ⎣ ⎦ (13)which is the phase function of the depth distribution.
III. INVARIANT PROPERTIES OF THE PHASE FOURIER TRANSFORM OF A DEPTH DISTRIBUTION
Let us consider a planar surface bounded by a domain as defined in equation (1) and let us calculate its phase Fourier transform:
[
]
( ) = exp (i ) δ - , - * FT R ( ) 2 2 z c a b u v x, y ω ω ω π π Φ ⎧ ⎛ ⎞ ⎫ ⎨ ⎜⎝ ⎟⎠ ⎬ ⎩ ⎭ (14)The power spectrum associated with the phase Fourier transform is defined as
[
]
[
]
* 1 2 * P ( ) ( ) ( ) = δ - , - * FT R ( ) 2 2 δ - , - * FT R ( ) 2 2 u, v z z a b u v x, y a b u v x, y ω ω π π ω ω π π ≡ Φ Φ ⎡ ⎛ ⎞ ⎜ ⎟ ⎢ ⎝ ⎠ ⎣ ⎤ ⎛ ⎞ ⎜ ⎟ ⎥ ⎝ ⎠ ⎦ (15)A peak is obtained for which the position is determined by the orientation of the planar surface and for which the shape is a function of the Fourier transform of the domain. The position of the plane does not appear in the power spectrum. Consequently, the position of the peak is invariant under a longitudinal translation of the plane. Furthermore, the position of the peak is invariant under transversal translations of the plane i.e. translations in the xy plane. We conclude that the position of the peak is translation invariant.
Similar comments can be made about scale invariance. The position of the peak is invariant under scale transformation. For instance, let us considered a planar surface. The sole effect of the scale factor is to modify the extent of the binary domain and not the orientation of the corresponding planar surface. Since the shape of the peak depends exclusively on the shape of the corresponding domain, the position of the peak remains unaffected after a scale transformation.
The situation is quite different in the case of rotations. Let us considerer an azimuthal rotation, i.e. a rotation around the z-axis. Such a rotation can be mathematically expressed as cos sin sin cos r z z z z r x x y y θ θ θ θ − ⎡ ⎤ ⎡ ⎤ ⎡= ⎤ ⎢ ⎥ ⎢ ⎥ ⎢ ⎥ ⎣ ⎦ ⎣ ⎦ ⎣ ⎦ (16) If this transformation is applied to a planar surface one obtains:
z z z z
[( cos sin )
( sin cos ) ]
R ( cos - sin , sin + cos )
r z z r z z r r r r r = a + b x + z - a + b y + c x y x y θ θ θ θ θ θ θ θ (17)
The plane and the domain are rotated as a whole around the z-axis. The shape of the domain is unaffected. Consequently, such a rotation is equivalent to rotate the spectrum as a whole.
Finally, let us consider the case of transversal rotations i.e. rotation around the x or the y-axis. Both types of rotation are applied to the bounded planar surface:
(
)
(
)
x y [tan arctan ( ) tan arctan ( ) ] R , cos cos x y z = a + x + b + y + c x y θ θ θ θ ⎛ ⎞ ⎜ ⎟ ⎝ ⎠ (18)As expected, the rotation affects the orientation of the planar surface. Such a rotation corresponds in the power spectrum to a non-linear translation. The position of the peak is a function of the applied rotation. The translation is non-linear because the power spectrum is in the slope-space and not in the angle-slope-space. Nevertheless, if the following transformation is applied:
(v) = V (u) = U arctan arctan (19)
it is possible to map the power spectrum from the slope-space to the angle-slope-space. The translation corresponding to the transverse rotation is then entirely linear. This result implies that it is possible to transform a transverse rotation into a translation if the phase Fourier transform is combined with a simple non-linear co-ordinates transformation.
Our argumentation is valid for all the peaks belonging to the power spectrum. As a consequence, in the angular space, each peak is submitted to a linear translation when a transversal rotation is applied to the depth distribution. Since the amplitude of this translation depends solely on the amplitude of the applied rotation, each peak is submitted to an identical displacement. That means that a transversal rotation preserves the relative positions of the peaks as long as the corresponding planar surfaces remain visible.
Up to this point, we have restricted our considerations to planar surfaces. Nevertheless, our method encompasses many kinds of surfaces, since it is possible to decompose an arbitrary surface into a set of small planar patches. This is what happens, for instance, when a three-dimensional model is tessellated. Since the Fourier transform and the phase Fourier transform are linear transformations, each patch contributes a small peak to the spectrum and the peaks combine linearly. Since the position of each peak is related to the orientation of the corresponding normal vectors associated with the planar patches, the phase Fourier transform provides the distribution of normal vectors associated with the surface of the three-dimensional depth distribution.
IV. CORRELATION, PHASE FOURIER TRANSFORM AND FACE RECOGNITION
The most common technique to compare two spectra is the correlation. It is defined as
(
)
(
)
u 0, 0 r 0 0 0 0 γ ( u, v ) - - P u v P u u v, v du dv ∞ ∞ ∞ ∞ ≡∫ ∫ − − (20)where Pu
(
u v0, 0)
is the unknown power spectrum and(
)
r 0 , 0
P u −u v −v is the reference power spectrum. Such a correlation can be calculated with the help of the Fourier transform:
[
]
[
]
1 *
u r
γ ( u, v = ) FT FT − ⎡⎣ P (u, v) FT P (-u, - v) ⎤⎦ (21) where we have taken into account that the power spectrum is real. Generally, the result of the correlation is a peak. Its amplitude is a measure of the similitude between the two spectra. This amplitude is not absolute, since it depends on the total power of the spectrum. Such a difficulty can be overcome by normalising the spectrum: - -P ( ) p ( ) P ( ) d d u, v u, v u, v u v ∞ ∞ ∞ ∞ ≡ ∫ ∫ (22)
where p (u, v) is the normalised power. Normalisation
can be interpreted as follow. It has been demonstrated that the amplitude of a peak is a function of the total area
of the surfaces to which it corresponds. That means that in a power spectrum, the total power corresponds to the total area of the corresponding surfaces. After normalisation, a representation for which the amplitude of a peak corresponds to the ratio between the area of a given orientation and the area of all the orientations of the surfaces is obtained. Such a distribution corresponds to the probability of having a given orientation. Consequently, the amplitude of the correlation peak is a measure of the similarity between two distributions of normal vectors. This amplitude of the correlation peak is unitary in the case of an auto-correlation and lower than one otherwise.
From our previous considerations, it is concluded that the correlation spectrum is translation and scale invariant and covariant for moderate transversal rotations. By covariant we mean that the position of the correlation peak is proportional to the amount of transversal rotation. In order to be able to acquire and process data rapidly, it is important that the method is invariant and covariant to the later transformations. For instance, it is difficult to precisely and rapidly position an individual in order to acquire his face. The same remark applies for transversal rotations. The case of azimuthal rotation is not too problematic because of the stiffness of the neck in that direction; in other words, it is much easier to bow one’s head forward or backward then laterally.
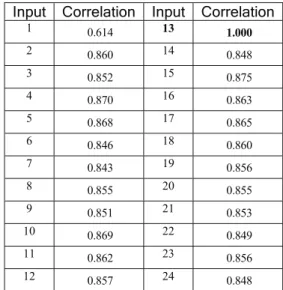
TABLE I. CORRELATION OF FACE 1.13 WITH THE FACES OF FIGURE 1 WITH THE PROPOSED METHOD.
Input Correlation Input Correlation
1 0.614 13 1.000 2 0.860 14 0.848 3 0.852 15 0.875 4 0.870 16 0.863 5 0.868 17 0.865 6 0.846 18 0.860 7 0.843 19 0.856 8 0.855 20 0.855 9 0.851 21 0.853 10 0.869 22 0.849 11 0.862 23 0.856 12 0.857 24 0.848
Nevertheless, if the azimuthal rotation becomes problematic, the method can be made invariant to many types of rotations by computing the distance in between the main peaks of the spectrum in the angle-space. Then, their distribution is represented by a histogram.
As previously mentioned, the amplitude of the normalised power spectrum is related to the probability of occurrence of a given normal vector orientation. Such an orientation is not invariant under azimuthal and transversal rotations. Nevertheless, in the case of a rigid object, the angle in between two orientations is invariant under the above mentioned transformations. Strictly
speaking, a face cannot be considered as a rigid object, but as a semi-rigid object. That means that an important proportion of the face surface is rigid or quasi-rigid e.g. the nose, the front head and the chin, just to mention a few.
The power spectrum represents a substantial amount of information. As we previously saw, such a large amount of information can easily be processed with a correlation technique. Nevertheless, the calculation of the angles in between all the normal vectors involves
!
2! ( 2)!
n n−
(23)
operations, where n is the number of normal vectors associated with the 3-D face. Consequently, in order to process the spectrum in real-time, it is necessary to analyze the content of the spectrum in order to determine the most salient normal vector orientations. From a probability point of view, the most important orientations are the one having the highest probability which is associated, in our case, to the orientations for which the area is the most important as we have demonstrated in section III and in the present section e.g. equation (22).
Those orientations are relatively easy to detect, they correspond to the local maxima in the normalised power spectrum. Consequently, the determination of the most salient features is equivalent to find the local maxima in the power spectrum which correspond to the most probable orientations. In order to further reduce the amount of information, only the most probable peaks are considered. In practice, we consider only peaks for which their amplitude is at least
exp( 1)
−
of the absolute maximum. Typically, the power spectrum associated with a face contains ten peaks. Such a number is easily manageable for real-time implementation.In order to obtain a description that is invariant both for azimuthal and transversal rotations, we compute the angle in between each pair of local maxima. The angles obtained are invariant under azimuthal and transversal rotations. From the set of angles, a histogram is constructed. Such a histogram is associated with their statistical distribution: the horizontal axis of the histogram corresponds to the angles in between two local maxima and the vertical axis to the frequency of occurrence of such an angle. The histogram is remarkable compact with a typical size of a few hundred bytes. This is a remarkable factor of compression when one considers that the size of the file associated with a scanned face can easily reach hundreds of megabytes. Such a high compression ratio can be achieved because only the most important facial characteristics are considered.
In order to facilitate the comparison in between the histograms, the later are normalised. This is achieved by normalising the maximum frequency of occurrence to unity. Face retrieval is performed by comparing the associated histograms. The comparison metrics is based on the Euclidian distance. The histogram with the smallest distance, with respect to the reference histogram, corresponds to the closest match.
For mission critical applications, it is also possible to train a neural network with the histograms. For instance, the neural network can be trained with the same individual with various facial expressions, hair cuts and beards. Multilayer neural network trained with the back-propagation algorithm are well suited for this task.
Our technique is applied to face recognition. This is a challenging task, because most faces present a high degree of resemblance. The experimental data set is shown in figure 1 and the individuals are numbered from left to right and from top to bottom. Each face corresponds to a real individual and was acquired with the help of the auto-synchronized laser scanner developed at the National Research Council of Canada (NRC) [12]. In our first experiment, figure 1.13 is selected as our reference face. The correlation between the data set and the reference face are calculated and the amplitude of the corresponding correlation peak is measured. The results are reported in table 1.
Figure 1. Depth distribution of the 24 faces of the experimental set. Each face was acquired with NRC’s auto-synchronized laser scanner.
As shown in the table, the reference face has been properly identified. Facial expression can have a considerable effect on the appearance of a face. Our correlation technique, in order to be applicable to practical problems, must be able to handle such situation. Consequently, another experiment is performed with figure 1.12 as the reference face. The results are reported in table 2.
The peak of correlation with the highest amplitude corresponds to the autocorrelation peak. The peak corresponding to the correlation in between figure 1.2 and figure 1.12 follows immediately. These two figures correspond to the same individual: one of the authors! The presence of the hand in figure 1.12 makes the identification task much more complicated. This is due to the fact that the shape of the hand modifies the distribution of normal vectors by introducing new surfaces and by occluding previously visible surfaces. The normal vectors associated with the forehead, the nose and the beard are relatively immune against a change of facial expression. This fact explains, up to a certain point, why the algorithm is robust against facial expression.
TABLE II. CORRELATION OF FACE 1.12 WITH THE FACES OF FIGURE 1 WITH THE PROPOSED METHOD. FACE 1.2 CORRESPONDS TO THE SAME INDIVIDUAL THAN FACE 1.12 BUT THE FACIAL EXPRESSION IS
DIFFERENT. IN ADDITION, THE FACE IS PARTLY OCCLUDED BY A HAND.
Input Correlation Input Correlation
1 0.635 13 0.857 2 0.885 14 0.861 3 0.852 15 0.859 4 0.862 16 0.838 5 0.864 17 0.841 6 0.854 18 0.860 7 0.861 19 0.849 8 0.870 20 0.838 9 0.857 21 0.856 10 0.857 22 0.870 11 0.859 23 0.850 12 1.000 24 0.871
V. FACE RECOGNITION IN THE PRESENCE OF SHOT NOISE AND ADDITIVE NOISE
The influence of noise on our algorithm is explored next. Two kinds of noise are considered: shot noise and additive noise. Pre-processing the depth distribution reduces additive noise by a substantial amount.
Shot noise is associated with the lost of one or many points during the acquisition of the face. This noise is common when a highly specular surface is scanned with a laser scanner. When a specular surface is encountered, the laser beam of the scanner is reflected in a direction, which does not necessarily correspond to the direction of the scanner’s sensor. This problem is relatively uncommon for diffuse surfaces because, by their very nature, they reflect light in all directions.
Shot noise has been applied randomly to figure 1.2 on half of the points of the depth distribution. The outcome of the operation is shown in figure 2.1. The experience performed in table 1 was repeated with the noisy face. The amplitude of the correlation peaks are reported in table 3.
Figure 2. The effect of noise of face 1.2. Face 2.1 was obtained by applying shot noise on half the points of face 1.2. Face 2.2 was obtained by applying additive noise on face 1.2. Face 2.3 shows the pre-processing of face 2.2 with a Hann filter.
Despite of the importance of the noise, the face has been properly identified. Discrimination is low but that should be considered normal in relation to the level of noise; remember that half of the information is missing. It is concluded that our correlation technique is robust against shot noise.
TABLE III. CORRELATIONOFTHEFACE2.1WITHTHE FACESOFFIGURE1WITHTHEPROPOSEDMETHOD. SHOT NOISEWASAPPLIEDONHALFOFTHEPOINTSOFTHEFACE.
Input Correlation Input Correlation
1 0.589 13 0.813 2 0.898 14 0.847 3 0.834 15 0.817 4 0.843 16 0.807 5 0.833 17 0.832 6 0.837 18 0.850 7 0.838 19 0.791 8 0.851 20 0.808 9 0.836 21 0.848 10 0.833 22 0.841 11 0.822 23 0.813 12 0.832 24 0.853
The robustness comes from the phase Fourier transform. Indeed, we have seen previously that if a planar surface is fragmented, the position of the corresponding peak in the phase Fourier spectrum is not affected; only the shape of the peak is modified. In the present case, not only the domain of the surface is modified but also a certain fraction of the surface is lost. Each lost direction reduces the amplitude of the corresponding peak in the phase Fourier spectrum. If the shot noise is distributed
uniformly, the spectrum is also uniformly affected because each orientation looses in proportion the same amount of points, which explains why that the proposed method is robust against shot noise
Let us add Gaussian noise to our distribution: f ( ) + G ( )
z = x, y x, y (24)
An example of such a noisy face is shown in figure 2.2. Now, let us calculate the normal vector of a noisy planar surface from three non-collinear points. If additive Gaussian noise is applied, the normal vector becomes:
( ) ( ) ( ) ( ) ( ) ( ) ( ) ( ) f 2 G 2 - f 1 - G 1 f 3 + G 3 - f 1 - G 1 2 1 3 1 2 1 3 1 - - x x x x = y - y y - y ⎡ ⎤ ⎡ ⎤ ⎢ ⎥ ⎢∧ ⎥ ⎢ ⎥ ⎢ ⎥ ⎢ + ⎥ ⎢ ⎥ ⎣ ⎦ ⎣ ⎦ n (25)
where
∧
is the exterior product and G (x, y)is a Gaussian distribution. As shown by the equation, the noise distributes the normal vectors randomly. For our technique to be applicable in such a case, a sufficient proportion of normal vectors must be restored to their original orientation.If the shift induced by the noise is relatively small to the depth, it is possible to reduce the level of noise with a convolution in between the depth distribution and a Hann filter, the later being defined as
1 2 x 2 y h (x, y) = 1 - cos 1 - cos 4 L - 1 L - 1 π π ⎡ ⎛ ⎞⎤ ⎡ ⎛ ⎞⎤ ⎜ ⎟ ⎜ ⎟ ⎢ ⎝ ⎠⎥ ⎢ ⎝ ⎠⎥ ⎣ ⎦ ⎣ ⎦ (26)
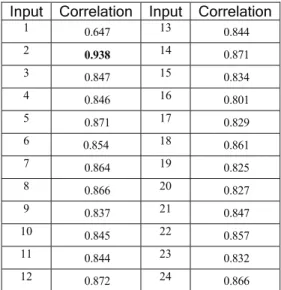
Although repeated experimentation tends to favour the Hann filter, the shape of the filter is not critical and the Hann filter can be replaced with a Gaussian filter. The Hann filter is a low-pass filter. That means that after the convolution, small features or high frequencies are removed. These features correspond in proportion to a small number of normal vectors and for that reason, their effect on the correlation is temperate. Figure 2.3 shows the restoration of the noisy face with a Hann filter. The results of the correlation of this face with the faces of figure 1 are reported in table 4.
TABLE IV. CORRELATION OF FACE 2.3 WITH THE FACES OF FIGURE
1 WITH THE PROPOSED METHOD. ADDITIVE NOISE WAS APPLIED TO FACE
1.2 AS ILLUSTRATED IN FIGURE 2.2 AND THE LATER WAS PRE-PROCESSED WITH A HANN FILTER AS ILLUSTRATED IN FIGURE 2.3.
Input Correlation Input Correlation
1 0.647 13 0.844 2 0.938 14 0.871 3 0.847 15 0.834 4 0.846 16 0.801 5 0.871 17 0.829 6 0.854 18 0.861 7 0.864 19 0.825 8 0.866 20 0.827 9 0.837 21 0.847 10 0.845 22 0.857 11 0.844 23 0.832 12 0.872 24 0.866
Even if the post-restoration face presents a relatively good overall aspect, one must remember that the surface
still presents many asperities, which are associated with randomly orientated normal vectors. That explains why the discrimination is lower relatively to the non-noisy case.
More sophisticated signal processing techniques would be needed in order to address the problem of strong additive noise, but strong shot noise is remarkably handled by the algorithm.
VI.CONCLUSIONS
A new robust method for face recognition has been presented. This method is based on the phase Fourier transform of 3-D depth distributions and on a non-linear correlation. According to our experimental results, the discrimination of the method is high. The method is robust against occlusion and facial expression and can handle them simultaneously.
Recall that shot noise is not uncommon for faces acquired with a laser scanner, since such a phenomenon can occur for instance if the skin is shinny or oily. The algorithm shows a remarkable robustness against such shot noise. Furthermore, the algorithm is covariant to transversal rotations and invariant to translation which means that the positioning of the head is not critical. This is important to facilitate and accelerate the acquisition process. The background can be easily eliminated by applying a threshold to the 3-D depth distribution, which means that the method is suitable for an uncontrolled environment.
Real-time implementation of the algorithms will be facilitated by the fact that it is based on the Fourier transform which as a complexity of O (N log (N)). Such a transformation can be calculated in real-time with the help of a digital signal processing or DSP board. The scalability of the algorithm has not been proven, because of the small size of the data set, but many reasons make us believe that it could be potentially high. This is due to the consistency of the correlation results and the fact that the method is independent of any segmentation scheme, which makes it stable.
Our algorithm has many features that make it an excellent candidate for electro-optical implementation. Although a complex technology, an electro-optical correlator allows unmatched performances for algorithms that heavily rely on the Fourier transform. For details about electro-optical implementation and optical correlator, the reader is referred to [13]. In the following paragraphs, we review the most important aspects of electro-optical correlation as well as the features that are specific to our algorithm.
As shown by equation (23), the correlation can be computed with the help of two Fourier transforms. Such a transformation can be calculated with a lens as follows. The phase of a collimated laser beam is modulated by a filter located at the focus of a convex lens for which most aberrations have been corrected. The Fourier transform of the phase image associated with the filter is then performed by the lens aperture and imaged, by the lens per se, at the output focus. The phase is input in real time
with a laser scanner and a light valve. More details can be found in [13].
In order to implement our algorithms, we must first compute the phase of the range image. This is done, as mentioned earlier, by directly inputting the range image on the phase modulator. The modulation range of most phase modulators is limited to 2π. However, a range image has a range of thousands of π. In order to solve this problem, one has to compute the kinoform of the phase image. The kinoform is defined as
[
]
mod ωf x y( , ), 2π
Θ = (27) where mod, the modulo function, is the remainder after the numerical division. If the modulator is digital, the modulation must be performed with at least 8 levels of phase in order to maximise the diffractional efficiency, i.e. minimising the artefact in the Fourier spectrum. Once the kinoform has been addressed on the filter, the Fourier transform of the filter is computed with a lens as described earlier. An important aspect that remains to be implemented is the non-linear transformation i.e. equation (19). Such a transformation can be implemented with a holographic element, which is basically a computer generated hologram design in such a way as to perform the required transformation. For more details the reader is referred to [13]. Once the non-linear transformation has been performed, the obtained spectrum is multiplied with the corresponding spectrum of the reference face. The multiplication is achieved by inserting another phase modulator at the output focus of the lens. The calculation of the correlation is completed by computing a last Fourier transform with a second lens. Then, the power spectrum is obtained directly from an intensity sensor (e.g. CCD) situated at the output focus of the second lens.
REFERENCES
[1] V. Kruger, R. Gross and S. Baker, “Appearance-based 3-D face recognition from video”, Pattern Recognition - 24th DAGM Symposium, Proceedings Lecture Notes in Computer Science, Vol.2449, 2002, pp. 566-574.
[2] S. Gerl and P. Levi,” 3-D human face recognition by self-organizing matching approach”, Pattern Recognition and Image Analysis, Vol. 7, No. 1, 1997, pp. 38-46.
[3] A. F. Abate, M. Nappi, S. Ricciardi and G. Sabatino, “One to many 3D face recognition enhanced through k d tree based spatial access”, Advances in Multimedia Information Systems - MIS 2005. Proceedings Lecture Notes in Computer Science Vol. 3665, 2005, pp. 5-16.
[4] A. B. Moreno, A. Sanchez, J. Velez and J. Diaz, “Face recognition using 3D local geometrical features: PCA vs. SVM”, Proceedings of the 4th International Symposium on Image and Signal Processing and Analysis, 2005, pp.185-90.
[5] A. Colombo, C. Cusano and R. Schettini, “A 3D face recognition system using curvature based detection and holistic multimodal classification”, Proceedings of the 4th International Symposium on Image and Signal, 2005, 179-84.
[6] Yonguk Lee, Hwanjong Song, Ukil Yang, Hyungchul Shin and Kwanghoon Sohn, “Local feature based 3D face
recognition”, Audio and Video Based Biometric Person Authentication. 5th International Conference - AVBPA 2005, Proceedings Lecture Notes in Computer Science Vol. 3546, 2005, pp. 909-18.
[7] A. Scheenstra, A. Ruifrok and R. C. Veltkarnp, “A survey of 3D face recognition methods”, Audio and Video Based Biometric Person Authentication. 5th International Conference - AVBPA 2005, Proceedings Lecture Notes in Computer Science Vol. 3546, 2005, pp. 891-9.
[8] U. Castellani, M. Bicego, G. Iacono and V. Murino, “3D face recognition using stereoscopic vision”, Advanced Studies in Biometrics. Summer School on Biometrics, Revised Selected Lecture Papers Lecture Notes in Computer Science Vol. 3161, 2003, pp. 126-37.
[9] Xue Yuan, Jianming Lu and Takashi Yahagi, “A method of 3D face recognition based on principal component analysis algorithm”, IEEE International Symposium on Circuits and Systems (ISCAS). Vol. 4, 2005, pp. 426-435. [10] Lei Zheng, Gang Pan and Zhaohui Wu, “3D face
recognition using eigen spectrum on the flattened facial surface”, Advances in Biometric Person Authentication. 5th Chinese Conference on Biometric Recognition - SINOBIOMETRICS 2004, Proceedings Lecture Notes in Computer Science Vol. 3338, 2004, pp. 250-7.
[11] E. Paquet and M. Rioux, “Robust Recognition of 3-D Faces based on Analytic Forms and Spectral Analysis”, IEEE 4th International Symposium on Image and Signal Processing and Analysis – ISPA, 2005, pp. 173-78. [12] M. Rioux, "Laser range finder based on synchronized
scanners", Applied Optics, Vol. 23, No. 21, 1984, pp. 3837-3844.
[13] J. W. Goodman, Introduction to Fourier Optics, 2nd ed., New York, McGraw-Hill, 1996.
Eric Paquet is a Senior Research Officer at the Visual
Information Technology (VIT) group of the National Research Council of Canada (NRC). He received his Ph.D. in Computer Vision from Laval University and the National Research Council in 1994. After finishing his Ph.D., he worked on optical information processing in Spain, on laser microscopy at the Technion-Israel Institute of Technology and on 3D hand held scanners in England. He is pursuing research on content-based management of multimedia information and visualisation of heritage sites at the National Research Council of Canada. His current research interests include content-based description of multimedia and multi-dimensional objects, anthrometric databases, information management and visualisation of virtualised heritage sites. He is the author of numerous publications, member of MPEG, WEAR, ISPRS, SCC, CODATA, on the programme committee of several international conferences and has received many international awards.
Marc Rioux. is a Principal Research Officer of the Institute
for Information Technology at the National Research Council Canada. His present interests are in the development of three-dimensional digitizing, modelling and display for machine vision, optical dimensional inspection and visual communication in the Visual Information Technology Group. He received his bachelor’s degree in engineering physics in 1971 and a master’s degree in physics in 1976, both from Laval University. He worked five years on CO2 laser development and applications and two years in infrared holography and joined the National Research Council in 1978 to work on 3D digitizing.