RESEARCH ARTICLE
MacroH2A histone variants maintain nuclear organization and
heterochromatin architecture
Julien Douet1,2, David Corujo1,2,*, Roberto Malinverni1,2,*, Justine Renauld3, Viola Sansoni4, Melanija Posavec Marjanović1
, Neus Cantariño1, Vanesa Valero1,2, Fabien Mongelard5, Philippe Bouvet5, Axel Imhof4, Marc Thiry3and Marcus Buschbeck1,2,‡
ABSTRACT
Genetic loss-of-function studies on development, cancer and somatic cell reprogramming have suggested that the group of macroH2A histone variants might function through stabilizing the differentiated state by a yet unknown mechanism. Here, we present results demonstrating that macroH2A variants have a major function in maintaining nuclear organization and heterochromatin architecture. Specifically, we find that a substantial amount of macroH2A is associated with heterochromatic repeat sequences. We further identify macroH2A on sites of interstitial heterochromatin decorated by histone H3 trimethylated on K9 (H3K9me3). Loss of macroH2A leads to major defects in nuclear organization, including reduced nuclear circularity, disruption of nucleoli and a global loss of dense heterochromatin. Domains formed by DNA repeat sequences are disorganized, expanded and fragmented, and mildly re-expressed when depleted of macroH2A. At the molecular level, we find that macroH2A is required for the interaction of repeat sequences with the nucleostructural protein lamin B1. Taken together, our results argue that a major function of macroH2A histone variants is to link nucleosome composition to higher-order chromatin architecture. KEY WORDS: Heterochromatin, Histone variant, Nuclear organization, DNA repeats
INTRODUCTION
A large number of loss-of-function studies support a physiological role for macroH2A histone variants in the establishment and maintenance of differentiated epigenomes. MacroH2A proteins promote differentiation of embryonic and adult stem cells (Creppe et al., 2012a), are important for proper embryonic development of zebrafish (Buschbeck et al., 2009) and form an epigenetic barrier to somatic cell reprograming (Barrero et al., 2013a; Gaspar-Maia et al., 2013; Pasque et al., 2011, 2013). In the context of cancer, the bulk
literature positions macroH2A proteins as bona fide tumor suppressors (reviewed in Cantariño et al., 2013). In melanoma, macroH2A expression is lost in advanced stages and re-expression of macroH2A proteins suppresses metastatic potential (Kapoor et al., 2010). Suppression of macroH2A1 enhanced the cancer stem cell-like properties in bladder cancer (Park et al., 2015) and led to a massive expansion of undifferentiated carcinoma-like tissue in teratomas grown from xenografted mouse embryonic stem cells (Creppe et al., 2012a).
MacroH2A has an ambiguous and still unexplained role in transcriptional regulation. While the genomic distribution of macroH2A correlates with suppression of transcriptional activity (Changolkar and Pehrson, 2006; Changolkar et al., 2010; Gamble et al., 2010), it is in some cases required for signal-induced gene activation (discussed in Creppe et al., 2012b). The repressive function of macroH2A proteins has been primarily associated with cancer. In both melanoma and breast cancer, macroH2A was, for instance, shown to exert its tumor suppressive function through repression of the cell cycle-promoting gene CDK8 (Kapoor et al., 2010; Xu et al., 2015). Lavigne and colleagues provided results suggesting that rather than being a transcriptional regulator macroH2A proteins stabilize expression states, thus providing robustness and reducing noise (Lavigne et al., 2015).
Both macroH2A1 and macroH2A2 co-occupy promoters of developmental genes that are bound by polycomb repressive complexes (Buschbeck et al., 2009), and large macroH2A-bound regions overlap with the histone H3 trimethylated on K27 (H3K27me3) polycomb mark (Gamble et al., 2010). Polycomb-bound and H3K27me3-marked regions are frequently referred to as facultative heterochromatin, which has been defined as a transiently condensed and transcriptionally silent type of chromatin permissive to transcriptional activation in response to environmental and differentiation signals (Trojer and Reinberg, 2007).
In contrast, constitutive heterochromatin is characterized by its stable repressive nature. The histone mark H3K9me3 plays an important role in its establishment and maintenance (Maison and Almouzni, 2004). H3K9me3 is enriched in gene-poor genomic regions containing repetitive elements and is believed to largely encompass the same genomic locations in different cell types. As such, constitutive heterochromatin is considered to be a more static structure than polycomb-marked chromatin. The DNA sequences contained in constitutive heterochromatin include telomeric and pericentromeric satellite repeats, transposable elements, such as long interspersed DNA elements (LINEs), and long terminal repeats (Peters et al., 2003; Rice et al., 2003). An important function of constitutive heterochromatin is to prevent genomic instability and ensure stable replication of the genome by maintaining transposons and simple DNA repeats as being transcriptionally silent (Bouzinba-Segard et al., 2006; Peters et al., 2003; Taddei et al., 2001).
Received 2 November 2016; Accepted 7 March 2017
1Josep Carreras Leukaemia Research Institute (IJC), Campus ICO– Germans Trias
i Pujol, Campus Can Ruti, Badalona 08916, Spain.2Program of Predictive and
Personalized Medicine of Cancer, Germans Trias and Pujol Research Institute (PMPPC-IGTP), Campus Can Ruti, Badalona 08916, Spain.3Cell and tissue biology
unit, GIGA-Neurosciences, University of Liege, C.H.U. Sart Tilman, Liege 4000, Belgium.4BioMedical Center and Center for Integrated Protein Sciences Munich,
Ludwig-Maximilians-University of Munich, Großhaderner Straße 9, Planegg-Martinsried 82152, Germany.5Université de Lyon, Ecole normale Supérieure de
Lyon, Centre de Recherche en Cancérologie de Lyon, Cancer Cell Plasticity Department, UMR INSERM 1052 CNRS5286, Centre Léon Bérard, 69008 Lyon, France.
*These authors contributed equally to this work
‡Author for correspondence (mbuschbeck@carrerasresearch.org)
N.C., 9548-3927; A.I., 0000-0003-2993-8249; M.B., 0000-0002-3218-4567
Journal
of
Cell
Science
One of the most conserved characteristics of genome organization is the accumulation of heterochromatin close to the nuclear lamina, which comprises a meshwork of four lamin proteins and a number of transmembrane proteins in mammals (reviewed in Amendola and van Steensel, 2014; Gruenbaum and Medalia, 2015). Three genes LMNA, LMNB1 and LMNB2 encode the four major mammalian lamins: the splice variants lamin A and C, lamin B1 and lamin B2. Mapping techniques, such as DNA adenine methyltransferase identification (DamID), have demonstrated that lamins are enriched over domains ranging from 10 kb to 10 Mb in size that are termed lamin-associated domains (LADs; Guelen et al., 2008). In particular those LADs that have high cell-to-cell consistency are inversely linked with gene activity and associated with H3K9me3 (Kind et al., 2015). Importantly, in both Caenorhabditis elegans and human cells H3K9-specific methylases, and the resulting H3K9me2 and H3K9me3 marks, are required for the tethering of genomic loci to the nuclear lamina (Bian et al., 2013; Kind et al., 2013; Towbin et al., 2012). It is still unclear to what extent other marks enriched in LADs, such as H3K27me3, also contribute to tethering (Guelen et al., 2008; Harr et al., 2015).
While lamin B proteins are primarily localized at the periphery interacting with heterochromatin, a substantial fraction of lamin A/C is also found in the nucleoplasm and interacts with euchromatic regions (Gesson et al., 2016). In the nucleoplasm, lamin A/C further interacts with the surface of polycomb-marked heterochromatin foci (Cesarini et al., 2015). In addition to the nuclear lamina, the nucleolus is the other nuclear structure with a major influence in genome organization and is surrounded by a shell of constitutive heterochromatin (Németh et al., 2010). Besides ribosomal DNA, the nucleolus-associated sequences are highly similar to LADs, suggesting that the nuclear lamina and the nucleolus are two alternative locations for similar types of repressive genomic domains (Németh et al., 2010; van Koningsbruggen et al., 2010). It is noteworthy that lamin B1 but not lamin A/C is required for the preservation of nucleolar structure (Martin et al., 2009).
The nuclear organization and in particular the capacity to anchor part of the genome at the nuclear periphery is emerging as an important parameter for differentiation and development. This is best demonstrated in the context of myogenic differentiation, which is impaired after inactivation of proteins mediating the perinuclear tethering of genomic regions (Gonzalez-Sandoval et al., 2015; Robson et al., 2016). The large majority of reported loss-of-function phenotypes support the idea that macroH2A proteins function through stabilizing the differentiated state by a yet unknown mechanism. Here, we have tested the hypothesis that macroH2A proteins function through regulating nuclear organization. Using a combination of cytological and biochemical techniques, we unveil a major role of macroH2As in the maintenance of nuclear organization and heterochromatin architecture. Specifically, we report that macroH2A1 and macroH2A2 are bound to heterochromatic repeats and contribute to the tethering of these repeats to the nuclear lamina.
RESULTS
MacroH2A is essential for maintaining nuclear organization and nucleolar integrity
To get a global view of nuclear organization and a possible influence of macroH2A, we analyzed cells after depletion of both macroH2A1 and macroH2A2. We have selected the well-characterized human male HepG2 cell line as a model system. HepG2 cells express both macroH2A1 and macroH2A2 isoforms (Fig. 1A). The knockdown of both macroH2A1 and macroH2A2 using stably integrated shRNA cassettes was highly efficient
(Fig. 1A,B). As shown in Fig. 1C, depletion of macroH2A proteins had a major effect on the nuclear organization and shape. Nuclei in control cells show well-shaped nucleoli and regions of dense heterochromatin staining in the nucleoplasm and at the nuclear and nucleolar periphery. Knockdown of macroH2A proteins led to the global loss of dense heterochromatin. This loss of dense heterochromatin was most pronounced at the classic sites of heterochromatin accumulation, the surface of the nucleolus and the nuclear periphery but could also be observed in the nucleoplasm (Fig. 1C,D). This effect had a very high penetration in the cell population, and when analyzing more than 100 cells we could not identify a single knockdown cell with intact dense heterochromatin (Fig. 1E). In knockdown cells, nucleoli were expanded and had a reticulated appearance with several small fibrillar centers (Fig. 1D). Such structural changes in nucleolar organization are indicative of increased transcriptional activity of ribosomal DNA (rDNA), which we previously reported in macroH2A-depleted cells (Cong et al., 2013). We confirmed the nucleolar expansion by performing immunofluorescence experiments with nucleophosmin as a marker of nucleoli (Fig. 1F). We observed macroH2A1 staining in the entire nucleus except in the nucleoli (Fig. 1B). Quantification by automated area measurements of 2D projections revealed both the nucleus and nucleolus are increased in size in macroH2A-deficient cells (Fig. 1G,H). The increase in nucleolar size remained significant after normalizing for the nuclear expansion (Fig. 1H). The electron microscopy images show that some nuclei have an irregular shape (Fig. 1C). Analysis of confocal images showed that the proportion of nuclei displaying anomalies such as the formation of bud-like structures or cavities was significantly increased in the absence of macroH2A proteins (Fig. 1I). Taken together, these results make a compelling case for an important role of macroH2A proteins in maintaining nuclear organization, including nucleolar and heterochromatic structures.
A substantial fraction of macroH2A-bound chromatin coincides with H3K9me3
To gain a better understanding of the relationship between macroH2A and heterochromatic features, we analyzed both the DNA sequence and the histone H3 modifications of macroH2A-bound chromatin. We used specific, non-crossreacting antibodies (Fig. S1) to determine the distribution of macroH2A1 and macroH2A2 on the linear genome by ChIP-seq. The antibody used for macroH2A1 was generated against the extranucleosomal domain and does not distinguish between the different splice variants of macroH2A1 (Pehrson et al., 1997). The analysis of our ChIP-seq data confirmed several of the characteristics that were previously described for macroH2A proteins in other cell types suggesting that our data is of high quality (Fig. S2A,B), namely that they show a significant enrichment over large chromatin domains reaching up to several hundred kbs in size (Gamble et al., 2010). There was an overall high similarity between macroH2A1 and macroH2A2 (Gaspar-Maia et al., 2013; Pehrson et al., 2014), and an reverse correlation with transcribed regions (Changolkar and Pehrson, 2006; Changolkar et al., 2010; Gamble et al., 2010). To compare the association of macroH2A proteins with the two major marks of constitutive and facultative heterochromatin, H3K9me3 and H3K27me3, respectively, we took advantage of available HepG2 ChIP-seq data of these marks generated by the ENCODE project (ENCODE Project Consortium, 2012). Given the high similarity between macroH2A1 and macroH2A2 (see example given in Fig. S2A), we have focused on one of the two proteins and found that 50% of all macroH2A2-bound peaks were overlapping
Journal
of
Cell
with H3K27me3 peaks and only∼10% with H3K9me3 (Fig. 2A). These results were in line with previous epigenomic analyses concluding that the facultative heterochromatin mark H3K27me3 is the predominant histone H3 tail modification overlapping with macroH2A-bound regions (Chen et al., 2014; Gamble et al., 2010; Gaspar-Maia et al., 2013).
The biochemical analysis of the tail modifications of histone H3 associated with macroH2A, however, presented a different picture. This analysis indicated that the amount of H3K9me3-modified
histone H3 associated with macroH2A1.2 was in a similar range to the amount of associated H3K27me3 (Fig. 2B). Specifically, we used HepG2 cells expressing epitope-tagged macroH2A1.2 at the same level as the endogenous protein and compared the relative amount of histone H3 modifications on isolated macroH2A1.2-containing nucleosomes with equimolar standards of pure modified histone H3 proteins generated by chemical ligation (Bartke et al., 2010). Similar results were obtained using HEK293T cells (Fig. S2C). Taken together, these results suggest that ChIP-seq
Fig. 1. MacroH2A proteins are essential for proper nuclear and nucleolar organization. (A) Western blot showing the stable depletion of macroH2A1 and macroH2A2 in HepG2 cells transduced with retroviral shRNA cassettes (sh mH2A1/2) in comparison to control cells (sh control).
Immunoblotting of histone H3 has been included to ensure equivalent loading of protein. (B) Immunostaining of macroH2A1 in control and knockdown HepG2 cells (red). Nuclei were counterstained with DAPI (gray). (C) Transmission electron microscopy analysis of HepG2 sh control cells (control) and sh macroH2A1/2 (sh mH2A1/2) knockdown cells. White arrowheads indicate dark contrast staining corresponding to dense heterochromatin and‘nu.’ marks the nucleolus. Scale bars: 1μm. (D) Higher magnification of selected nuclei focusing on the nucleolus (nu.) and the nuclear periphery. White arrowheads indicate dense heterochromatin regions. Scale bars: 1μm. (E) Quantification of nuclei from C according to their heterochromatin content. Three classes were
distinguished: dense, intermediate and no dense heterochromatin (HC) (n>100). (F) Immunostaining of nucleophosmin (NPM1) in control and knockdown HepG2 cells (red). Nuclei were counterstained with DAPI (gray). (G) Quantification of the nuclear surface in control and knockdown HepG2 cells (n>100) stained as in F. A Wilcoxon rank sum test was used to compare the two groups. (H) Percentage of nuclear area occupied by the nucleolus (identified by NPM1 detection) in nuclei from F. A Wilcoxon rank sum test was used to compare control (n=49) and knockdown samples (n=51). In the plots, the box represents the 25–75th percentiles, and the median is indicated. The whiskers show the highest and lowest data point within the 1.5× interquantile range of the upper and lower quartile, respectively, and outliers are indicated. (I) The proportion of nuclei presenting anomalies such as bud-like structures and cavities (examples shown in the upper panel) in control and knockdown HepG2 cells has been quantified (n>200). The P-value was calculated by a two-tailed Z-test.
Journal
of
Cell
analyses underestimate the association between macroH2A and constitutive heterochromatin.
To better understand where in the genome macroH2A and H3K9me3 co-occur, we took a closer look at the 10% fraction of macroH2A2 peaks that overlap with H3K9me3 while being devoid of H3K27me3 (Fig. 2A,C). These 1180 peaks mark 1–5 kb regions and are often found isolated in euchromatic or polycomb-marked environments and thus correspond to regions of interstitial heterochromatin (Fig. 2D). In the genome enrichment plots, many
of these interstitial heterochromatic regions are easily seen as sharp peak-like enrichments of H3K9me3 coinciding with macroH2A1 and macroH2A2 (Fig. 2D). We confirmed the specific enrichment of macroH2A1, macroH2A2 and H3K9me3 on these peaks in independent ChIP experiments performed with control cells and macroH2A-deficient cells (Fig. 2E; Fig. S2D). The level of enrichment of macroH2A2 on these interstitial peaks tended to be higher than on other macroH2A-bound sites such as the macroH2A2 target gene LAMA5 (Fig. 2E).
Fig. 2. MacroH2A associates with the H3K9me3 mark. (A) Venn diagram showing the overlap of macroH2A2 (mH2A2) peaks with H3K9me3 and H3K27me3 peaks in HepG2 cells. The number of peaks is indicated. (B) Anti-FLAG-affinity precipitation of mH2A1.2-containing nucleosomes in HepG2 cells stably expressing FLAG (F)-mH2A1.2 or containing empty vector (vec.). The amount of H3K27me3 and H3K9me3 of co-precipitated (IP lanes) histone H3 was analyzed by immunoblotting. Pure modified histone H3 proteins generated by chemical ligation (Bartke et al., 2010) were included as reference samples. (C) Normalized read distribution of macroH2A2, H3K27me3 and H3K9me3 reads around 1180 mH2A2 peaks identified in A show that there is overlap with H3K9me3 but not H3K27me3. The region between the 5′ and 3′ borders of the peaks has been scaled and is plotted at the same size for all peaks. (D) Four examples of macroH2A peak enrichments associated with H3K9me3 in HepG2 cells. Snapshots from the UCSC genome are shown for macroH2A1, macroH2A2, H3K27me3, H3K9me3 and input in HepG2 cells. Coordinates of the snapshots are provided in Table S1. (E) Occupancy of macroH2A2 and H3K9me3 on the same interstitial heterochromatin peaks shown in D was analyzed by ChIP in control cells (sh control) and cells deficient of both macroH2A proteins (sh mH2A1/2). The upstream promoter regions of LAMA5 and GRXCR1 served as positive and negative controls, respectively, for macroH2A2 enrichment. Data is shown as mean+s.e.m. of three experiments.
Journal
of
Cell
These results highlight the presence of macroH2A on isolated regions of interstitial heterochromatin. However, the number and size of these regions do not appear sufficient to provide an explanation for the substantial amount of H3K9me3 that we found associated with the immunoprecipitated macroH2A.
MacroH2A is present in constitutive heterochromatin repeat regions
As a hallmark of constitutive heterochromatin H3K9me3 is that it is tightly associated with repeat sequences. Repeatmasker (Smit et al.) classifies the subfraction of repeat elements that have been annotated so far. We have used the permutation test-based R package regioneR (Gel et al., 2016) to assess whether macroH2A peaks are significantly associated with any class of these repetitive elements. We found that peaks of both macroH2A proteins were positively associated with several types of repeats (Fig. 3A). The number of repeat classes that positively associated further increased when analyzing the fraction of peaks shared with H3K9me3 (Fig. 3A).
Given the association of macroH2A with annotated repeats, we next tested whether macroH2A also binds classic heterochromatic repeats that are still largely excluded from the current genome built. These included the pericentromeric SAT2 repeat, the centromeric α-satellite repeat, 45S and 5S ribosomal DNA and DXZ4, a repeat located on the X chromosome and known to be H3K9me3 marked
in male cells (Chadwick, 2008). As shown in Fig. 3B, we found a significant enrichment of macroH2A2 proteins on all these repeats that was of a similar range to that for two known polycomb-marked target genes of the HOX family (Buschbeck et al., 2009). Similar results were obtained for macroH2A1 (Fig. S3A). Knockdown of both macroH2A forms neither affected the level of H3K9me3 on repeats (Fig. 3C; Fig. S3B) nor on interstitial heterochromatin peaks (Fig. 2E). Comparable results were obtained when analyzing macroH2A1 in mouse embryonic fibroblasts from macroH2A1-knockout (KO) animals and control mice; macroH2A1 was enriched on Line-L1 repeats, rDNA, and minor and major satellite repeats and its loss did not affect H3K9me3 levels on any of these repeats (Fig. S3C,D).
Taken together, these results demonstrate that macroH2A histone variants are enriched on repeats that constitute the core of constitutive heterochromatin. The fact that many of these repeat sequences are not annotated provides a plausible explanation for the underestimation of the overlap between macroH2A and H3K9me3 by ChIP-seq.
The integrity of heterochromatic repeat architecture depends on macroH2A
Next, in order to determine what function macroH2A could exert on these repeats, we decided to take a closer look at the organization of two macroH2A-bound repeats, 45S rDNA and SAT2.
Fig. 3. MacroH2A2 is enriched on constitutive heterochromatin repeats. (A) The chart summarizes the association of macroH2A2 (mH2A2)- and macroH2A2 and H3K9me3 (macroH2A2-H3K9me3)-enriched regions in HepG2 with repeat classes indexed in Repeatmasker. Association was calculated with the permutation-test-based R-package regioneR (Gel et al., 2016) performing 1000 iterations. Color grading correlates with P-values, and blue and red colors denote negative and positive association, respectively. (B) The level of mH2A2 enrichments on various repeats, and on a set of poorly enriched control genes (E2F1, LRP5) and highly enriched polycomb (PcG) target genes (HOXA10, HOXC12) was analyzed by ChIP-qPCR. IgG was used as background control. Data is shown as mean+s.e.m. (n=3). (C) mH2A2 and H3K9me3 occupancy on pericentromeric satellite repeats (SAT2,αSAT), rDNA (45S and 5S), and DXZ4 repeat analyzed by ChIP in control and macroH2A knockdown HepG2 cells (sh control and sh mH2A1/2, respectively). Results were normalized to the histone H3 ChIP and IgG was used as background control. Data is shown as mean+s.e.m. (n=3).
Journal
of
Cell
Approximately 300 copies of ribosomal 45S rDNA repeats are distributed over five clusters in the human genome (reviewed in Diesch et al., 2014). Fluorescence in situ hybridization (FISH) of 45S rDNA showed a disorganization of foci in macroH2A-knockdown cells (Fig. 4A, top panel). Analysis of these images showed that while control cells have an average of 4.2 rDNA foci per nucleus, macroH2A-knockdown cells had a significant increase to 7.4 foci (Fig. 4A, top right panel). Similarly, the pericentromeric SAT2 repeat from chromosome 1 showed a significant expansion of the FISH signal (Fig. 4A, middle panel). Next, we analyzed nuclear H3K9me3 staining as a proxy for all heterochromatic areas and observed a global diffusion of the signal (Fig. 4A, bottom panel).
This can be quantified as a reduction in areas with signal above a determined threshold (Fig. 4A, bottom right panel). In contrast to in human cells, heterochromatin can be easily observed in mouse cells as a number of dense structures called chromocenters that are strongly stained by DAPI. Mouse embryonic stem cells predominantly express macroH2A1.2, which can be efficiently suppressed by a validated shRNA (Creppe et al., 2012a). When grown in the presence of serum, chromocenters are present in mouse embryonic stem cells but become significantly reduced in size when macroH2A1 was depleted (Fig. S4A,B). Next, we wished to test whether the observed deregulation of heterochromatin architecture would compromise the silencing of repeats. As shown in Fig. 4B,
Fig. 4. MacroH2A maintains heterochromatic architecture. (A) Fluorescent in situ hybridization of rDNA 45S and SAT2 (upper and middle panel) and H3K9me3 immunostaining (bottom panel) on nuclei from HepG2 control cells (sh control) and cells depleted of macroH2A1 and macroH2A2 (sh mH2A1/2) is shown in green. Nuclei were counterstained with DAPI (gray). On the right, quantifications are given in box plots: top, number of rDNA foci detected per nucleus in control and knockdown conditions (control, n=81; sh mH2A1/2, n=62); middle, fraction of the nucleus occupied by SAT2 repeats as a percentage of nucleus area (control n=79; sh mH2A1/2 n=125); bottom, fraction of the nucleus occupied by H3K9me3 domains as a percentage of nucleus area (control n=229; sh mH2A1/2 n=215). In the plots, the box represents the 25–75th percentiles, and the median is indicated. The whiskers show the highest and lowest data point within the 1.5× interquantile range of the upper and lower quartile, respectively, and outliers are indicated. (B) RT-qPCR analysis of RNA levels in the same cells as A. Levels in control cells have been set to one. Reactions without reverse transcriptase have been included to determine the background of the detection method (RT-). Values were normalized to the expression of the two housekeeping genes RPO and GAPDH. Data is shown as mean+s.e.m. (n=3). (C) Local openness of repeats assayed by FAIRE in sh control and sh mH2A1/2 HepG2 cells. Data is plotted as the percentage of FAIRE-extracted DNA with respect to DNA from input material. The genes CNTNAP2 and MBOAT7 have been included as previously described closed and open control loci, respectively (Simon et al., 2012). Data is shown as mean+s.e.m. (n=3). (D) H3 occupancy on repeats assayed by ChIP in HepG2 control cells and sh mH2A1/2 knockdown cells. The same loci as in C were used as controls. Data is shown as mean+ s.e.m. (n=3).
Journal
of
Cell
we used quantitative real-time reverse transcriptase (qRT-PCR) to measure the levels of transcripts from a panel of repeats and observed an increase of RNA transcripts for all of them. The impact on transcript level varied and ranged from a subtle increase in 5S ribosomal RNA to a 3-fold increase of DXZ4 transcripts. These results suggest that macroH2A proteins have a major contribution to the three-dimensional architecture of repeats and a minor contribution to their transcriptional repression.
Next, we asked how macroH2A could mediate its function in modulating heterochromatin architecture. Specifically, we wondered whether loss of macroH2A would affect the compaction and condensation of heterochromatin at the level of the DNA fiber. For this, we used two complementary methods to measure the openness and nucleosome density. First, we used a formaldehyde-assisted isolation of regulatory elements (FAIRE) assay (Simon et al., 2012) to assess a possible change in openness. While we were able to clearly distinguish between two well-characterized open and closed gene loci, we did not detect any difference for repeats in the absence or presence of macroH2A (Fig. 4C). Second, the analysis of histone H3 occupancy similarly demonstrated that the nucleosome density is equal in control and macroH2A-depleted cell (Fig. 4D). Taken together, these results suggest that the observed expansion of territories occupied by repeats in the nuclear space is not a consequence of decondensation of the fiber but rather occurs at the level of higher-order chromatin structures.
MacroH2A is required for the attachment of repeats to lamin B1
The nuclear periphery is the region with the highest density of heterochromatin and its loss after macroH2A depletion was particular striking (Fig. 1D). Thus, we wondered whether macroH2A could be involved in mediating the interaction of heterochromatic repeats with the nuclear lamina. Interestingly, we found that knockdown of the protein lamin B1, which is consistently lamina associated, resulted in an increase of the space occupied by the SAT2 repeat that was reminiscent of the phenotype caused by macroH2A depletion (Fig. S4C–E). Thus, we decided to test for a potential interaction between macroH2A-containing chromatin fibers and lamin B1. We used an in situ proximity ligation assay (PLA), which is based on the proximity of two antibody-binding events and can detect interactions for a distance of up to 40 nm. As chromatin fibers are expected to be between 10 nm and 30 nm in size, PLA is useful and has previously been used for the study of interactions between histone modifications and nucleosolic lamins (Cesarini et al., 2015). As shown in Fig. 5A, we were able to detect interactions between lamin B1 and both macroH2A1 and macroH2A2. The number and location of detected interactions between macroH2A proteins and lamin B1 was similar to the interactions between individual lamin B1 proteins detected with two different antibodies (Fig. S5A,B). The specificity of the PLA signal is shown by the significant reduction in the number of signals in macroH2A-depleted cells (Fig. 5B). Using the same approach, we found that the interaction between macroH2A1 and H3K9me3 was primarily detected at the nuclear periphery and thus in close proximity to the lamina (Fig. 5C).
As LADs are to a large extent consistent between cell types (Meuleman et al., 2013), we mapped the enrichment of macroH2A reads from our ChIP-seq experiment in HepG2 cells across borders of LADs that were previously mapped in human IMR90 fibroblasts (Shah et al., 2013). As shown in Fig. 5C, both macroH2A1 and macroH2A2 were enriched on LADs compared to neighboring
regions. The mapping of HepG2 ChIP-seq data from the ENCODE project (ENCODE Project Consortium, 2012) confirmed the enrichment of H3K9me3 and the depletion of the transcription-associated mark H3K36me3 and RNA polymerase II on LADs (Fig. 5D).
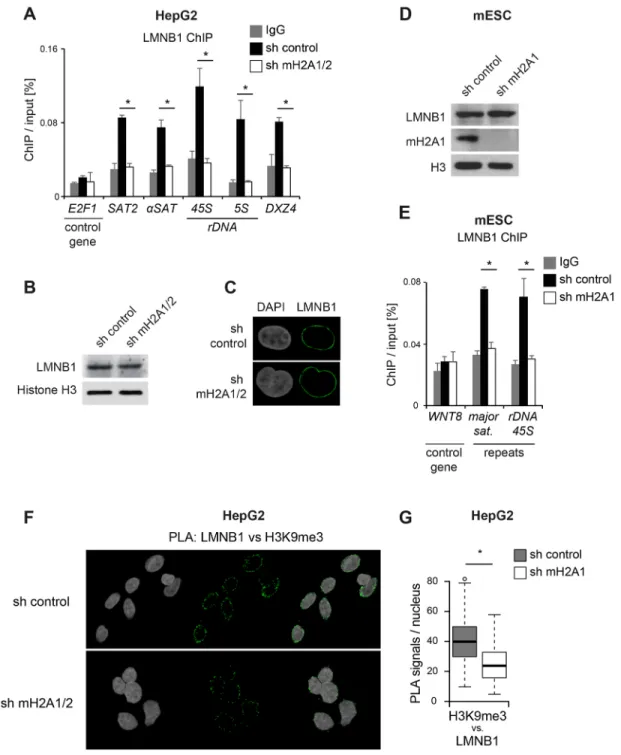
Having confirmed the interaction of macroH2A with lamin B1 in HepG2 cells, we addressed the key question of whether macroH2A would be required to mediate the interaction of repeat DNA with lamin B1. For this, we performed ChIP experiments with a lamin B1 antibody in control and macroH2A-depleted cells. We found that lamin B1 was significantly enriched on all repeats and that this enrichment was lost in macroH2A-depleted cells (Fig. 6A), while overall levels and localization of lamin B1 was unaffected (Fig. 6B,C). To validate the finding on a more general level, we repeated the experiment with a different cell type from a different species and repressed the expression of macroH2A with a different hairpin vector. Analogous to the experiment in HepG2 cells, we observed that the highly efficient depletion of macroH2A1 in mouse embryonic stem cells did not affect the protein level of lamin B1 (Fig. 6D) but completely abolished its interaction with the tested repeats (Fig. 6E). Finally, we again used PLA to measure the interaction between H3K9me3 and lamin B1 in HepG2 cells. As expected, the interaction between H3K9me3 and lamin B1 was detected at the nuclear periphery (Fig. 6F). In further support of the ChIP experiments, this interaction was reduced in macroH2A-depleted cells (Fig. 6F,G).
Taken together, our results identify a major function for macroH2A in nuclear organization. This function includes the maintenance of heterochromatin architecture, which macroH2A mediates at least in part by promoting the interaction of H3K9me3-marked repeats with lamin B1.
DISCUSSION
In this study, we provide compelling evidence for an important role for macroH2A histone variants in global nuclear organization. We have focused on the substantial– but until now underestimated – association of macroH2A with H3K9me3-marked heterochromatin. This includes well-known heterochromatin repeats such as pericentromeric satellites but also small regions of interstitial heterochromatin of a few kilobases found embedded in other chromatin environments. We find that macroH2A proteins are required for maintaining proper heterochromatin architecture, at least in part by mediating the interaction of these DNA elements with the nuclear lamina protein lamin B1. Here, we discuss the molecular and physiological implications of these findings.
MacroH2A is required for heterochromatin architecture
The loss of macroH2A proteins results in major changes in the three-dimensional organization of constitutive heterochromatin in the nuclear space. Domains occupied by specific repeat sequences were disorganized, partially decondensed and fragmented, an effect that correlated with a loss of lamin B1 binding. Wen and co-workers have reported an enrichment of macroH2A1 in biochemical purifications of lamin B1 (Fu et al., 2015). Extending this finding, we were able to show that this interaction occurs at the nuclear periphery and that macroH2A is required for the binding of lamin B1 to H3K9me3-marked repeats. While previous studies in C. elegans and human cells have demonstrated a role for readers and writers of H3K9 methylation in mediating the tethering of repeats to the nuclear lamina (Bian et al., 2013; Gonzalez-Sandoval et al., 2015; Kind et al., 2013; Towbin et al., 2012), our results now add macroH2A as a novel player in this process. MacroH2A might either
Journal
of
Cell
provide an additional interaction surface or stabilize the function of other factors. In particular, it is presently not clear whether the interaction between macroH2A and lamin B1 is direct or indirect.
Importantly, we find that the influence of macroH2A loss on heterochromatin architecture was not restricted to heterochromatin proximal to the nuclear lamina but rather occurred globally throughout the nucleus including in the nucleosol and on the surface of nucleoli. This suggests that macroH2A proteins also contribute to heterochromatin architecture through a lamin B1-independent mechanism. A study in Arabidopsis has provided an important clue as to how this could occur. Arabidopsis lacks macroH2A proteins but
contains H2AW histone variants that resemble macroH2A variants without the macro domain. H2AW variants were shown to contribute to heterochromatin condensation in the nucleosol by mediating fiber– fiber interactions (Yelagandula et al., 2014). The Luger laboratory has previously shown that the linker domain of macroH2A1 has a similar condensation capacity in vitro (Muthurajan et al., 2011). Thus, it is conceivable that macroH2A might exert its function in heterochromatin architecture by mediating fiber–fiber interactions as well as an interaction with lamin B1 at the nuclear periphery. Future work will need to dissect the individual contributions of these two mechanisms and to assess their possible interdependence.
Fig. 5. MacroH2A proteins interact with lamin B1. (A) Detection of lamin B1 (LMNB1) and macroH2A interaction by PLA in control HepG2 cells (sh control) and cells depleted of macroH2A1 and macroH2A2 (sh mH2A1/2 cells). PLAs with anti-LMNB1 antibody alone and in combination with a different anti-LMNB1 antibody were included as negative and positive controls, respectively (see Fig. S5). Cells were counterstained with DAPI. (B) Quantification of detected PLA signals per nucleus in the images obtained in A. A Wilcoxon rank sum test was used to compare the control and sh mH2A1/2 groups, n≥100. In the plots, the box represents the 25–75th percentiles, and the median is indicated. The whiskers show the highest and lowest data point within the 1.5× interquantile range of the upper and lower quartile, respectively, and outliers are indicated. (C) Detection of H3K9me3–macroH2A1 interaction by PLA in control HepG2 cells and sh mH2A1/2 cells. Cells were counterstained with DAPI. (D) Plots show normalized read coverage of different marks over 1962 previously defined LAD borders (Shah et al., 2013). Coverage is expressed as the log2ratio between signal and input normalized by the RPKM. Dashed line marks the 5′ border of the LADs.
Journal
of
Cell
It is interesting to point out that the hypothetical existence of two parallel mechanisms is able to explain the large-scale re-organization of heterochromatin observed during senescence. Senescence is characterized by a progressive loss of lamin B1 proteins (Freund et al., 2012; Shah et al., 2013) and the accumulation of dense macroH2A-containing heterochromatin
foci in the nucleosol (Zhang et al., 2005). This could reflect a loss of macroH2A–lamin B1-mediated tethering accompanied by persistent macroH2A-dependent fiber–fiber interactions.
In conclusion, taking our and Wen’s results (Fu et al., 2015) together, they make a strong case for a general function of macroH2A proteins in heterochromatin architecture that is
Fig. 6. MacroH2A is essential for interaction of lamin B1 with repeats. (A) Lamin B1 (LMNB1) occupancy on repeats was analyzed by ChIP-qPCR in control HepG2 cells (sh control) and cells depleted of macroH2A1 and macroH2A2 (sh mH2A1/2 cells). Data is represented as mean+s.e.m. (n=3). *P<0.05 (Student’s two-tailed t-test). (B) LMNB1 immunostaining in HepG2 sh control and sh macroH2A1/2 (mH2A1/2) double knockdown cells. DNA was counterstained with DAPI. (C) Western blot analysis of lamin B1 and histone H3 in the same cells. (D) Western blot analysis of macroH2A1, LMNB1 and histone H3 in mouse embryonic stem cells (ESC) cells stably expressing control sh RNA or sh mH2A1. (E) LMNB1 occupancy on repeats was analyzed by ChIP-qPCR in the ESCs shown in A. Data is represented as mean+s.e.m. (n=3). *P<0.05 (Student’s two-tailed t-test). (F) Detection of LMNB1–H3K9me3 interaction by PLA in control HepG2 cells and sh mH2A1/2 cells. Cells were counterstained with DAPI. (G) Quantification of detected PLA signals per nucleus in the images obtained in (F). A Wilcoxon rank sum test was used to compare the control and sh mH2A1/2 groups (n=97). In the plots, the box represents the 25–75th percentiles, and the median is indicated. The whiskers show the highest and lowest data point within the 1.5× interquantile range of the upper and lower quartile, respectively, and outliers are indicated. *P<0.05 (Wilcoxon rank sum test).
Journal
of
Cell
conserved from mouse to man, likely across all macroH2A-containing species. Since repetitive DNA constitutes about 60–70% of the mammalian genome (Padeken et al., 2015), it is fair to say that the organization of these repeats in proper heterochromatin is a major function of macroH2A proteins.
MacroH2A is essential to maintain nuclear integrity
Apart from the reorganization of heterochromatic domains, we describe here a strong nuclear phenotype with a significantly increased proportion of irregular and larger nuclei in macroH2A-depleted cells. In addition, the nucleolar compartment displayed a general expansion and a severe disorganization including a loss of nuclei-associated heterochromatin. Although nuclear lamina and the nucleolar periphery are spatially and structurally distinct, they represent a similar environment for chromatin containing mostly the same heterochromatic repeat sequences (Németh et al., 2010; van Koningsbruggen et al., 2010). Indeed, the same locus located at the nuclear periphery can be associated with the nucleolus of the daughter cells after cell division (Kind et al., 2013). It is interesting to point out that nucleoli were found to undergo major restructuration after lamin B1 depletion (Martin et al., 2009) suggesting a link between both compartments.
It is conceivable that the changes in nuclear shape and nucleolar organization are caused by macroH2A-dependent changes in heterochromatin structure. As such, our results further strengthen the idea that the nuclear shape does not only delimit the organization of chromatin but that also vice versa, that the chromatin structure determines the nuclear shape.
The fact that macroH2A can be also found in other chromatin environments provokes the intriguing speculation that the role of macroH2A in contributing to higher-order chromatin structures might not be limited to constitutive heterochromatin but be much more global. For instance, both epigenomic as well as imaging studies have pointed out that an important fraction of macroH2A is associated with polycomb-marked chromatin (Buschbeck et al., 2009; Chadwick and Willard, 2004; Gamble et al., 2010). Ongoing work in our laboratory is addressing the question of whether macroH2A plays a role in the three-dimensional organization of polycomb domains.
The link between nuclear architecture and cell fate
Loss-of-function studies in development, cancer and somatic cell reprogramming have allowed the conclusion that macroH2A proteins contribute to maintaining the differentiated state of a cell by a yet unknown mechanism (reviewed in Posavec et al., 2013). Here, we show that macroH2A is required for the establishment and/ or the maintenance of heterochromatin. The observed partial de-repression of some of these sequences in macroH2A-depleted cells is possibly secondary to changes in higher-order chromatin architecture including loss of perinuclear tethering. An elegant study by Gasser and co-workers has demonstrated tethering is essential for maintaining a developmentally induced cell fate in C. elegans (Gonzalez-Sandoval et al., 2015). Additionally, Robson and colleagues have shown that a set of nuclear envelope transmembrane proteins is implicated in the relocalization and the transcriptional regulation of genes involved in myogenic differentiation (Robson et al., 2016).
In contrast to its function in differentiation, macroH2A is a major barrier to the de-differentiation occurring during somatic cell reprogramming (Barrero et al., 2013b; Gaspar-Maia et al., 2013; Pasque et al., 2013, 2011). Successful reprogramming requires the removal of somatic repressive marks to reach a chromatin state
almost devoid of heterochromatin, and thus the dissolution of large heterochromatic domains represents a major obstacle in this process (Soufi et al., 2012; Sridharan et al., 2013). Hence, the stabilization of heterochromatin by macroH2A reported here provides a possible explanation for its barrier function in somatic reprogramming.
Future work will need to address the question of whether the changes in chromatin structure favor cancer by increasing the epigenetic plasticity or whether specific gene deregulation events drive cancer as suggested for the upregulation of the oncogene CDK8 in macroH2A-deficient melanoma (Kapoor et al., 2010). Furthermore, it will be interesting to dissect whether relevant changes in cancer gene expression are a bystander effect of the massive genome re-organization caused by loss of macroH2A. It is plausible that the stabilization of structures is stabilizing gene expression programs and that, in the context of repression, some activating signals will overcome repression in the absence but not presence of macroH2A. In support of this idea it was shown that a combination of the gene-activating anti-cancer drugs azacitidine and trichostatin were able to reactivate a repressed transgene on the inactive X chromosome only after depletion of macroH2A (Hernández-Muñoz et al., 2005).
In conclusion, macroH2A has a major function in chromatin architecture that we have studied on constitutive heterochromatin but that might not be limited to it. The stabilization of heterochromatin architecture and possibly other chromatin structures has great potential to provide a molecular explanation for its functions in development, cancer and somatic cell reprogramming. We would like to suggest that macroH2A should be considered as a global stabilizer of the genome and that its role in gene expression is likely to be secondary to its role in higher-order chromatin architecture.
MATERIALS AND METHODS Cell culture and gene transduction
The human male heptoblastoma cell line HepG2 and HEK293T cells were
obtained from ATCC, and were authenticated and cultured in Dulbecco’s
modified Eagle medium (DMEM, Gibco) containing
penicillin-streptomycin, 10% fetal bovine serum (FBS) and 2 mM L-glutamine at
37°C in 5% CO2. For the culture of mouse embryonic fibroblasts (MEFs),
the medium was further supplemented with 0.1 mMβ-mercaptoethanol, 1×
non-essential amino acids, 1 mM Na-pyruvate. MEFs were prepared from wild-type and macroH2A1-null mice (Boulard et al., 2010) using standard
methods. Briefly, embryonic day (E)13.5–14.5 embryos were collected,
cleaned with PBS, and processed (removal of the head and internal organs). The remaining embryos were minced and incubated in trypsin solution for 5 min at 37°C. Cells that remain in suspension were transferred in pre-warmed medium, washed one time in the same buffer and then plated in a 150 mm plate. Gene transduction with retroviral vectors was performed as described previously (Cantariño et al., 2016). Transduced cells were
selected with 2μg/ml puromycin and 150 μg/ml hygromycin. Mouse E14
embryonic stem cells carrying stable shRNA cassettes were as described previously (Creppe et al., 2012a). All animal experiments were performed according to approved guidelines.
Antibodies and plasmids
We made use of the following antibodies: anti-IgG (Abcam, ab46540; ChIP,
3μg for 30 μg of chromatin), anti-H3 C-terminal (Abcam, ab1791; ChIP,
1μg for 30 μg of chromatin), anti-H3K9me3 [Abcam, ab8898; ChIP, 3 μg
for 30μg of chromatin; immunofluorescence (IF), 1:100], anti-H3K9me3,
mouse monoclonal (Sigma, SAB4800018; PLA, 1:200),
anti-nucleophosmin (Abcam, ab10530; IF, 1:100), anti-H3K27me3 (Millipore,
07-449, batch 2194165; ChIP, 3μg for 30 μg of chromatin), ANTI-FLAG®
M2 Affinity beads [Sigma-Aldrich, A2220; immunoprecipitation (IP), 20μl
for 1 ml of nuclear extract lysate], anti-lamin B1 rabbit polyclonal antibody
Journal
of
Cell
(Santa Cruz Biotechnology, sc-20682, clone H90; ChIP, 1μg for 30 μg of chromatin; IF, 1:100; PLA, 1:50), anti-lamin B1, mouse monoclonal, Thermo Fisher (MA1-06103, clone 119D5-F1; PLA, 1:50), anti-macroH2A1 and anti-macroH2A2 as described previously (Buschbeck et al., 2009). The specificity of macroH2A antibodies was verified by western blotting, chromatin immunoprecipitation and immunofluorescence (Fig. S1). We used previously described pRetroSUPER constructs for shRNA-mediated knockdown of macroH2A1 and macroH2A2 (Buschbeck et al., 2009). The shRNA cassette directed against macroH2A2 was shuttled into a pRetroSUPER-hygromycin-resistant backbone to permit the generation of macroH2A1/2 double knockdown cells. Two different lamin B1-specific shRNAs expressed from lentiviral PLKO.1-puro backbone were
ordered from Sigma: shRNA#1: 5
′-CCGGGCTCAAAGAAGTACAGTC-TTTCTCGAGAAAGACTGTACTTCTTTGAGCTTTTTG-3′, shRNA#2:
5
′-CCGGCGCTTGAAGAACACTTCTGAACTCGAGTTCAGAAGTG-TTCTTCAAGCGTTTTT-3′.
Transmission electron microscopy
Cells were washed in PBS ( pH 7.2) and fixed in 1.6% glutaraldehyde diluted in 0.1 M PBS ( pH 7.2) at room temperature; after 1 h, they were washed in the same buffer. The samples were acetylated according to Thiry et al. (1985) before being embedded in Epon. Ultrathin sections mounted on copper grids were stained with uranyl acetate and lead citrate before examination with a Jeol JEM 1400 transmission electron microscope (TEM) at 80 kV.
Immunofluorescence staining, FISH and PLA
For immunofluorescence staining, cells were grown on polylysine-coated slides and fixed in PBS with 4% paraformaldehyde (PFA) for 10 min at room temperature, permeabilized in 0.1 M HCl with 0.5% Triton X-100 for 10 min at room temperature (RT) and blocked with PBS with 0.1% Tween (PBT) and 5% bovine serum albumin (BSA) for 1 h at RT. Primary antibodies were diluted in PBT with 5% BSA and incubated for 1 h at RT. After successive washes with PBT, secondary antibodies conjugated to Alexa Fluor 488 or 594 (Thermo Fisher) were diluted in PBT with 5% BSA and incubated for 30 min. After successive washes with PBT and PBS,
slides were mounted with Vectashield®Mounting Medium with DAPI.
Fluorescence in situ hybridizations (FISH) and slide preparations were performed as described previously (Bolland et al., 2013). FISH probes were PCR-labeled using dUTP-biotin (Roche) and detected with streptavidin conjugated to Alexa Fluor 488 (Thermo Fisher) or Tyramide Signal Amplification (Thermo Fisher). For the proximity ligation assay (PLA), cells were grown on 12 mm coverslips. Prior to fixation in PBS with 4% PFA for 10 min at RT, cytoplasm was removed with CSK buffer (100 mM
NaCl, 300 mM sucrose, 3 mM MgCl2, 10 mM PIPES, 1:200 leupeptin and
1:100 PMSF) for 5 min on ice. Nuclei were permeabilized in 0.1 M HCl with 0.5% Triton X-100 for 10 min at RT and blocked with PBT with 5% BSA for 30 h at RT. Primary antibodies were diluted in PBT with 5% BSA at
a concentration of 10 ng/μl and incubated overnight at 4°C. Then, detection
of protein interactions was performed using the Duolink system
(Sigma-Aldrich) according to the manufacturer’s instructions.
Microscopy, image acquisition and analysis
Confocal optical z-stacks of images were obtained by using a Zeiss LSM 710 confocal laser-scanning microscope equipped with a 63×1.4 NA Plan-Apochromat oil immersion objective. Fluorochromes were excited with the following laser lines: 405 nm (for DAPI detection), 488 nm (for Alexa Fluor 488 detection) and 594 nm (for Alexa Fluor 594 detection). Laser intensity and gain parameters were set to ensure proper exposure without saturated pixels. Ribosomal DNA FISH images were obtained using a Zeiss AxioObserver Z1 fluorescence microscope equipped with a 63×1.4 NA Plan-Apochromat oil immersion objective. All acquisition parameters were kept equal during imaging of each experiment. Images were loaded and analyzed in Fiji, a distribution of ImageJ (Schindelin et al., 2012), using custom macro scripts that are available from the authors upon request. Briefly, image stacks were converted to maximum intensity z-projections, background was subtracted with a rolling ball algorithm and the signal was
automatically thresholded with built-in methods. Artifacts were removed after thresholding with noise removal and binary processing functions of the software. Nuclei, FISH spots and H3K9me3 foci were automatically identified with particle analyzer and measured. Nucleoli were manually
segmented from maximum intensity z-projections of NPM1
immunostaining images. For the PLA experiment, 3D stack-images were acquired by confocal microscopy. Then, cell nuclei were segmented from the DAPI channel z-stacks by using an automatic threshold (default built-in method) and a watershed algorithm. PLA signal blobs were identified from the green channel image stacks and assigned to the corresponding segmented nuclei with the FindFoci plugin (Herbert et al., 2014) with optimized parameters. All images of the different experimental conditions were analyzed under the same parameters.
ChIP, qRT-PCR and FAIRE
Chromatin immunoprecipitation (ChIP) experiments were performed and analyzed essentially as previously described (Buschbeck et al., 2009). ChIP results are given as the percentage of ChIP over 10% of input material. Formaldehyde-assisted isolation of regulatory elements (FAIRE) assay was performed as described in Simon et al. (2012). Regions of interest were analyzed by qRT-PCR. All primers are listed in Table S2.
ChIP-seq and association analysis
ChIP-seq data has been deposited in the Gene Expression Omnibus (GEO)
under accession number GSE58175 (https://www.ncbi.nlm.nih.gov/
geo/query/acc.cgi?acc=GSE58175). DNA enriched by ChIP was
fluorometrically quantified with PicoGreen and 10 ng were used for library preparation. Library generation and direct massive parallel sequencing on an Illumina genome analyzer were performed according to
the supplier’s instructions at the core facility of the EMBL (Heidelberg,
Germany). The reads obtained were cleaned based on quality, and trimmed using Sickle (https://github.com/najoshi/sickle) and Cutadapt (Martin, 2011), and aligned versus the human genome (GRCh37/hg19) using Bowtie 2 (Langmead and Salzberg, 2012) version 2.0.6, with the sensitive preset option (-D 15 -R 2 -L 22 -i S,1,1.15). To detect genomic regions enriched for multiple overlapping peaks, MACS software version 1.4.2 was
used (Zhang et al., 2008) with a P-value cutoff of 1.0×10⁻⁵and a false
discovery rate (FDR) of 5%. The enrichment profiles were calculated using the ngsplot ver 2.0 program (Shen et al., 2014). Screenshots of regions of interest were taken from the UCSC genome browser (Karolchik et al., 2013). A list of all positions shown is given in Table S1. To calculate the association between regions ( peaks or DNA elements) we used regioneR, an R package based on permutation tests (Gel et al., 2016). To compare the associations between them, the calculated z-scores were normalized by
dividing them bypn, where n refers to the number of regions in the region
sets tested. We have further analyzed the following data sets generated by the ENCODE Project Consortium (Encode Project Consortium, 2012): HepG 2×75 Sg 2 RNA-seq (GEO, GSM958732; UCSC, wgEncodeEH000127); HepG2 H3K9m3 (GEO, GSM1003519; UCSC, wgEncodeEH003087); HepG2 H3K27m3 (GEO, GSM733754; UCSC, wgEncodeEH001023); and Repeatmasker (Smit, A., Hubley, R. and Green, P.; RepeatMasker Open-4.0. 2013-2015; http://www.repeatmasker.org/).
To calculate the coverage of ChIP-seq reads around LAD borders, we used the deepTools software v2.2.2 (Ramirez et al., 2014). The coverage is
expressed as the log2ratio between signal and input normalized by the reads
per kilobase of transcript per million mapped reads (RPKM) for a region centered on LAD borders ±100 kb with a 2 kb sized bin. We have used LAD borders previously defined with a LMNB1 ChIP-seq in human IMR90 cells (Shah et al., 2013).
Analysis of proteins and post-translational modifications Standard lysis and western blot analyses were performed as previously described (Buschbeck et al., 2009). For immunoprecipitation (IP) of FLAG-tagged macroH2A1.2, two P10 plates of cells stably expressing FLAG– MacroH2A1.2 were collected and lysed with a buffer containing 0.32 M
sucrose, 10 mM Tris-HCl pH 8, 3 mM CaCl2, 2 mM MgAc, 0.1 mM EDTA
and 0.1% Triton X-100. Intact nuclei were resuspended in 500μl buffer
Journal
of
Cell
composed of 135 mM NaCl, 10 mM Tris-HCl pH 7.4, 10% glycerol, 0.1%
Triton X-100 and 2 mM CaCl2. Extracts were digested with 5 U of MNase
20 min at 26°C, and the reaction stopped with 1:50 0.5 M EGTA. Supernatants were collected after centrifugation for 5 min at 1000 g. The remaining pellets were resuspended in EX100 buffer, sonicated with a Bioruptor machine (2 min, high intensity, 30 s on-30 s off ) and pooled with supernatants. After the pre-clearing with a Sepharose bead slurry (Sigma), the
input sample was collected and 20μl FLAG bead slurry (Sigma) was added to
each replicate. After 2 h incubation, FLAG beads were washed and the
technical replicates were pooled and resuspended in 50μl Laemmli buffer. pH
was adjusted with 0.5 M Tris-HC,l pH 6.8. For western blotting, 0.5% of input and 20% of IP material were loaded. Pure modified histone H3 proteins generated by chemical ligation were kindly provided by Till Bartke (Imperial College London, UK) and used as a reference samples (Bartke et al., 2010). Statistics
Unless indicated otherwise, qRT-PCR and ChIP data is represented as the mean of at least three independent experiments, error bars denote the standard error of the mean (s.e.m.). Statistical tests used to calculate P-values are stated in the figure legends.
Acknowledgements
We thank Till Bartke for essential tools, P. Piscicelli for the preparation of TEM samples and Hélène Delage for technical support.
Competing interests
The authors declare no competing or financial interests.
Author contributions
Conceptualization: J.D. and M.B. Methodology: J.D., R.M., D.C., F.M., M.P.M. Formal Analysis: J.D., R.M., D.C., A.I., M.T. Investigation: J.D., D.C., N.C., V.V., V.S., J.R. Resources: P.B. Writing– Original Draft: J.D. and M.B. Writing – Review & Editing: J.D. and M.B. Supervision: M.B. Project Administration: M.B. Funding Acquisition: J.D. and M.B.
Funding
This work was supported by grants from Ministerio de Economı́a y Competitividad (MINECO) (BFU2015-66559-P), the José Carreras Leukämie-Stiftung (DJCLS R 14/16), AFM-Téléthon (AFM 18738), the H2020 Marie Skłodowska-Curie Actions Training network‘ChroMe’ (H2020-MSCA-ITN-2015-675610), Agència de Gestió d’Ajuts Universitaris i de Recerca (2014-SGR-35). D.C. was supported by a Ministerio de Educación, Cultura y Deporte (MECD)-funded FPU fellowship (FPU14/ 06542). V.S. was funded by a Marie Curie Fellowship (INTEGER 214902) and a grant from the European Network of Excellence grant (EpiGeneSys 257082) support from the European Commission. N.C. was supported by a FPI PhD fellowship (BES-2010-031876), and J.D. by a Juan de la Cierva fellowship (JCI-2011-10831), both from the Ministerio de Economı́a y Competitividad (MINECO). Research leading to inventions at the IJC is supported by the“la Caixa” Foundation, the Fundació Internacional Josep Carreras, Celgene, Spain, and the Centres de Recerca de Catalunya, Generalitat de Catalunya.
Data availability
The ChIP-seq data from this study has been deposited in the Gene Expression Omnibus under accession number GSE58175 (https://www.ncbi.nlm.nih.gov/geo/ query/acc.cgi?acc=GSE58175).
Supplementary information
Supplementary information available online at
http://jcs.biologists.org/lookup/doi/10.1242/jcs.199216.supplemental
References
Amendola, M. and van Steensel, B. (2014). Mechanisms and dynamics of nuclear lamina–genome interactions. Curr. Opin. Cell Biol. 28, 61-68.
Barrero, M. J., Sese, B., Marti, M. and Izpisua Belmonte, J. C. (2013a). Macro histone variants are critical for the differentiation of human pluripotent cells. J. Biol. Chem. 288, 16110-16116.
Barrero, M. J., Sesé, B., Kuebler, B., Bilic, J., Boue, S., Martı́, M. and Belmonte, J. C. I. (2013b). Macrohistone variants preserve cell identity by preventing the gain of H3K4me2 during reprogramming to pluripotency. Cell Rep. 3, 1005-1011. Bartke, T., Vermeulen, M., Xhemalce, B., Robson, S. C., Mann, M. and
Kouzarides, T. (2010). Nucleosome-interacting proteins regulated by DNA and histone methylation. Cell 143, 470-484.
Bian, Q., Khanna, N., Alvikas, J. and Belmont, A. S. (2013).β-Globin cis-elements determine differential nuclear targeting through epigenetic modifications. J. Cell Biol. 203, 767-783.
Bolland, D. J., King, M. R., Reik, W., Corcoran, A. E. and Krueger, C. (2013). Robust 3D DNA FISH using directly labeled probes. JoVE 78, e50587. . Boulard, M., Storck, S., Cong, R., Pinto, R., Delage, H. and Bouvet, P. (2010).
Histone variant macroH2A1 deletion in mice causes female-specific steatosis. Epigenet. Chromat. 3, 8.
Bouzinba-Segard, H., Guais, A. and Francastel, C. (2006). Accumulation of small murine minor satellite transcripts leads to impaired centromeric architecture and function. Proc. Natl. Acad. Sci. USA 103, 8709-8714.
Buschbeck, M., Uribesalgo, I., Wibowo, I., Rué, P., Martin, D., Gutiérrez, A., Morey, L., Guigó, R., López-Schier, H. and Di Croce, L. (2009). The histone variant macroH2A is an epigenetic regulator of key developmental genes. Nat. Struct. Mol. Biol. 16, 1074-1079.
Cantariño, N., Douet, J. and Buschbeck, M. (2013). MacroH2A – an epigenetic regulator of cancer. Cancer Lett. 336, 247-252.
Cantariño, N., Fernández-Figueras, M. T., Valero, V., Musulen, E., Malinverni, R., Granada, I., Goldie, S. J., Martı́n-Caballero, J., Douet, J., Forcales, S. V. et al. (2016). A cellular model reflecting the phenotypic heterogeneity of mutant HRASdriven squamous cell carcinoma. Int. J. Cancer 139, 1106-1116. Cesarini, E., Mozzetta, C., Marullo, F., Gregoretti, F., Gargiulo, A., Columbaro,
M., Cortesi, A., Antonelli, L., Di Pelino, S., Squarzoni, S. et al. (2015). Lamin A/ C sustains PcG protein architecture, maintaining transcriptional repression at target genes. J. Cell Biol. 211, 533-551.
Chadwick, B. P. (2008). DXZ4 chromatin adopts an opposing conformation to that of the surrounding chromosome and acquires a novel inactive X-specific role involving CTCF and antisense transcripts. Genome Res. 18, 1259-1269. Chadwick, B. P. and Willard, H. F. (2004). Multiple spatially distinct types of
facultative heterochromatin on the human inactive X chromosome. Proc. Natl. Acad. Sci. USA 101, 17450-17455.
Changolkar, L. N. and Pehrson, J. R. (2006). macroH2A1 histone variants are depleted on active genes but concentrated on the inactive X chromosome. Mol. Cell. Biol. 26, 4410-4420.
Changolkar, L. N., Singh, G., Cui, K., Berletch, J. B., Zhao, K., Disteche, C. M. and Pehrson, J. R. (2010). Genome-wide distribution of MacroH2A1 histone variants in mouse liver chromatin. Mol. Cell. Biol. 30, 5473-5483.
Chen, H., Ruiz, P. D., Novikov, L., Casill, A. D., Park, J. W. and Gamble, M. J. (2014). MacroH2A1.1 and PARP-1 cooperate to regulate transcription by promoting CBP-mediated H2B acetylation. Nat. Struct. Mol. Biol. 21, 981-989. Cong, R., Das, S., Douet, J., Wong, J., Buschbeck, M., Mongelard, F. and
Bouvet, P. (2013). macroH2A1 histone variant represses rDNA transcription. Nucleic Acids Res. 42, 181-192.
Creppe, C., Janich, P., Cantarino, N., Noguera, M., Valero, V., Musulen, E., Douet, J., Posavec, M., Martin-Caballero, J., Sumoy, L. et al. (2012a). MacroH2A1 regulates the balance between self-renewal and differentiation commitment in embryonic and adult stem cells. Mol. Cell. Biol. 32, 1442-1452. Creppe, C., Posavec, M., Douet, J. and Buschbeck, M. (2012b). MacroH2A in
stem cells: a story beyond gene repression. Epigenomics 4, 221-227. Diesch, J., Hannan, R. D. and Sanij, E. (2014). Perturbations at the ribosomal
genes loci are at the centre of cellular dysfunction and human disease. Cell Biosci. 4, 43.
ENCODE Project Consortium. (2012). An integrated encyclopedia of DNA elements in the human genome. Nature 489, 57-74.
Freund, A., Laberge, R.-M., Demaria, M. and Campisi, J. (2012). Lamin B1 loss is a senescence-associated biomarker. Mol. Biol. Cell 23, 2066-2075.
Fu, Y., Lv, P., Yan, G., Fan, H., Cheng, L., Zhang, F., Dang, Y., Wu, H. and Wen, B. (2015). MacroH2A1 associates with nuclear lamina and maintains chromatin architecture in mouse liver cells. Sci. Rep. 5, 17186.
Gamble, M. J., Frizzell, K. M., Yang, C., Krishnakumar, R. and Kraus, W. L. (2010). The histone variant macroH2A1 marks repressed autosomal chromatin, but protects a subset of its target genes from silencing. Genes Dev. 24, 21-32.
Gaspar-Maia, A., Qadeer, Z. A., Hasson, D., Ratnakumar, K., Leu, N. A., Leroy, G., Liu, S., Costanzi, C., Valle-Garcia, D., Schaniel, C. et al. (2013). MacroH2A histone variants act as a barrier upon reprogramming towards pluripotency. Nat. Commun. 4, 1565-1512.
Gel, B., Diez-Villanueva, A., Serra, E., Buschbeck, M., Peinado, M. A. and Malinverni, R. (2016). regioneR: an R/Bioconductor package for the association analysis of genomic regions based on permutation tests. Bioinformatics 32, 289-291.
Gesson, K., Rescheneder, P., Skoruppa, M. P., von Haeseler, A., Dechat, T. and Foisner, R. (2016). A-type lamins bind both hetero- and euchromatin, the latter being regulated by lamina-associated polypeptide 2 alpha. Genome Res. 26, 462-473.
Gonzalez-Sandoval, A., Towbin, B. D., Kalck, V., Cabianca, D. S., Gaidatzis, D., Hauer, M. H., Geng, L., Wang, L., Yang, T., Wang, X. et al. (2015). Perinuclear anchoring of H3K9-methylated chromatin stabilizes induced cell fate in C. elegans embryos. Cell 163, 1333-1347.
Journal
of
Cell
Gruenbaum, Y. and Medalia, O. (2015). Lamins: the structure and protein complexes. Curr. Opin. Cell Biol. 32, 7-12.
Guelen, L., Pagie, L., Brasset, E., Meuleman, W., Faza, M. B., Talhout, W., Eussen, B. H., de Klein, A., Wessels, L., de Laat, W. et al. (2008). Domain organization of human chromosomes revealed by mapping of nuclear lamina interactions. Nature 453, 948-951.
Harr, J. C., Luperchio, T. R., Wong, X., Cohen, E., Wheelan, S. J. and Reddy, K. L. (2015). Directed targeting of chromatin to the nuclear lamina is mediated by chromatin state and A-type lamins. J. Cell Biol. 208, 33-52.
Herbert, A. D., Carr, A. M. and Hoffmann, E. (2014). FindFoci: a focus detection algorithm with automated parameter training that closely matches human assignments, reduces human inconsistencies and increases speed of analysis. PLoS ONE 9, e114749.
Hernández-Muñoz, I., Lund, A. H., van der Stoop, P., Boutsma, E., Muijrers, I., Verhoeven, E., Nusinow, D. A., Panning, B., Marahrens, Y. and van Lohuizen, M. (2005). Stable X chromosome inactivation involves the PRC1 Polycomb complex and requires histone MACROH2A1 and the CULLIN3/SPOP ubiquitin E3 ligase. Proc. Natl. Acad. Sci. USA 102, 7635-7640.
Kapoor, A., Goldberg, M. S., Cumberland, L. K., Ratnakumar, K., Segura, M. F., Emanuel, P. O., Menendez, S., Vardabasso, C., LeRoy, G., Vidal, C. I. et al. (2010). The histone variant macroH2A suppresses melanoma progression through regulation of CDK8. Nature 468, 1105-1109.
Karolchik, D., Barber, G. P., Casper, J., Clawson, H., Cline, M. S., Diekhans, M., Dreszer, T. R., Fujita, P. A., Guruvadoo, L., Haeussler, M. et al. (2013). The UCSC Genome Browser database: 2014 update. Nucleic Acids Res. 42, D764-D770.
Kind, J., Pagie, L., Ortabozkoyun, H., Boyle, S., de Vries, S. S., Janssen, H., Amendola, M., Nolen, L. D., Bickmore, W. A. and van Steensel, B. (2013). Single-cell dynamics of genome-nuclear lamina interactions. Cell 153, 178-192. Kind, J., Pagie, L., de Vries, S. S., Nahidiazar, L., Dey, S. S., Bienko, M., Zhan, Y.,
Lajoie, B., de Graaf, C. A., Amendola, M. et al. (2015). Genome-wide maps of nuclear lamina interactions in single human cells. Cell 163, 134-147.
Langmead, B. and Salzberg, S. L. (2012). Fast gapped-read alignment with Bowtie 2. Nat. Methods 9, 357-359.
Lavigne, M. D., Vatsellas, G., Polyzos, A., Mantouvalou, E., Sianidis, G., Maraziotis, I., Agelopoulos, M. and Thanos, D. (2015). Composite macroH2A/ NRF-1 nucleosomes suppress noise and generate robustness in gene expression. Cell Rep. 11, 1090-1101.
Maison, C. and Almouzni, G. (2004). HP1 and the dynamics of heterochromatin maintenance. Nat. Rev. Mol. Cell Biol. 5, 296-305.
Martin, M. (2011). Cutadapt removes adapter sequences from high-throughput sequencing reads. EMBnet. J. 17, 10-12.
Martin, C., Chen, S., Maya-Mendoza, A., Lovric, J., Sims, P. F. G. and Jackson, D. A. (2009). Lamin B1 maintains the functional plasticity of nucleoli. J. Cell Sci. 122, 1551-1562.
Meuleman, W., Peric-Hupkes, D., Kind, J., Beaudry, J.-B., Pagie, L., Kellis, M., Reinders, M., Wessels, L. and van Steensel, B. (2013). Constitutive nuclear lamina-genome interactions are highly conserved and associated with A/T-rich sequence. Genome Res. 23, 270-280.
Muthurajan, U. M., McBryant, S. J., Lu, X., Hansen, J. C. and Luger, K. (2011). The linker region of MacroH2A promotes self-association of nucleosomal arrays. J. Biol. Chem. 286, 23852-23864.
Németh, A., Conesa, A., Santoyo-Lopez, J., Medina, I., Montaner, D., Péterfia, B., Solovei, I., Cremer, T., Dopazo, J. and Lä ngst, G. (2010). Initial genomics of the human nucleolus. PLoS Genet. 6, e1000889.
Padeken, J., Zeller, P. and Gasser, S. M. (2015). Repeat DNA in genome organization and stability. Curr. Opin. Genet. Dev. 31, 12-19.
Park, S.-J., Shim, J. W., Park, H. S., Eum, D.-Y., Park, M.-T., Yi, J. M., Choi, S. H., Kim, S. D., Son, T. G., Lu, W. et al. (2015). MacroH2A1 downregulation enhances the stem-like properties of bladder cancer cells by transactivation of Lin28B. Oncogene 35, 1292-1301.
Pasque, V., Gillich, A., Garrett, N. and Gurdon, J. B. (2011). Histone variant macroH2A confers resistance to nuclear reprogramming. EMBO J. 30, 2373-2387.
Pasque, V., Radzisheuskaya, A., Gillich, A., Halley-Stott, R. P., Panamarova, M., Zernicka-Goetz, M., Surani, M. A. and Silva, J. C. R. (2013). Histone variant macroH2A marks embryonic differentiation in vivo and acts as an epigenetic barrier to induced pluripotency. J. Cell Sci. 125, 6094-6104.
Pehrson, J. R., Costanzi, C. and Dharia, C. (1997). Developmental and tissue expression patterns of histone macroH2A1 subtypes. J. Cell. Biochem. 65, 107-113.
Pehrson, J. R., Changolkar, L. N., Costanzi, C. and Leu, N. A. (2014). Mice without MacroH2A histone variants. Mol. Cell. Biol. 34, 4523-4533.
Peters, A. H. F. M., Kubicek, S., Mechtler, K., O’Sullivan, R. J., Derijck, A. A. H. A., Perez-Burgos, L., Kohlmaier, A., Opravil, S., Tachibana, M., Shinkai, Y. et al. (2003). Partitioning and plasticity of repressive histone methylation states in mammalian chromatin. Mol. Cell 12, 1577-1589.
Posavec, M., Timinszky, G. and Buschbeck, M. (2013). Macro domains as metabolite sensors on chromatin. Cell. Mol. Life Sci. 70, 1509-1524.
Ramirez, F., Dundar, F., Diehl, S., Gruning, B. A. and Manke, T. (2014). deepTools: a flexible platform for exploring deep-sequencing data. Nucleic Acids Res. 42, W187-W191.
Rice, J. C., Briggs, S. D., Ueberheide, B., Barber, C. M., Shabanowitz, J., Hunt, D. F., Shinkai, Y. and Allis, C. D. (2003). Histone methyltransferases direct different degrees of methylation to define distinct chromatin domains. Mol. Cell 12, 1591-1598.
Robson, M. I., de las Heras, J. I., Czapiewski, R., Thành, P. L., Booth, D. G., Kelly, D. A., Webb, S., Kerr, A. R. W. and Schirmer, E. C. (2016). Tissue-specific gene repositioning by muscle nuclear membrane proteins enhances repression of critical developmental genes during myogenesis. Mol. Cell 62, 834-847. Schindelin, J., Arganda-Carreras, I., Frise, E., Kaynig, V., Longair, M., Pietzsch,
T., Preibisch, S., Rueden, C., Saalfeld, S., Schmid, B. et al. (2012). Fiji: an open-source platform for biological-image analysis. Nat. Methods 9, 676-682. Shah, P. P., Donahue, G., Otte, G. L., Capell, B. C., Nelson, D. M., Cao, K.,
Aggarwala, V., Cruickshanks, H. A., Rai, T. S., McBryan, T. et al. (2013). Lamin B1 depletion in senescent cells triggers large-scale changes in gene expression and the chromatin landscape. Genes Dev. 27, 1787-1799.
Shen, L., Shao, N., Liu, X. and Nestler, E. (2014). ngs.plot: quick mining and visualization of next-generation sequencing data by integrating genomic databases. BMC Genomics 15, 284.
Simon, J. M., Giresi, P. G., Davis, I. J. and Lieb, J. D. (2012). Using formaldehyde-assisted isolation of regulatory elements (FAIRE) to isolate active regulatory DNA. Nat. Protoc. 7, 256-267.
Soufi, A., Donahue, G. and Zaret, K. S. (2012). Facilitators and impediments of the pluripotency reprogramming factors’ initial engagement with the genome. Cell 151, 994-1004.
Sridharan, R., Gonzales-Cope, M., Chronis, C., Bonora, G., McKee, R., Huang, C., Patel, S., Lopez, D., Mishra, N., Pellegrini, M. et al. (2013). Proteomic and genomic approaches reveal critical functions of H3K9 methylation and heterochromatin protein-1γ in reprogramming to pluripotency. Nat. Cell Biol. 15, 872-882.
Taddei, A., Maison, C., Roche, D. and Almouzni, G. (2001). Reversible disruption of pericentric heterochromatin and centromere function by inhibiting deacetylases. Nat. Cell Biol. 3, 114-120.
Thiry, M., Lepoint, A. and Goessens, G. (1985). Re-evaluation of the site of transcription in Ehrlich tumour cell nucleoli. Biol. Cell 54, 57-64.
Towbin, B. D., González-Aguilera, C., Sack, R., Gaidatzis, D., Kalck, V., Meister, P., Askjaer, P. and Gasser, S. M. (2012). Step-wise methylation of histone H3K9 positions heterochromatin at the nuclear periphery. Cell 150, 934-947. Trojer, P. and Reinberg, D. (2007). Facultative heterochromatin: is there a
distinctive molecular signature? Mol. Cell 28, 1-13.
van Koningsbruggen, S., Gierlinski, M., Schofield, P., Martin, D., Barton, G. J., Ariyurek, Y., den Dunnen, J. T. and Lamond, A. I. (2010). High-resolution whole-genome sequencing reveals that specific chromatin domains from most human chromosomes associate with nucleoli. Mol. Biol. Cell 21, 3735-3748. Xu, D., Li, C.-F., Zhang, X., Gong, Z., Chan, C.-H., Lee, S.-W., Jin, G., Rezaeian,
A.-H., Han, F., Wang, J. et al. (2015). Skp2-macroH2A1-CDK8 axis orchestrates G2/M transition and tumorigenesis. Nat. Commun. 6, 6641.
Yelagandula, R., Stroud, H., Holec, S., Zhou, K., Feng, S., Zhong, X., Muthurajan, U. M., Nie, X., Kawashima, T., Groth, M. et al. (2014). The histone variant H2A.W defines heterochromatin and promotes chromatin condensation in arabidopsis. Cell 158, 98-109.
Zhang, R., Poustovoitov, M. V., Ye, X., Santos, H. A., Chen, W., Daganzo, S. M., Erzberger, J. P., Serebriiskii, I. G., Canutescu, A. A., Dunbrack, R. L. et al. (2005). Formation of MacroH2A-containing senescence-associated heterochromatin foci and senescence driven by ASF1a and HIRA. Dev. Cell 8, 19-30.
Zhang, Y., Liu, T., Meyer, C. A., Eeckhoute, J., Johnson, D. S., Bernstein, B. E., Nussbaum, C., Myers, R. M., Brown, M., Li, W. et al. (2008). Model-based Analysis of ChIP-Seq (MACS). Genome Biol. 9, R137.