Publisher’s version / Version de l'éditeur:
Vous avez des questions? Nous pouvons vous aider. Pour communiquer directement avec un auteur, consultez la première page de la revue dans laquelle son article a été publié afin de trouver ses coordonnées. Si vous n’arrivez pas à les repérer, communiquez avec nous à [email protected].
Questions? Contact the NRC Publications Archive team at
[email protected]. If you wish to email the authors directly, please see the first page of the publication for their contact information.
https://publications-cnrc.canada.ca/fra/droits
L’accès à ce site Web et l’utilisation de son contenu sont assujettis aux conditions présentées dans le site LISEZ CES CONDITIONS ATTENTIVEMENT AVANT D’UTILISER CE SITE WEB.
Proceedings of the XXIVth TELEMAC-MASCARET User Conference, pp.
207-215, 2017-10-20
READ THESE TERMS AND CONDITIONS CAREFULLY BEFORE USING THIS WEBSITE.
https://nrc-publications.canada.ca/eng/copyright
NRC Publications Archive Record / Notice des Archives des publications du CNRC :
https://nrc-publications.canada.ca/eng/view/object/?id=14777c47-25c4-41c8-86b1-67e13e24d836
https://publications-cnrc.canada.ca/fra/voir/objet/?id=14777c47-25c4-41c8-86b1-67e13e24d836
This publication could be one of several versions: author’s original, accepted manuscript or the publisher’s version. / La version de cette publication peut être l’une des suivantes : la version prépublication de l’auteur, la version acceptée du manuscrit ou la version de l’éditeur.
Access and use of this website and the material on it are subject to the Terms and Conditions set forth at
Turbine array interactions and performance in TELEMAC-3D
Turbine array interactions and performance in
TELEMAC-3D
Enda Murphy
1, Julien Cousineau
1, Mitchel Provan
1National Research Council Canada / Conseil national de recherches Canada
1200 Montreal Road Ottawa, Canada
[email protected], [email protected],
Abstract— River hydrokinetic energy (RHE) turbines for
electric power generation are generally deployed in an array or farm configuration to benefit from economies of scale. To support resource assessments and decision making, RHE developers need to be able to quantify the total power that can be generated within a river reach using an array (or arrays) of RHE turbines. The total extractable power for a given site depends on (i) the drag and power characteristics of individual turbine devices, (ii) turbine wake hydrodynamics and wake interactions within arrays, and (iii) macro scale river hydrodynamics, which may be altered by the presence of turbine arrays. Quantifying total extractable power therefore requires the ability to simulate hydrodynamics at both river reach (macro) and turbine/array (micro) scales simultaneously. In this paper, we present modifications of the TELEMAC-3D source code, implemented as a first step in facilitating estimation of the total extractable power for arrays of RHE turbines. The methodology is based on the assumption that the locations, geometry and performance characteristics of individual turbines are known a priori (e.g. from CFD
simulations or physical model tests). Preliminary work to validate the methodology, by comparing the results of numerical flume tests for cylinders and simplified turbines with numerical and physical modelling data, is presented. Limitations, and future research needs to enable a unified approach to RHE resource assessment, are identified.
I. INTRODUCTION
Identifying suitable sites for river hydrokinetic energy (RHE) development requires the ability to quantify not only the potentially available (i.e. theoretical) resource within a river reach, but also the maximum portion of that resource that can be exploited using presently available RHE turbine technology. This is frequently an optimization exercise, balancing the number and configuration of RHE turbines against the impacts on river hydrodynamics to determine the maximum harvestable or extractable power. It is widely accepted that failing to incorporate the potential impacts of energy extraction on hydrodynamics can significantly overestimate the extractable resource [1].
The impacts of RHE turbine arrays on river hydrodynamics may include areas of increased and reduced flow speeds and water levels at the reach scale (hundreds of metres to kilometres). At the array scale (tens to hundreds of metres), the
wake hydrodynamics of individual turbines and turbine-wake interactions are dependent on river stage and flow conditions, turbine size and geometry, and the spacing and configuration of turbines within an array. Both the reach scale hydrodynamics and array scale hydrodynamics influence the power that can be extracted by individual turbines within an array, and therefore, the optimal array configuration and total extractable power for a river reach. For example, downstream devices in an array may experience lower flow velocities than those at the leading edge of the array, because of the velocity reduction in the wakes of the upstream devices. The turbulence generated by the wake of an upstream device or drag element may also alter the drag or thrust imparted by a downstream turbine [2] [3]. Effective resource assessment and optimization for RHE turbine farms therefore requires the ability to analyse coupling and interactions between hydrodynamics at the river reach (macro) and array (micro) scales.
As explained above, turbine-wake interactions within an array depend on the wake characteristics of individual turbines (i.e. device-scale hydrodynamics). In general, drag and wake characteristics for specific devices are known a priori for a range of flow conditions based on computational fluid dynamics (CFD) simulations or physical model testing, which are suited to resolving the high frequency motions and complex device geometries at turbine scales. Consequently, analyses of device-scale hydrodynamics can typically be decoupled from the reach- and array-scale assessments. The results of CFD modelling or physical modelling may be used to characterize wake hydrodynamics at the scale of an individual turbine, for input to separate analyses of hydrodynamics within a turbine array and / or the river reach.
This paper presents preliminary work and findings from a multi-phase research project, which will combine physical modelling, CFD modelling, and numerical hydrodynamic modelling techniques to support the development of new and improved methodologies and guidelines for RHE resource assessment.
II. STUDY BACKGROUND
The National Research Council (NRC), Natural Resources Canada and Université Laval are conducting collaborative research to improve methodologies for RHE resource assessment at river reach scales. The research programme consists of three phases: 1) laboratory physical modelling and
experiments; 2) developing new and enhanced numerical techniques to simulate turbine-turbine and turbine-river interactions; and 3) developing guidelines for turbine technology selection, optimizing turbine array configuration, and total extractable power estimation.
Physical model testing will be carried out in a laboratory flume setting for multiple turbine array configurations (side-by-side, in-line and staggered). Flow, turbulence characteristics, and other key parameters will be measured and recorded using Acoustic Doppler Velocimeters (ADV) and shear probes. The physical model test results will provide detailed information on flow and wake characteristics at individual turbine scales and within arrays of turbines.
Results from the laboratory physical model testing will be used to develop new or enhanced CFD and numerical modelling approaches to support resource assessments for large-scale RHE turbine arrays. This will facilitate: accurate assessments of drag coefficients, power coefficients and wake characteristics for individual turbines (momentum deficit and recuperation length scales); an improved understanding of confinement effects and turbine-wake interactions to enable estimates of total power extraction from large-scale turbine arrays; and analysis of the impacts of RHE turbine arrays on river hydraulics (water levels and velocities).
The numerical and physical modelling will be used to support the development of new guidelines for turbine array configuration planning/design and estimating total extractable power for river reaches. These guidelines and new/enhanced methodologies for RHE resource assessment for river-scale projects will be used as the basis for providing recommendations for the International Electrotechnical Commission Technical Standard TS 62600-301 – River Resource Assessment.
III. HYDROKINETIC TURBINES IN TELEMAC The TELEMAC system has been successfully used for hydrokinetic energy resource assessments at both tidal and riverine sites, with and without modelling the interactions between hydrodynamics and turbines [4] [5] [6] [7] [8] [2] [9] [10]. However, the majority of previous studies either: (i) do not consider turbine-wake interactions within arrays of devices; or (ii) neglect three-dimensional flow effects; both of which may be important in characterizing the extractable resource at a given site and assessing impacts.
Recent releases of TELEMAC-2D (such as v7p2r1) offer the possibility to model the effects of sub-grid scale structures (through the VERTICAL STRUCTURES keyword and DRAGFO subroutine) via a drag parameterization. This method may be applied to simulate the thrust imparted by a hydrokinetic turbine in the form of an equivalent drag force (e.g. [11] [8]). For depth-integrated models, such as TELEMAC-2D, this method amounts to increasing the bed friction coefficient. Depending on the proportion of the total water depth occupied by turbines (which can vary by location and with stage), this depth integrated approach misrepresents the drag and velocity profiles in the vertical dimension, neglecting important phenomena such as flow bypassing [12]. With advances in computing power, three-dimensional hydrodynamic models are increasingly being used for hydrokinetic energy resource assessments. Thus, recent research has focused on incorporating the effects of turbines in three-dimensional hydrodynamic
models [4] through a drag force parameterization applied as a source term in the momentum equations.
In this paper, we elaborate on the concepts presented by Bertrand el al. [4], and extend the methodology of Joly et al. [8] from TELEMAC-2D to TELEMAC-3D. Initial work to validate the methodology is presented (including comparisons with measurements from physical model tests). The source code modifications have been disseminated to the openTELEMAC-MASCARET community via the online web forum (post #20808).
IV. TURBINE DRAG AND POWER RELATIONSHIPS
A typical vertical axis (or cross-flow) RHE turbine consists of a series of blades oriented perpendicular to the flow, free to rotate in a horizontal plane about a central (vertical) shaft or hub, which is typically fixed to the river bed (Fig. 1) or supported by a barge. The frontal area (i.e. perpendicular to the flow) swept by the blades, A, is equivalent to the length of the blades multiplied by the diameter of the turbine, D.
Extracting energy from the river flow requires a reduction in the momentum of the fluid passing through the turbine. The force (or thrust) required to achieve this reduction in momentum can be parameterized as a drag force (e.g. [13]):
r r D D
AC
U
U
F
2
1
(1)where
is the density of water,C
Dis a drag coefficient, and rU
is a reference velocity at a defined location upstream of the turbine. The drag coefficient is specific to a given RHE device, and is generally a function of the flow speed. The coefficient is intrinsically linked to the reference velocity location, which is typically chosen sufficiently far upstream that the flow is not disturbed by the device.The average power extracted by a turbine over one turbine revolution is given by:
r r p
U
U
AC
P
22
1
(2)where
C
Pis a device-specific power coefficient, determined through design and testing, which defines the ratio of extractable to available power. Power extraction typically only occurs when a minimum threshold (cut-in) velocity is exceeded.Figure 1. Vertical axis turbine (image source: [14])
D/2
Flow Blades
XXIVth Telemac & Mascaret User Club Graz, Austria, 17-20 October, 2017
If the power coefficient, turbine geometry, device availability, and temporal velocity distribution at a reference location upstream of the device are all known or predictable, the energy production for an individual turbine can be determined. However, in order to predict the reference velocity distribution, it is necessary to incorporate the effects of adjacent or upstream turbines on the hydraulics within the array and river reach. The approach taken here is to apply the drag force presented in equation (1) as a source term in the three-dimensional Navier-Stokes equations to simulate the impact of an individual device on the computed hydrodynamics. Hypothetically, this approach can be implemented for multiple devices within an array to simulate the impacts on both array-scale and river-reach scale hydrodynamics. Power extraction for each device is then computed as a function of the modified flow field within the array and summed to provide the total extractable power for the array.
V. IMPLEMENTATION IN TELEMAC-3D
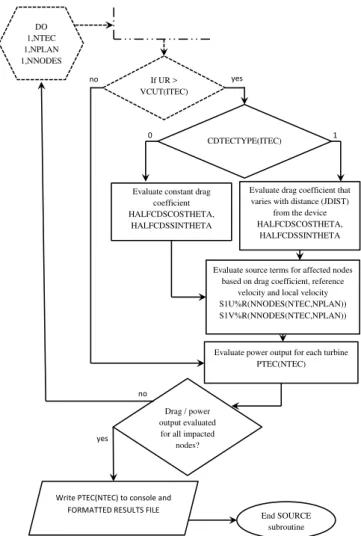
The method of implementing the impact of turbines on hydrodynamics in TELEMAC-3D (v7p2r1) presented here follows the approach of Joly et al. [8] for tidal energy converters (TECs) in TELEMAC-2D. A logic flow chart summarizing the key steps in the algorithm, as implemented by modifications to the source code, is shown in Figs. 2 and 3 and described as follows.
Figure 2. Pseudocode for implementation of the TELEMAC-3D source code modifications (part 1 of 2).
Figure 3. Pseudocode for implementation of the TELEMAC-3D source code modifications (part 2 of 2).
First, parameters and variables specific to the turbine geometry are defined within the TEC_PARAM module for dynamic allocation at runtime. The remaining modifications to the source code are made within the SOURCES subroutine, which is called by the main TELEMAC-3D subroutine at each time step.
At the first time step in a simulation (LT = 1), the geometry and drag characteristics of each turbine are read from the FORMATTED DATA FILE 1, specified by the user within the simulation steering file. For each user-specified device, up to the total number of devices (NTEC) the subroutine loops through the model mesh to identify mesh elements encompassed by the turbine geometry. Elements at the user-specified reference velocity distance surrounding the device are also identified and saved in an array (DDELEM).
At all subsequent time steps, the subroutine loops through the model mesh and evaluates the horizontal reference velocity components and magnitude (UREFX, UREFY and UR) upstream of the device (based on the flow direction at the device). Assuming the reference velocity exceeds the cut-in velocity for the device (VCUT), the drag force to be applied is evaluated from eqn. (1) based on the drag coefficient and drag distribution for each device given by the user in the FORMATTED DATA FILE 1. For simplicity, Fig. 3 shows two
TEC Module
Declare turbine parameter variables SOURCE
subroutine
If LT = 1
Read turbine geometry and drag characteristics from FORMATTED DATA FILE 1
DO 1,NTEC DO 1,NPLAN DO 1,NPOIN2 DO 1,NTEC DO 1,NPLAN DO 1,NNODES Save TECELEM(NTEC,NPLAN) DDELEM(NTEC,NPLAN,-180:180) All impacted elements identified?
Evaluate velocity at turbine UTECX, UTECY
Evaluate flow angle at turbine ALPHA Evaluate velocity at reference location upstream
UREFX, UREFY, UR
Evaluate velocity at affected nodes UI, VI If UR > VCUT(ITEC) TELEMAC3D no yes yes no yes no
Evaluate constant drag coefficient HALFCDSCOSTHETA,
HALFCDSSINTHETA
Write PTEC(NTEC) to console and FORMATTED RESULTS FILE
Evaluate source terms for affected nodes based on drag coefficient, reference
velocity and local velocity S1U%R(NNODES(NTEC,NPLAN)) S1V%R(NNODES(NTEC,NPLAN)) If UR > VCUT(ITEC) no CDTECTYPE(ITEC) yes 0 1
Evaluate drag coefficient that varies with distance (JDIST)
from the device HALFCDSCOSTHETA,
HALFCDSSINTHETA
Evaluate power output for each turbine PTEC(NTEC)
Drag / power output evaluated for all impacted
nodes? DO 1,NTEC 1,NPLAN 1,NNODES End SOURCE subroutine no yes
options: (i) a uniform drag distribution over the frontal area of the device and (ii) a spatially varying drag distribution. However, any number of drag distributions could easily be added to capture the drag characteristics of specific devices.
The computed drag forces are applied as implicit source terms in the U- and V- momentum equations (S1U%R and S1V%R, respectively) since the flow approaching an individual turbine is expected to be predominantly horizontal. However, a similar source term could easily be applied to the vertical momentum equation, if desired. Finally, the power output for each turbine (PTEC) is evaluated based on eqn. (2) and written to a FORMATTED RESULTS FILE at each time step.
VI. BENCHMARKING AND VALIDATION –SURFACE
-PIERCING CYLINDER
A. Methodology
A series of numerical tests were conducted to verify that the modifications of the TELEMAC-3D source code described in Section V performed as intended, in terms of modifying the velocity distribution in the downstream wakes of individual drag (turbine) elements.
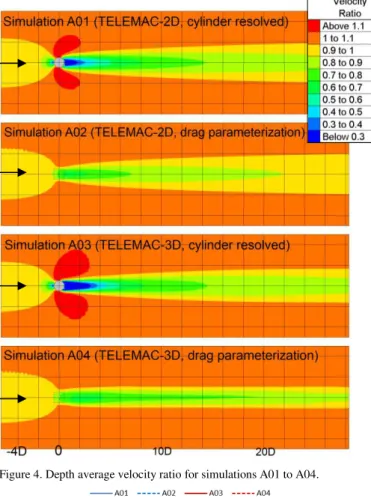
The first series of tests involved simulating the hydrodynamic response to a 1 m diameter surface-piercing (emergent) cylinder in a steady flow, modelled using four different approaches (numerical simulations listed as A01 to A04 in Table 1).
The objective of these simulations was to (a) establish general consistency between the 2D and 3D approaches to drag parameterization, and identify any differences, and (b) to assess the effectiveness of the parametric approaches (in 2D and 3D) in capturing wake velocity distributions downstream of a drag element (cylinder).
The simulations were carried out in a 50 m long by 10 m wide numerical flume, with a horizontal mesh resolution of 0.2 m, decreasing to 0.1 m in the immediate vicinity of the cylinder for simulations where it was fully resolved (A01 and A03).
TABLE 1.SUMMARY OF VALIDATION RUNS – VERTICAL CYLINDER Run
ID Simulation Type Description
A01 TELEMAC-2D
Cylinder fully resolved (i.e. represented as a land boundary in the mesh)
A02 TELEMAC-2D
Cylinder drag forces parameterized using the
DRAGFO subroutine activated using the VERTICAL STRUCTURES
keyword
A03 TELEMAC-3D Cylinder fully resolved
A04 TELEMAC-3D
Cylinder drag forces parameterized using the source code modifications
described in Section V
For the non-hydrostatic TELEMAC-3D simulations, nine fixed planes were specified at elevations of 0.0 m, 0.5 m, 1.0 m, 1.5 m, 2.0 m, 2.5 m, 3.0 m, 3.5 m and 4.0 m above the bottom. All simulations incorporated identical bed friction (uniform Strickler coefficient of 40 m1/3/s), turbulence parameters (constant eddy viscosity of 1 x 10⁻⁶ m2/s) and numerical parameters (default). The water depth was initialized to 4.0 m and fixed at the downstream boundary. The discharge at the upstream boundary was increased linearly from 0.0 m3/s to an arbitrary value of 10.0 m3/s over a period of 400 s and kept constant for the remainder of the simulation to reach approximately steady state conditions. The total duration of each simulation was 2,000 s. The depth-averaged velocity upstream of the cylinder was approximately 0.25 m/s, corresponding to a Reynolds’ number, Re = 2,500 (cylinder diameter length scale). This corresponds to a subcritical, laminar wake regime (e.g. p.349,[15]).
For simulations A01 and A03, the cylinder was centred in the flume at a location 10D downstream of the inlet, where D is the cylinder diameter for this series of tests. For simulations A02 and A04, which involved parametric (drag force) approaches to modelling the cylinder, a drag coefficient CD =1 was applied within a square of side D centred on the same location. CD = 1 is based on the following curve fit from White (p.210, [16]):
CD = 1 + 10.0Re-2/3, 1.0 < Re < 2 x 10⁵ (3) which is accurate for an infinitely long cylinder. For the three-dimensional simulation (A04), the local drag coefficient was doubled for the surface and near-bed layers, to account for observed free and fixed end effects on local drag coefficients (e.g. [6] [17]).
B. Results and discussion
The computed depth-averaged velocity ratios (the ratio of the local depth-averaged velocity magnitude to the value in the absence of the modelled cylinder) are shown in Fig. 4 for Simulations A01 to A04. Grid lines in Fig. 4 are at intervals of 2D. The wake velocity distributions for two-dimensional and three-dimensional simulations where the cylinder was fully resolved (A01 and A03) are broadly in agreement. Velocity gradients in the transverse direction (perpendicular to the flow) are somewhat higher and persist further downstream (i.e. slower wake recovery) in the TELEMAC-3D simulation (A03). It is noteworthy that simulation A03 was the only run to exhibit unsteady vortex shedding in the wake of the cylinder. The results for run A03 shown in Fig. 4 are therefore based on a temporal average of the last 18 minutes of the simulation, or 3T, where T is the observed period of vortex passage. For all other simulations, the results are based on the final time step of the simulation.
For simulations A02 and A04, the depth-averaged velocity ratio is overestimated along the flume centreline at distances less than 10D downstream of the cylinder (Fig. 5). This is not surprising since the displacement of fluid owing to the presence of the cylinder cannot be captured by the drag parameterization approach [18]. The velocity distribution will therefore be inaccurate in the immediate vicinity (within
XXIVth Telemac & Mascaret User Club Graz, Austria, 17-20 October, 2017
10-15D according to [19]) of the cylinder. At downstream distances greater than 10D, the two-dimensional drag parameterization (A02) continues to overestimate the velocity ratio by 8-10 %. In this region, the three-dimensional drag parameterization (run A04) more closely captures the centreline depth-averaged wake velocity distribution and the velocity ratio is generally within 3-4 % of the value for the simulation with a fully resolved cylinder (A03). A limited number of tests indicated the modelled velocities are sensitive to mesh resolution. For example, increasing the horizontal mesh resolution to 0.1 m for run A04 resulted in a 9% decrease in the centreline velocity ratio at a distance 30D downstream. Predicted velocities are also likely sensitive to drag coefficients, turbulence parameters, Re regime, and advection schemes. On a relative basis, the results demonstrate that the new TELEMAC-3D drag parameterization is comparable and consistent with the drag parameterization in TELEMAC-2D.
Figure 4. Depth average velocity ratio for simulations A01 to A04.
Figure 5. Depth average velocity ratio along the centreline of the flume for simulations A01 to A04.
Depth-averaged velocity gradients across the flume (normal to the direction of flow) in the downstream wake are higher for the TELEMAC-3D simulations compared to the TELEMAC-2D simulations. Since this applies to both the fully resolved cylinder and parametric drag scenarios, we hypothesize that this result may be sensitive to turbulence parameters. It is expected that higher eddy viscosities in the numerical model would result in smoother velocity gradients in the wake region, and shorter wake recovery distances.
VII. BENCHMARKING AND VALIDATION –PHYSICAL
MODEL OF SIMPLIFIED TURBINE (POROUS PLATES)
A. Methodology
Two numerical tests were conducted using the drag parameterization implemented in TELEMAC-3D (Section V), for comparison with physical model (laboratory) test results.
The physical model testing, described in the following section, involved using simplified model turbines (porous plates) in a flume to investigate wake velocity distributions under an imposed steady current. The flume geometry (0.05 m horizontal mesh resolution and 9 fixed, evenly spaced layers) and physical model scenarios were numerically replicated using TELEMAC-3D, wherein the porous plates were represented as drag elements. A drag coefficient of CD = 1.2 was assigned to the porous plates, based on the experimentally determined relationship between CD and plate porosity presented in Castro [20]. The horizontal drag force associated with the porous plates was then calculated based on CD and Ur (evaluated at 5D upstream) and applied locally at model nodes within the area occupied by the plates (i.e. following the approach described in Section V). Several turbulence closure schemes and parameter values were tested in the numerical model, including Smagorinsky, constant viscosity and mixing length models.
B. Physical model test set-up
A physical model of a simplified turbine and a turbine array was constructed in the 97 m long by 2 m wide Large Wave Flume (LWF) at the National Research Council of Canada’s laboratory in Ottawa (Fig. 6). Using information provided by project partners, the dimensions of common cross-flow turbines at prototype scale, as well as river dimensions and flow speeds, were scaled to suit the geometry of the LWF. The LWF is equipped with a current generation system comprised of 12 electrically-powered variable speed thrusters installed in a tunnel below the flume sub-floor. When activated, the thrusters generate a steady circulation within the tunnel and in the open space above the sub-floor. The current speed and direction is regulated by adjusting the rotation speed of the thrusters.
Porous plates were used to represent a simplified RHE turbine in the physical model. The porous plate extracts energy from the flow through small scale turbulence caused by the water flowing through the holes in the plate, to simulate extraction of energy by a rotating turbine. The porous plate used in the model was 0.3 m wide (transverse direction in the flume) and 0.2 m tall (vertical dimension)
and had a porosity of approximately 40 % (i.e. holes comprised 40 % of the total area of the plate). For this phase of the testing, the model represented a typical turbine at a geometric scale of approximately 1:20.
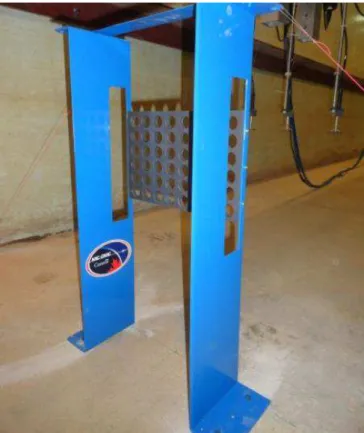
A total of 48 holes of 0.025 m diameter were drilled into the 12 mm thick PVC plate to create the simplified turbine. The plate was mounted to a support made from 2.6 mm sheet metal. The plate support was designed to minimize interference with the flow and the downstream wake field emanating from the simplified model turbine. The support (Fig. 7) was 0.69 m tall and 0.15 m long and included a 0.05 m wide by 0.3 m high gap immediately upstream of the plate. This gap allowed the flow to travel unobstructed around the sides of the porous plate. The upstream edges of the plate supports were grinded into knife edge profiles to minimize flow disturbance by the support itself. The support was levelled and anchored into the bottom of the flume, and stabilized with wires connected to the side of the flume. The resulting structure was stiff and exhibited minimal vibration during testing.
The simplified turbine models were placed in two arrangements: (i) Configuration B01 – a single turbine approximately 28.5 m downstream of the flow inlet and centred within the flume (Fig. 7); and (ii) Configuration B02 – two turbines side by side and separated by a distance of 0.3 m (Fig. 8).
The simplified turbine models were subjected to steady flow conditions (undisturbed streamwise depth-averaged velocity of approximately 0.7 m/s and water depth of approximately 0.75 m). A series of velocity measuring devices were used to characterize the velocity distribution in the wake of the porous plate. The instrumentation included one Valeport 2-axis electromagnetic current meter (ECM) and five Vectrino 3-axis acoustic Doppler velocimeters (ADVs). Velocities were measured on a pre-determined grid extending up to 40D downstream of the simplified turbines (where D = 0.2 m).
Figure 6. Longitudinal view of the large wave flume at NRC’s Ottawa laboratory.
Figure 7. Simplified model turbine consisting of porous plate and supports.
Figure 8. Configuration B02 – two simplified model turbines.
This experimental data will be used in future phases of the research project to calibrate and validate a CFD model of the simplified turbines, followed by physical and CFD modelling of more realistic cross-flow turbines.
C. Results and discussion
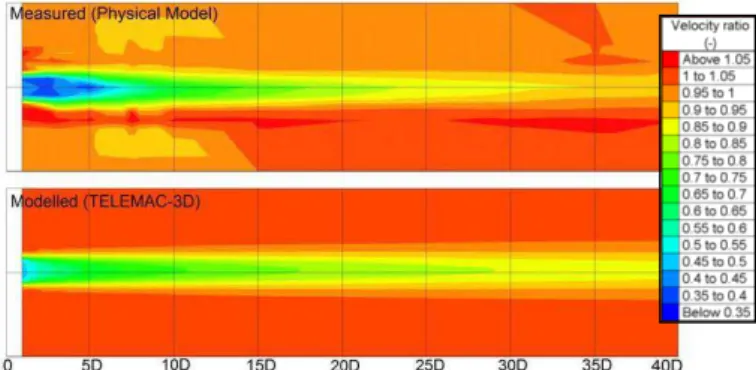
Contour plots showing measured (from physical model tests) and modelled (TELEMAC-3D) velocity ratios downstream of the porous plates at an elevation of 0.45 m above the bottom are shown in Fig. 9 (Configuration B01 – one porous plate) and Fig. 10 (Configuration B02 - two porous plates). This elevation represents approximately the mid-height of the porous plates. The results shown in Fig. 9
XXIVth Telemac & Mascaret User Club Graz, Austria, 17-20 October, 2017
and Fig. 10 are for the turbulence parameters that gave best overall agreement (from visual assessment) with measured wake velocity distributions. This corresponded to a Prandtl mixing length model for vertical turbulence and a constant horizontal eddy viscosity of 1 x 10⁻³ m2/s.
Measured and modelled velocity ratios along the centreline of the flume at an elevation of 0.45 m above the bottom are shown in Fig. 11 (Configuration B01 – one porous plate) and Fig. 12 (Configuration B02 - two porous plates). Modelled velocity ratios are shown for the “best fit” turbulence parameters described above, and for simulations incorporating constant horizontal and vertical eddy viscosities of 1 x 10⁻⁶ m2/s. The downstream wake recovery predicted by TELEMAC-3D is sensitive to the applied turbulence parameters. During physical model testing, it was observed that the measured wake recovery is strongly dependent on ambient turbulence in the flume (controlled by introducing roughness elements upstream), and that higher turbulence intensities resulted in shorter wake recovery distances. This observation is consistent with the delayed wake recovery observed in the TELEMAC-3D model results for simulations with relatively low, constant eddy diffusivities. Higher diffusivities in the numerical model result in smoothing of velocity gradients in the wake of the plates, and shorter wake recovery distances (in some cases leading to overshoot, as shown in Fig. 12).
Figure 9. Velocity ratios at elevation z = 0.45 m downstream of the single porous plate (Configuration B01).
Figure 10. Velocity ratios at elevation z = 0.45 m downstream of the two porous plates (Configuration B02).
Figure 11. Flume centreline velocity ratios at elevation z = 0.45 m downstream of the single porous plate (Configuration B01).
Figure 12. Flume centreline velocity ratios at elevation z = 0.45 m, midway between and downstream of the two porous plates (Configuration B02).
VIII. CONCLUDING REMARKS
A drag parameterization in TELEMAC-3D was implemented and described, with preliminary validation using: (i) numerical model results for an emergent cylinder in steady flow; and (ii) physical model test data for simplified hydrokinetic turbines (porous plates) in steady flow. The methodology shows some promise in capturing RHE turbine wake velocity distributions at distances of 10 to 15 turbine diameters downstream from the device. However, a number of limitations and issues remain to be addressed before the approach can be successfully integrated in RHE resource assessments. Some of the key limitations are described as follows.
A. Blockage, drag coefficients and reference velocities For a specific device, power and drag coefficients are intrinsically linked to the location where the reference velocity, Ur, is specified or calibrated. The reference velocity location is typically chosen sufficiently far upstream that the flow is not disturbed by the presence of the turbine device (i.e. such that Ur is the free-stream or undisturbed flow speed). This approach is expected to be valid for a single device or row of devices where the cumulative blockage area for all turbines is less than 5 % of the channel cross-sectional area within the project site. Such conditions are not unusual for in-stream tidal energy projects. However, RHE turbine farms generally require multiple rows of turbines and/or the channel blockage may exceed 5 %. The concept of a free-stream flow velocity is therefore unlikely to be valid for most RHE projects. This is perhaps the most significant limitation of the methodology described in this paper, in terms of its usefulness for evaluating power extraction and wake velocity distributions at potential RHE generation sites.
The drag parameterization approach described in this paper cannot accurately predict wake velocity distributions in the
immediate vicinity of turbines (within about 10-15D), which sets a minimum distance between turbines in an array for the methodology to remain valid. Allowing for an additional buffer distance upstream of each device (corresponding to the distance to the reference velocity location), the turbine spacing limit at which the approach is valid may be prohibitively large at some sites. Modifications of the parameterization in TELEMAC-3D could be explored to partially address this limitation, such as the introduction of porosity in the momentum equations (e.g. p. 43, [18]).
In closely packed arrays of turbines, accurately modelling turbine wake velocities, turbulence, and turbine-wake interactions becomes more important [11]. In densely packed arrays, a simple extrapolation of the results for isolated turbines is not appropriate. CFD and laboratory studies combining multiple turbines in different array configurations are needed to provide a unified description of drag and power at scales ranging from individual drag elements (turbines) to river reaches. Previous research investigating hydrodynamics, drag, and wake interactions in arrays of aquatic vegetation may offer valuable insight ( [21] [22], and references therein).
Recent research [19] suggests that the average flow speed through the turbine (aperture velocity) may offer a better alternative for the reference velocity in comparison to the free-stream velocity since this perturbed value is independent of the channel blockage. However, measuring or simulating flow velocities in the aperture of a moving cross-flow turbine to support the evaluation of drag and power coefficients is not a trivial task. Further laboratory and CFD modelling work is needed to investigate the practicality of this approach. Minor additional modifications of the TELEMAC-3D source code presented here would be needed to facilitate a change in the reference velocity. However, an understanding of the relationships between local velocities and velocities upstream of the turbine remains important to avoid mesh-dependent results [11].
B. Wake characteristics
Accurately modelling the characteristics of the turbine near-wake (velocity deficit and turbulence) is critical for optimizing turbine placement within an array. Although the results presented here indicate some promise in modelling wake velocity distributions at distances downstream of RHE turbines, some discrepancies in the predicted wake recovery distances were identified as discussed. It is anticipated that further calibration or tuning of turbulence closure models and mesh sensitivity testing would lead to improved results. Correction terms could be added to turbulence closure models to account for the turbulent kinetic energy production by turbines [1]. Recent research [19] suggests that the implementation of spatially and temporally varying drag coefficients could also facilitate improved predictions of turbine wake characteristics. The TELEMAC-3D source code posted on the openTELEMAC-MASCARET web forum includes an example where the drag coefficient can optionally be specified as having a Gaussian distribution in space. The addition of alternative spatial distributions or Reynolds number-dependent drag coefficients would require trivial programming effort.
ACKNOWLEDGEMENTS
The authors gratefully acknowledge funding and contributions to this work received from Natural Resources
Canada, the National Research Council of Canada, Marine Renewables Canada, Mavi Innovations, Inc., and Université Laval. Sean Ferguson’s helpful editorial comments on the draft manuscript are appreciated by the authors.
REFERENCES
[1] T. Roc, D. Greaves, K. M. Thyng, and D. C. Conley, “Tidal turbine representation in an ocean circulation model: Towards realistic applications,” Ocean Engineering, 78, pp.95-111, 2014.
[2] C. Moulinec, C. Denis, C. T. Pham, D. Rougé, J.-M. Hervouet, E. Razafindrakoto, R. W. Barber, D. R. Emerson, and X. J. Gu, “TELEMAC: An efficient hydrodynamics suite for massively parallel architectures,” Computers & Fluids, 51(1), pp.30-34, 2011.
[3] B. M. Sumer, “Hydrodynamics Around Cylindrical Structures,” Advanced Series on Ocean Engineering, vol. 26, World Scientific, 2006.
[4] O. Bertrand, L. Duron, C. Girard, J. Zanette, and F. Dominguez, “Numerical modelling of vertical-axis and transverse-flow hydrokinetic turbine in the river Loire,” E-proceedings of the 36th IAHR World Congress, 2015.
[5] S. E. Bourban, N. D. Durand, T. T. Coates, L. Gill, M. Harper, and R. Stephen, “Modelling tidal energy resource and extraction,” Coastal Engineering Proceedings, 1(32), 2011.
[6] J. R. Chaplin, and P. Teigen, “Steady flow past a vertical surface-piercing circular cylinder,” Journal of Fluids and Structures, 18(3), pp.271-285, 2003.
[7] A. Cornett, N. Durand, and M. Serrer, “3-D Modelling and assessment of tidal current resources in the Bay of Fundy, Canada,” in Proc. 3rd Int. Conf. on Ocean Energy, 2010.
[8] A. Joly, C.-T. Pham, M. Andreewsky, S. Saviot, and L. Fillot, “Using the DRAGFO subroutine to model Tidal Energy Converters in Telemac-2D,” Proc. 22nd Telemac & Mascaret User Club, October 2015.
[9] A. Pérez-Ortiz, J. Pescatore, and I. Bryden, “A systematic approach to undertake tidal energy resource assessment with Telemac-2D,” in 10th European Wave and Tidal Energy Conference (EWTEC), 2013. [10] C. T. Pham, and V. A. Martin, “Tidal current turbine demonstration
farm in Paimpol-Brehat (Brittany): tidal characterisation and energy yield evaluation with Telemac,” in Proceedings of the 8th European Wave and Tidal Energy Conference, vol. 710, 2009.
[11] S. C. Kramer, and M. D. Piggott, “A correction to the enhanced bottom drag parameterisation of tidal turbines,” Renewable Energy, 92, pp.385-396, 2016.
[12] G. Sutherland, M. Foreman, and C. Garrett, “Tidal current energy assessment for Johnstone strait, Vancouver island,” Proceedings of the Institution of Mechanical Engineers, Part A: Journal of Power and Energy, 221(2), pp.147-157, 2007.
[13] T. Roc, D. C. Conley, and D. Greaves, “Methodology for tidal turbine representation in ocean circulation model,” Renewable Energy, 51, pp.448-464, 2013.
[14] G. W. Rawlings, “Parametric Characterization of an Experimental Vertical Axis Hydro Turbine,” MSc. Thesis, University of British Columbia, Vancouver, 2009.
[15] P. K. Kundu, and I. M. Cohen, “Fluid Mechanics, 3rd ed., Elsevier, 2004, 759 pp”.
[16] F. M. White, “Viscous Fluid Flow, McGraw-Hill, 1974”.
[17] D. Poggi, A. Porporato, L. Ridolfi, J. D. Albertson, and G. G. Katul, “The effect of vegetation density on canopy sub-layer turbulence,” Boundary-Layer Meteorology, 111(3), pp.565-587, 2004.
[18] J.-M. Hervouet, “Hydrodynamics of free surface flows: modelling with the finite element method,” John Wiley & Sons, 2007.
[19] V. Klaptocz, J. Cousineau, G. Dumas, and T. Kinsey, “Quantifying extractable power in a stretch of river using an array of MHK
XXIVth Telemac & Mascaret User Club Graz, Austria, 17-20 October, 2017
turbines.,” Report prepared for Marine Renewables Canada, March 2016.
[20] I. P. Castro, “Wake characteristics of two-dimensional perforated plates normal to an air-stream,” J. Fluid Mech., 46, pp. 599-609, 1971. [21] H. M. Nepf, “Drag, turbulence, and diffusion in flow through emergent vegetation,” Water resources research, 35(2), pp.479-489, 1999.
[22] M. Luhar, and H. M. Nepf, “From the blade scale to the reach scale: A characterization of aquatic vegetative drag,” Advances in Water Resources, 51, pp.305-316, 2013.
![Figure 1. Vertical axis turbine (image source: [14])D/2](https://thumb-eu.123doks.com/thumbv2/123doknet/14056410.460772/3.892.464.780.896.1083/figure-vertical-axis-turbine-image-source-d.webp)